
Remember me
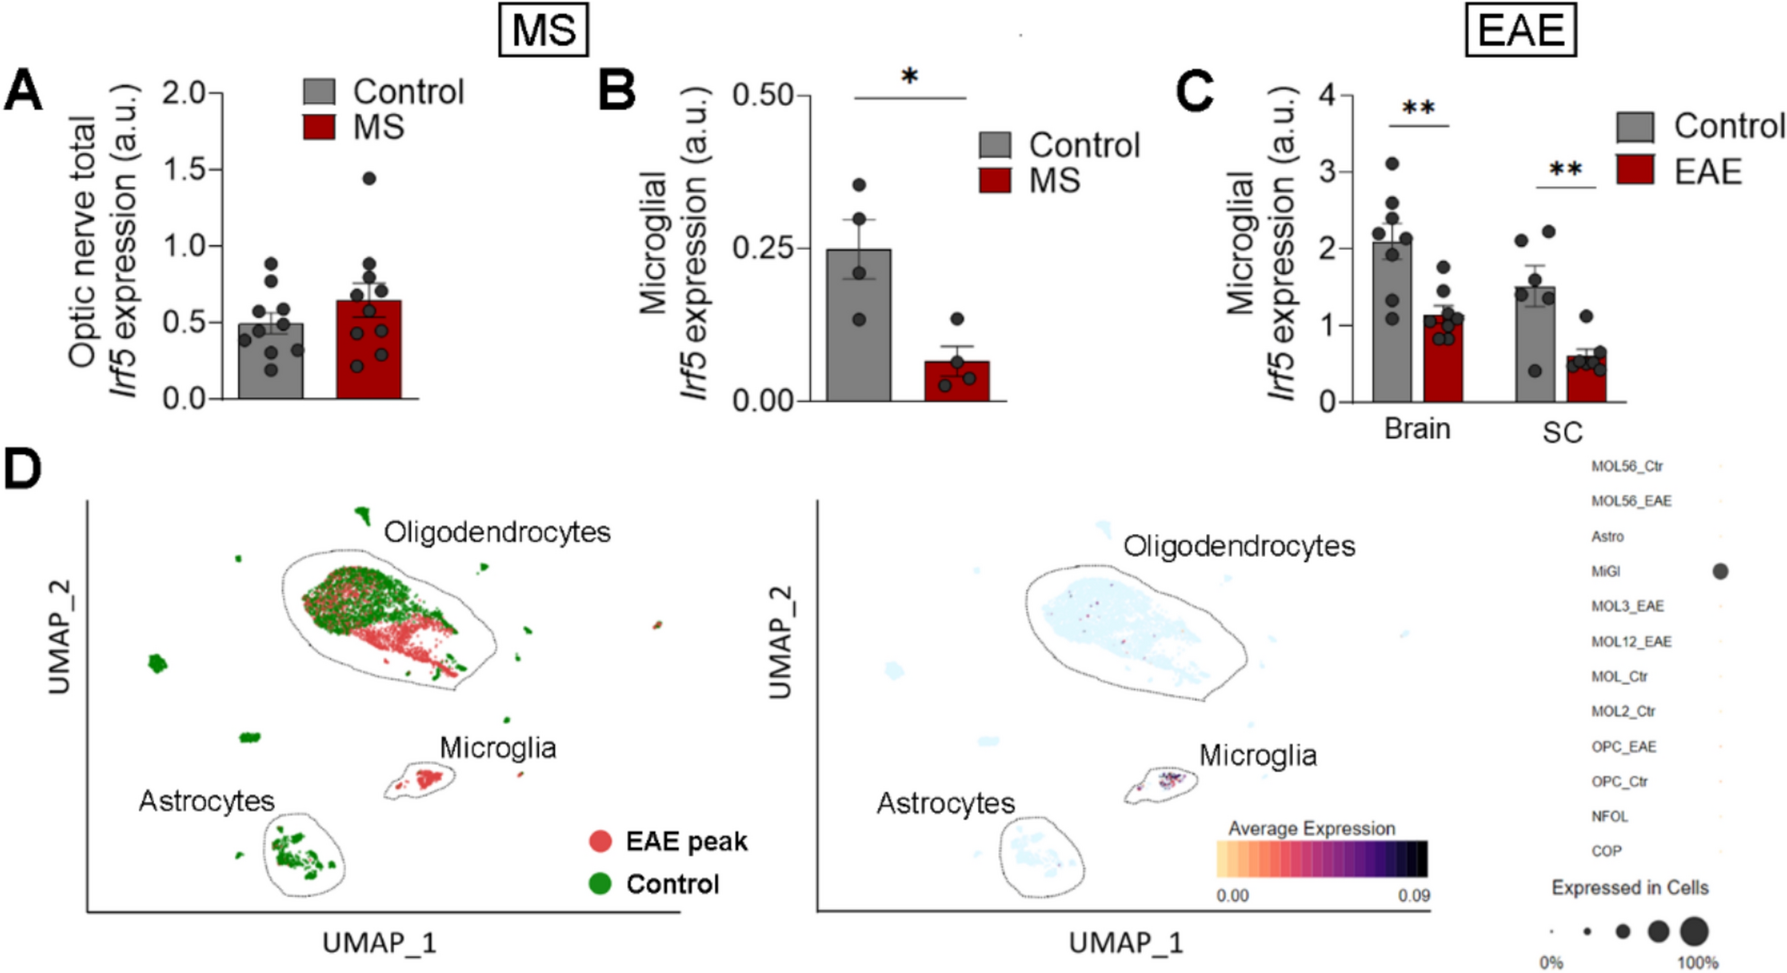


Irf5 is a transcription factor whose expression increases during inflammation and plays a key role in pro-inflammatory activation of microglia, contributing to their P2X4+ reactive state [12, 14]. This state is linked to enhanced myelin phagocytosis and remyelination in the EAE model [11]. To address whether Irf5 expression is altered during demyelination in human, we assessed its expression in tissues coming from MS patients. We did not detect differences in the expression of IRF5 transcription factor in total RNA from post-mortem optic nerve samples of control and MS patients [23], as analyzed by qPCR, (Fig. 1A), suggesting that this gene is not upregulated during the development or at late stages of the disease. However, an in silico analysis of available data obtained by single-cell RNA sequencing of tissues coming from healthy humans and active multiple sclerosis patients [33] showed that Irf5 is downregulated in microglial cells in the pathology (Fig. 1B; n = 4). We further analyzed microglia specific expression of Irf5 after EAE immunization. Whereas an increase in Irf5 expression was detected in total spinal cord RNA both at EAE peak and chronic phase [11], the specific expression of Irf5 in FACS-isolated microglia (Cd11b+CD45high) decreased at EAE (Fig. 1C). Irf5 is expressed almost exclusively in microglia in CNS parenchyma (Fig. 1D, Sup. Fig.1A), and upregulation of Irf5 in total RNA after EAE correlated with an increase in the microglia/infiltrating macrophage population, as evidenced by the increased expression of their classical markers Iba1 and Cd11b (Sup. Fig. 1B). Thus, the global increase in Irf5 expression probably reflects an increase in the number of cells expressing this transcription factor, rather than a change at single-cell level.
Fig. 1
Microglial Irf5 expression is decreased in MS patients. A Relative expression of Irf5 in total mRNA isolated from post-mortem optic nerve samples of control and MS patients (n = 10) as analyzed by qPCR. B In silico quantification of microglial Irf5 expression in healthy and early active MS human brain tissues (n = 4). Raw data obtained from Gene Expression Omnibus (accession number: GSE124335). Data are presented as mean ± SEM and were analyzed by Student's t‐test (A, B, D) and by one-way ANOVA (C). *p < 0.05, **p < 0.01, ***p < 0.001. C Relative expression of Irf5 in FACS isolated microglia (CD11b+/CD45low) from the brain and spinal cord of control mice and from EAE mice at chronic phase (n = 6–8). D Reanalysis of Irf5 expression from scRNAseq data obtained at EAE peak [31, 33]
We then addressed the impact of Irf5 deletion on EAE progression. We observed a significant delay in the onset of motor symptoms in Irf5-/- mice compared to WT ones (Fig. 2A, B), suggesting a role of this transcription factor in peripheral immune priming, as previously stated for other IRF transcription factors [40]. Despite this initial delay, Irf5-/- mice showed no difference in the maximal neurological score at EAE peak (Fig. 2A, B). However, Irf5-/- mice presented exacerbated neurological scores at EAE chronic phase (Fig. 2A, B) and showed an increase in the time necessary to initiate recovery (Fig. 2B), suggesting that IRF5 may be needed for EAE recovery. At histological level, demyelinated lesions, defined by the presence of myelin loss or damage, tended to be larger although this change was not statistically significant (Fig. 2C; p = 0.074). However, we found a higher accumulation of Iba1+ cells inside the lesions and an increase in axonal damage (assessed with SMI32 marker) in Irf5-/- mice (Fig. 2C). These observations confirm the exacerbation of tissue damage in Irf5-/- mice at EAE chronic phase.
Fig. 2
IRF5 deficiency exacerbates EAE recovery phase. A Neurological score of WT and Irf5-/- mice (n = 10 mice per group; one representative experiment of three independent experiments). B Histograms showing clinical parameters associated to EAE induction (onset day) and recovery (days needed to initiate recovery and percentage of recovery from peak), in WT and Irf5-/- mice (n = 13–20). C Representative images of lumbar spinal cord EAE lesions (top), Iba1 (middle) and SMI32 staining’s (bottom) in WT and Irf5-/- mice. Immunohistochemistry was performed at 40 post-immunization. Scale bar = 30 µm. Histograms show the extent of the lesions in relation to the total white matter area of the section analyzed (n = 6–8) and the accumulation of Iba1+ microglia/macrophages (n = 6–11) as well axonal damage (SMI-32) in relation to the lesioned area or the total white matter area, respectively (n = 5). D Representative images showing the accumulation of CD3+ T cells and B220+ B cells in EAE lesions of WT and Irf5-/- mice at day 40 post-immunization. Scale bar = 30 µm. Histograms show the number of cells normalized to the white matter area (n = 6–8). Data are presented as means ± SEM. Statistics were performed with Mann-Whitney U test (neurological score, A) and Student's t–test (B-D). **p < 0.01, ***p < 0.001.
Since IRF5 is a transcription factor involved in immune response, the worsening of neurological symptoms in the chronic phase of EAE could be linked to changes in this response. To test this hypothesis, we analyzed the immune response at EAE chronic phase. We did not observe any significant difference in the accumulation of T cells or B cells in the lesions, assessed by CD3 and B220 staining respectively, at EAE chronic phase (Fig. 2D). To delve into the immune response, we also measured the levels of CD4+ and CD8+ cells in the spinal cord, as well as the different CD4+ T cell subtypes in spinal cord and peripheral immune organs, by qPCR. We did not find significant alterations in the expression of Cd4 or Cd8 (Fig. S2A), nor in the expression of FoxP3, Ror and Ifnγ, signature genes for Treg, Th17 and Th1 cells, respectively (Fig. S2B). These results suggest that the differences observed in EAE chronic phase are not due to alterations in the adaptive immune response. As IRF5 is known to be involved in regulating microglia/macrophage response [14, 15], we next analyzed whether Irf5 deletion could shift microglia activation. The expression of different pro-inflammatory and anti-inflammatory genes in microglia was upregulated in Irf5-/- mice at EAE chronic phase, as analyzed by Fluidigm qPCR (Fig. S2C), correlating with an increase in Iba1 and Cd11b (Fig. S2D), but no significant shift was detected in the pro- versus anti-inflammatory profiles. Altogether, these data suggest that IRF5 transcription factor is necessary to EAE recovery through a mechanism different from its classic modulatory role of the immune response.
IRF5 deficiency worsens LPC-induced demyelination and alters oligodendrocyte recruitmentTo confirm that IRF5 is essential for remyelination, as suggested by our EAE data, we employed a chemically induced demyelination model. This model, in which demyelination does not involve the immune system, is more suitable for studying the mechanisms of remyelination [24]. We induced focal demyelinating lesions in wild-type (WT) and Irf5-/- mice by injecting 1% lysophosphatidylcholine (LPC) into the white matter tracts of the spinal cord. The lesions were histologically analyzed 14 days later (Fig. 3A), when oligodendrocyte precursor cells (OPCs) had been recruited into the lesions, differentiated into mature oligodendrocytes, and begun the remyelination process [24].
Fig. 3
IRF5 deficiency alters remyelination after lysolecithin (LPC)-induced lesions. A Scheme showing the experimental design of LPC-induced demyelinated lesions. Analysis was performed at 14 post-injection, a time coincident with the initiation of the remyelinating response. B Representative images of MBP and Iba1 stainings in LPC lesions of WT and Irf5-/- mice. Scale bar = 75 µm. Histograms show the extent of demyelinated area and the accumulation of microglia in the lesions in each mice (n = 4). C Assessment of the number of Olig2+ and CC1+ oligodendrocytes in LPC-induced lesions, delineated by MBP loss (n = 3–4). Scale bar = 75 µm. D Distribution analysis (mean ± SD) of MBP (left), Olig2 (middle) and CC1 (right) immunostaining, in an area comprising equal distances of lesioned and non-lesioned white matter (lesion border indicated with dotted lines; n = 4). Note the higher accumulation of Olig2+ and CC1+ cells outside the lesion core. Data are presented as means ± SEM. Statistics were performed with Student's t-test. *p < 0.05
In accordance with the EAE results, Irf5-/- mice showed an exacerbated pathology upon LPC injections, presenting larger lesions (Fig. 3B) at 14 days post-injection. Moreover, Irf5-/- mice presented more abundance of infiltrating CD3+ T cells in the lesions at 14 days post-injection (Fig. S3A), indicative of an aberrant or exacerbated inflammatory and immune response in response to myelin damage. In spite of these results, we did not detect more axonal damage as determined by SMI32 immunostaining (Fig. S3B). Regarding the remyelination process, we detected a decrease in the total number of oligodendrocytes, determined by the Olig2 marker, in the lesions of Irf5-/- mice (Fig. 3C). Similarly, we found a diminished population of mature oligodendrocytes in these animals, assessed by CC1 staining (Fig. 3C); nevertheless, the proportion of myelinating CC1+ Olig2+ cells in relation to the total Olig2+ population was not different between genotypes (Fig. 3C). This points out to an alteration in oligodendrocyte recruitment, and not in their differentiation capacity. This feature is accompanied by an abnormal distribution of oligodendrocytes within the lesions. Both Olig2+ and CC1+ oligodendrocytes were mainly disposed in the lesion border and peri-lesion in Irf5-/- mice, rather than in the lesion core delineated on the basis of MBP immunoreactivity loss (Fig. 3C and Fig. 3D), suggesting impaired recruitment of oligodendrocytes into the lesion core in Irf5-/- mice. Altogether, these findings corroborate that IRF5 is necessary for a proper remyelination response.
Transcriptional profiling of Irf5 -/- microglia shows alterations in metabolism and intracellular signalingSince microglia play a critical role in successful remyelination [41, 42], and IRF5 regulates microglia responses [15, 16], we performed bulk RNA sequencing on FACS-sorted microglia to identify signaling pathways regulated by Irf5 in these cells. We FACS-sorted microglia (Cd11b+ CD45low Ly6C- population; gating strategy in Fig. 4A) from the spinal cords of control WT and Irf5-/- mice (Fig. 4A). We detected a high number of differentially expressed genes between WT and Irf5-/- mouse microglia (Fig. 4B; DEGs had a log (Fold Change) > 1 and adjusted p-value < 0.05). GO enrichment analysis revealed that genes downregulated in Irf5-/- microglia are associated with GTPases signaling, such as “Regulation of GTPase activity” or “CDC42 GTPase cycle” (e.g., Bcr, Arap1, Arap3), but mostly linked to metabolism and specifically to lipid metabolism, including “Phosphatidylinositol biosynthetic process”, “Lipoprotein metabolic process”, “LDL clearance” or “Cholesterol biosynthesis” (e.g., Npc1, Ldlr, Srebf1/2, Hdlbp, Rxrb...). Moreover, we also observed an association of these downregulated genes with “Endocytosis” or “Fc gamma R-mediated phagocytosis” (e.g., Elmo2, Dnm2). All these transcriptional alterations observed in Irf5-/- microglia could potentially be the root for the unsuccessful remyelination in mice lacking IRF5 (Fig. 4C, D). Predictably, other enriched GOs were related to inflammation and specific immune responses (not shown).
Fig. 4
RNA sequencing of WT and Irf5-/- microglia highlights novel roles for IRF5. A (Above) Experimental strategy for isolating spinal cord microglia at 4 ºC to avoid overactivation and RNA sequencing. (Below) Flow cytometry gating strategy for isolation of microglia from the spinal cord of WT and Irf5-/- mice. B Volcano plot depicting gene expression comparison between WT and Irf5-/- microglia. Each dot represents an individual gene. Non-significant genes are marked in gray while significant ones (log2 (FC) > 1 and p-value < 0.05) are marked in colour. C GO enrichment analysis of the DEGs identified between WT and Irf5-/- microglia, showing the top GOs enriched in WT condition. Green plot shows annotations downregulated in Irf5-/- microglia. D Histograms showing alterations in genes involved in GTPase activity (top left), endocytosis (top right) and lipid homeostasis (bottom) (n = 3–4). E GO enrichment analysis of the DEGs identified between WT and Irf5-/- microglia, showing the top GOs enriched in KO condition. Orange plot shows annotations downregulated in knock-out microglia. Data are presented as means ± SEM. Statistics were performed with Student's t–test.*p < 0.05
Conversely, IRF5-deficient microglial cells upregulated genes associated with specific immune responses such as “Regulation of viral processes” (e.g., C3) or “Positive regulation of TLR4” (e.g., Wdfy1) (Fig. 4E); this is expected to be linked to the well-known role of IRF5 in immunity. Moreover, these cells also upregulated pathways associated with DNA transcription or response to DNA damage, such as “Generic Transcription Pathway”, “Response to ionizing radiation” “Regulation of DNA damage response”, “Regulation of DNA binding” or even “Macromolecule biosynthetic process” (e.g., Bcl2, Brf2 or different zinc finger proteins) (Fig. 4E). This outcome could be explained on the basis of the described pro-apoptotic and pro-cell cycle arrest functions of IRF5, which also participates in the p53 pathway [43, 44].
The transcriptional profiling of Irf5-/- microglia highlights the relevance of this transcription factor in these cells. It revels its modulatory role in intracellular pathways beyond the expected immune responses and in processes that are crucial for successful remyelination.
Irf5-/- microglia show reduced motility in vitroGTPases, particularly the Rho family of small GTPases (Rho, Rac, and Cdc42), play a crucial role in regulating the dynamic organization of the intracellular actin cytoskeleton. As a result, their pathways can affect a wide range of functions, such as cellular motility and phagocytosis [45, 46]. Indeed, Cdc42 signaling is essential for both microglial migration and the phagocytosis of degenerating neurons [47]. Given the observed downregulation of GTPase pathways in Irf5-/- microglia compared to WT cells, we hypothesized that these functions might be compromised.
First, we performed wound healing assays on WT and Irf5-/- cultured microglia to test their migratory capacity and found that, after 24 hours, IRF5-deficient microglia were less efficient than WT cells repopulating the scratched area (Fig. 5A). This highlights that the altered GTPases signaling in Irf5-/- microglia lead to abnormal motility in vitro, a fact that could affect microglial response to demyelination in vivo. Indeed, macrophages lacking other member of this family, IRF8, cannot migrate toward the epicenter of spinal cord lesions and remain widely scattered [48]. However, we did not detect major changes in microglial migration towards the EAE or LPC lesions at the chronic phase (30–35 days for EAE and 14 days for LPC; see Fig. 2C and 3B). To further check the impact of IRF5 deficiency on microglial migration towards demyelinating lesions, we histologically analyzed LPC-induced lesions at 4 days post-injection, a time point coincident with microglia/macrophage arrival (Fig. 5B) [24]. At this stage, there was no significant difference in the arrival of Iba1+ microglia/macrophage migration into the lesions of WT and Irf5-/- mice. Rather, Irf5-/- mice showed more Iba1 immunoreactivity in the demyelinated areas than WT mice did at this timepoint (Fig. 5C). Moreover, at this timepoint, there was no difference in the extent of demyelinated area between WT and Irf5-/- mice (Fig. 5C), suggesting no differences at initial demyelination responses after LPC (Fig. 5C).
Fig. 5
Irf5-/- microglia showed altered motility in vitro but not after demyelination. A Representative frames of the wound healing assay performed on WT and Irf5-/- microglia, at the initial time of the experiment as well as after 12 and 24 hours. Yellow lines delimitate the scratched, non-occupied area at each timepoint. Scale bar = 10 µm. Histograms below show the percentage of the initially scratched area occupied by microglial cells (n = 3 independent experiments). B Scheme showing the experimental design for the histological analysis of microglial migration after LPC demyelinating lesions, in WT and Irf5-/- mice, at day 4 post-injection. C Representative confocal images of LPC-induced lesions 4 days after injection, showing MBP and Iba1 immunostaining. Scale bar = 100 µm. Histograms show the extent of demyelinated area in WT and Irf5-/- mice and Iba1+ immunoreactivity in relation to the lesioned area in each animal (n = 4–5). Data are presented as means ± SEM. Statistics were performed with Student's t–test.*p < 0.05
These data suggest that, although Irf5-/- microglia showed some reduced motility in vitro, this deficit does not appear to be responsible for the changes observed in the demyelinating models. Additionally, since the LPC-induced lesions showed no differences between genotypes at early stages, this points out to secondary mechanisms influencing later remyelination events.
IRF5 deletion alters myelin clearance both in vivo and in vitroMyelin clearance from the lesions by myeloid cells is essential for an efficient regenerative response [9, 49]. Since RNA sequencing revealed downregulation in the endocytic and phagocytic pathways in Irf5-/- microglia, we next analyzed whether deficiencies in microglial phagocytosis of myelin could contribute to the regeneration failure observed in Irf5-/- mice.
First, we analyzed whether IRF5-deficient animals accumulated more myelin debris after demyelination. Indeed, Irf5-/- mice showed a higher accumulation of disrupted or fragmented myelin both in EAE chronic phase and 4 days after LPC injections in the spinal cord (Fig. 6A, B). Damaged myelin yields higher MBP immunoreactivity due to the unmasking of protein epitope [11]. Moreover, we quantified myelin phagocytosis by microglia/macrophage in EAE lesions, assessing the presence of MBP+ debris inside Iba1+ ROIs that include the whole cytoplasm, processes and pouches using custom Image J macros. Irf5-/- mice showed a higher phagocytic index (% of blobs within microglia), meaning a higher accumulation of myelin debris in microglia cells pouches or cytoplasm (Fig. 6C). We observed that myelin debris size was bigger and preferentially located in the phagocytic processes of Irf5-/- Iba1+ cells. In contrast, WT microglia presented more abundance of partially degraded myelin in the cytoplasm (Fig. 6C). Thus, although Irf5-/- microglia showed an increase in myelin phagocytosis or accumulation, the differential size and distribution of myelin debris may indicate an impairment in myelin degradation after endocytosis.
Fig. 6
Myelin phagocytosis and degradation are altered in Irf5-/- microglia both in vitro and after demyelination. A Representative images of myelin debris accumulation (characterized by high MBP immunoreactivity) in WT and Irf5-/- EAE lesions, at the recovery phase. Scale bar = 50 µm. Histogram shows the lesioned area occupied by this debris in each section (n = 3). B Representative images of myelin debris accumulation at day 14 post-LPC demyelinating injections, in WT and Irf5-/- mice. Scale bar = 10 µm. Histogram shows the lesioned area occupied by this debris in each animal (n = 3–4). C Representative images of MBP and Iba1 immunostaining in spinal cord sections of WT and Irf5-/- mice. Insets show higher magnifications of the indicated boxes. Scale bar = 20 µm. Histogram shows the phagocytic index of microglia/macrophages in these conditions (n = 3). D Representative images showing phagocytosis (1h) and degradation (24h) of Alexa-488 labelled-myelin by WT and Irf5-/- microglia in vitro. Scale bar = 50 µm. Histogram shows the fluorescence of 488-myelin in the cells, defined as ROIs using Iba1 staining (n = 6 independent experiments). Data are presented as means ± SEM. Statistics were performed with Student's t–test. *p < 0.05, ***p < 0.001
To further explore myelin phagocytosis, myelin was isolated from adult mouse whole brain using sucrose gradient [37], labelled with the dye Alexa-488 and added to microglia cultures. In order to efficiently clear up myelin, microglia should internalize myelin and deliver it to lysosomes to degrade it. We monitored by confocal microscopy myelin engulfment (1h) and myelin degradation later on (24h). We observed a significant decrease in myelin engulfment in Irf5-/- microglia after 1h (Fig. 6D). Moreover, while WT microglia properly degraded the internalized myelin after 24 hours, Irf5-/- microglia showed a faulty degradatory process (Fig. 6D).
These findings suggest that IRF5 deficiency is linked to alterations in myelin phagocytosis and/or degradation, which could be the underlying cause of the regeneration failures observed in Irf5-/- mice in response to demyelination.
IRF5 deficiency impairs lipid homeostasis and myelin metabolism after demyelinationFor debris clearance to be effective towards repair, microglia must also process their internalized cargo and dispose of it appropriately [8, 9, 50, 51]. Microglia can degrade myelin debris at lysosomes into sterols that help resolve inflammation. However, myelin also causes an overload of cholesterol, which must be released through specific transporters or stored in lipid droplets to avoid toxicity [52]. The transcriptional profile of Irf5-/- microglia reveals alterations in lipid metabolism, which could explain the differing responses to demyelination in animals lacking this transcription factor. In fact, genes involved in lipid endocytosis (Ldlr), lipids egress from lysosomes (Npc1), cholesterol efflux (Hdlbp), and the transcriptional regulation of lipid homeostasis (Srebf1 and Srebf2) were downregulated in Irf5-/- microglia (Fig. 4D). These latter genes play a role in generating sterols, which serve as ligands for liver X receptors (LXRs), promoting regenerative actions [53]. Notably, the expression of the gene encoding for retinoid X receptor beta (Rxrb), which dimerizes with LXRs and peroxisome proliferator-activated receptors (PPARs), was also downregulated in Irf5-/- microglia (Fig. 4D). All these genes are critical modulators of lipid and cholesterol metabolism, and deficiencies in some of them are associated with lipid related pathologies [54]. This suggests that lipid homeostasis could be impaired in Irf5-/- microglia.
To gain deeper insight into lipid metabolism in Irf5-/- microglia following demyelination, we conducted MALDI-MS imaging alongside immunohistochemistry on the same LPC- induced demyelinated spinal cords. After MALDI imaging, the tissues were immunolabeled with antibodies against myelin basic protein (MBP) and ionized calcium-binding adapter molecule 1 (Iba1) to delineate the lesions and define regions of interest (ROI), including normal white matter, lesion periphery, and lesion core. MALDI segmentation identified three main regions: normal white matter, lesion core, and lesion periphery. The lesion periphery, which is more enriched with microglia/macrophages, could help us delineate specific changes in these cell populations. We then analyzed the MALDI spectra and associated lipid signatures corresponding to these regions (Fig. S4A). When comparing the lipid profiles of healthy white matter and lesion core, we found a significant decrease in ceramides, sulfatides, plasmalogens, and phosphatidylserines (Fig. S4B)—characteristic lipids of myelin [37]—in the lesion cores of both WT and Irf5-/- lesions. Since myelin is rich in these lipids [55], this reduction likely indicates demyelination. Additionally, we observed differences in the accumulation of phosphatidylcholines and phosphatidylethanolamines (data not shown), which are major components of cellular membranes. This increase in phosphatidylcholines and phosphatidylethanolamines could correlate with inflammatory processes [56].
The primary lipid changes observed at the periphery of LPC-induced lesions showed intermediate values between healthy white matter and completely demyelinated white matter in the lesion core (Fig. S4C), likely reflecting the ongoing demyelination process. Although we did not find significant differences in lipid profiles between WT and Irf5-/- mice in normal white matter or in the lesion core, there was a trend toward lower levels of sulfatides and higher levels of phosphatidylcholines in the lesion periphery in Irf5-/-mice (Fig. S4D). This may suggest distinct responses to demyelination between the genotypes. However, it is unclear whether these changes are related to demyelination itself or to the way microglia and macrophages metabolize myelin.
To more accurately analyse the impact of IRF5 in myelin metabolism in microglia, we challenged both WT and Irf5-/- cultured microglia with an excess of myelin (25 µg/mL) for 48 hours, and then intracellular lipids were isolated and measured by HPLC-MS. We observed clear differences in how myelin was processed between the two groups (Fig. 7A, B). Specifically, in IRF5-deficient microglia, there were significant reductions in the concentrations of various phospholipid families, including plasmalogens and phosphatidylinositols (Fig. 7B). Additionally, we observed a significant increase in the levels of all cholesterol ester (CE) species in these cells (Fig. 7B), while total free cholesterol levels showed no difference between the groups (data not shown). Lipid ontology (LION) enrichment analysis suggested an upregulation of lipid storage in droplets, likely related to the detected increase in CE levels (Fig. 7C). The LION
Comments (0)