
Remember me

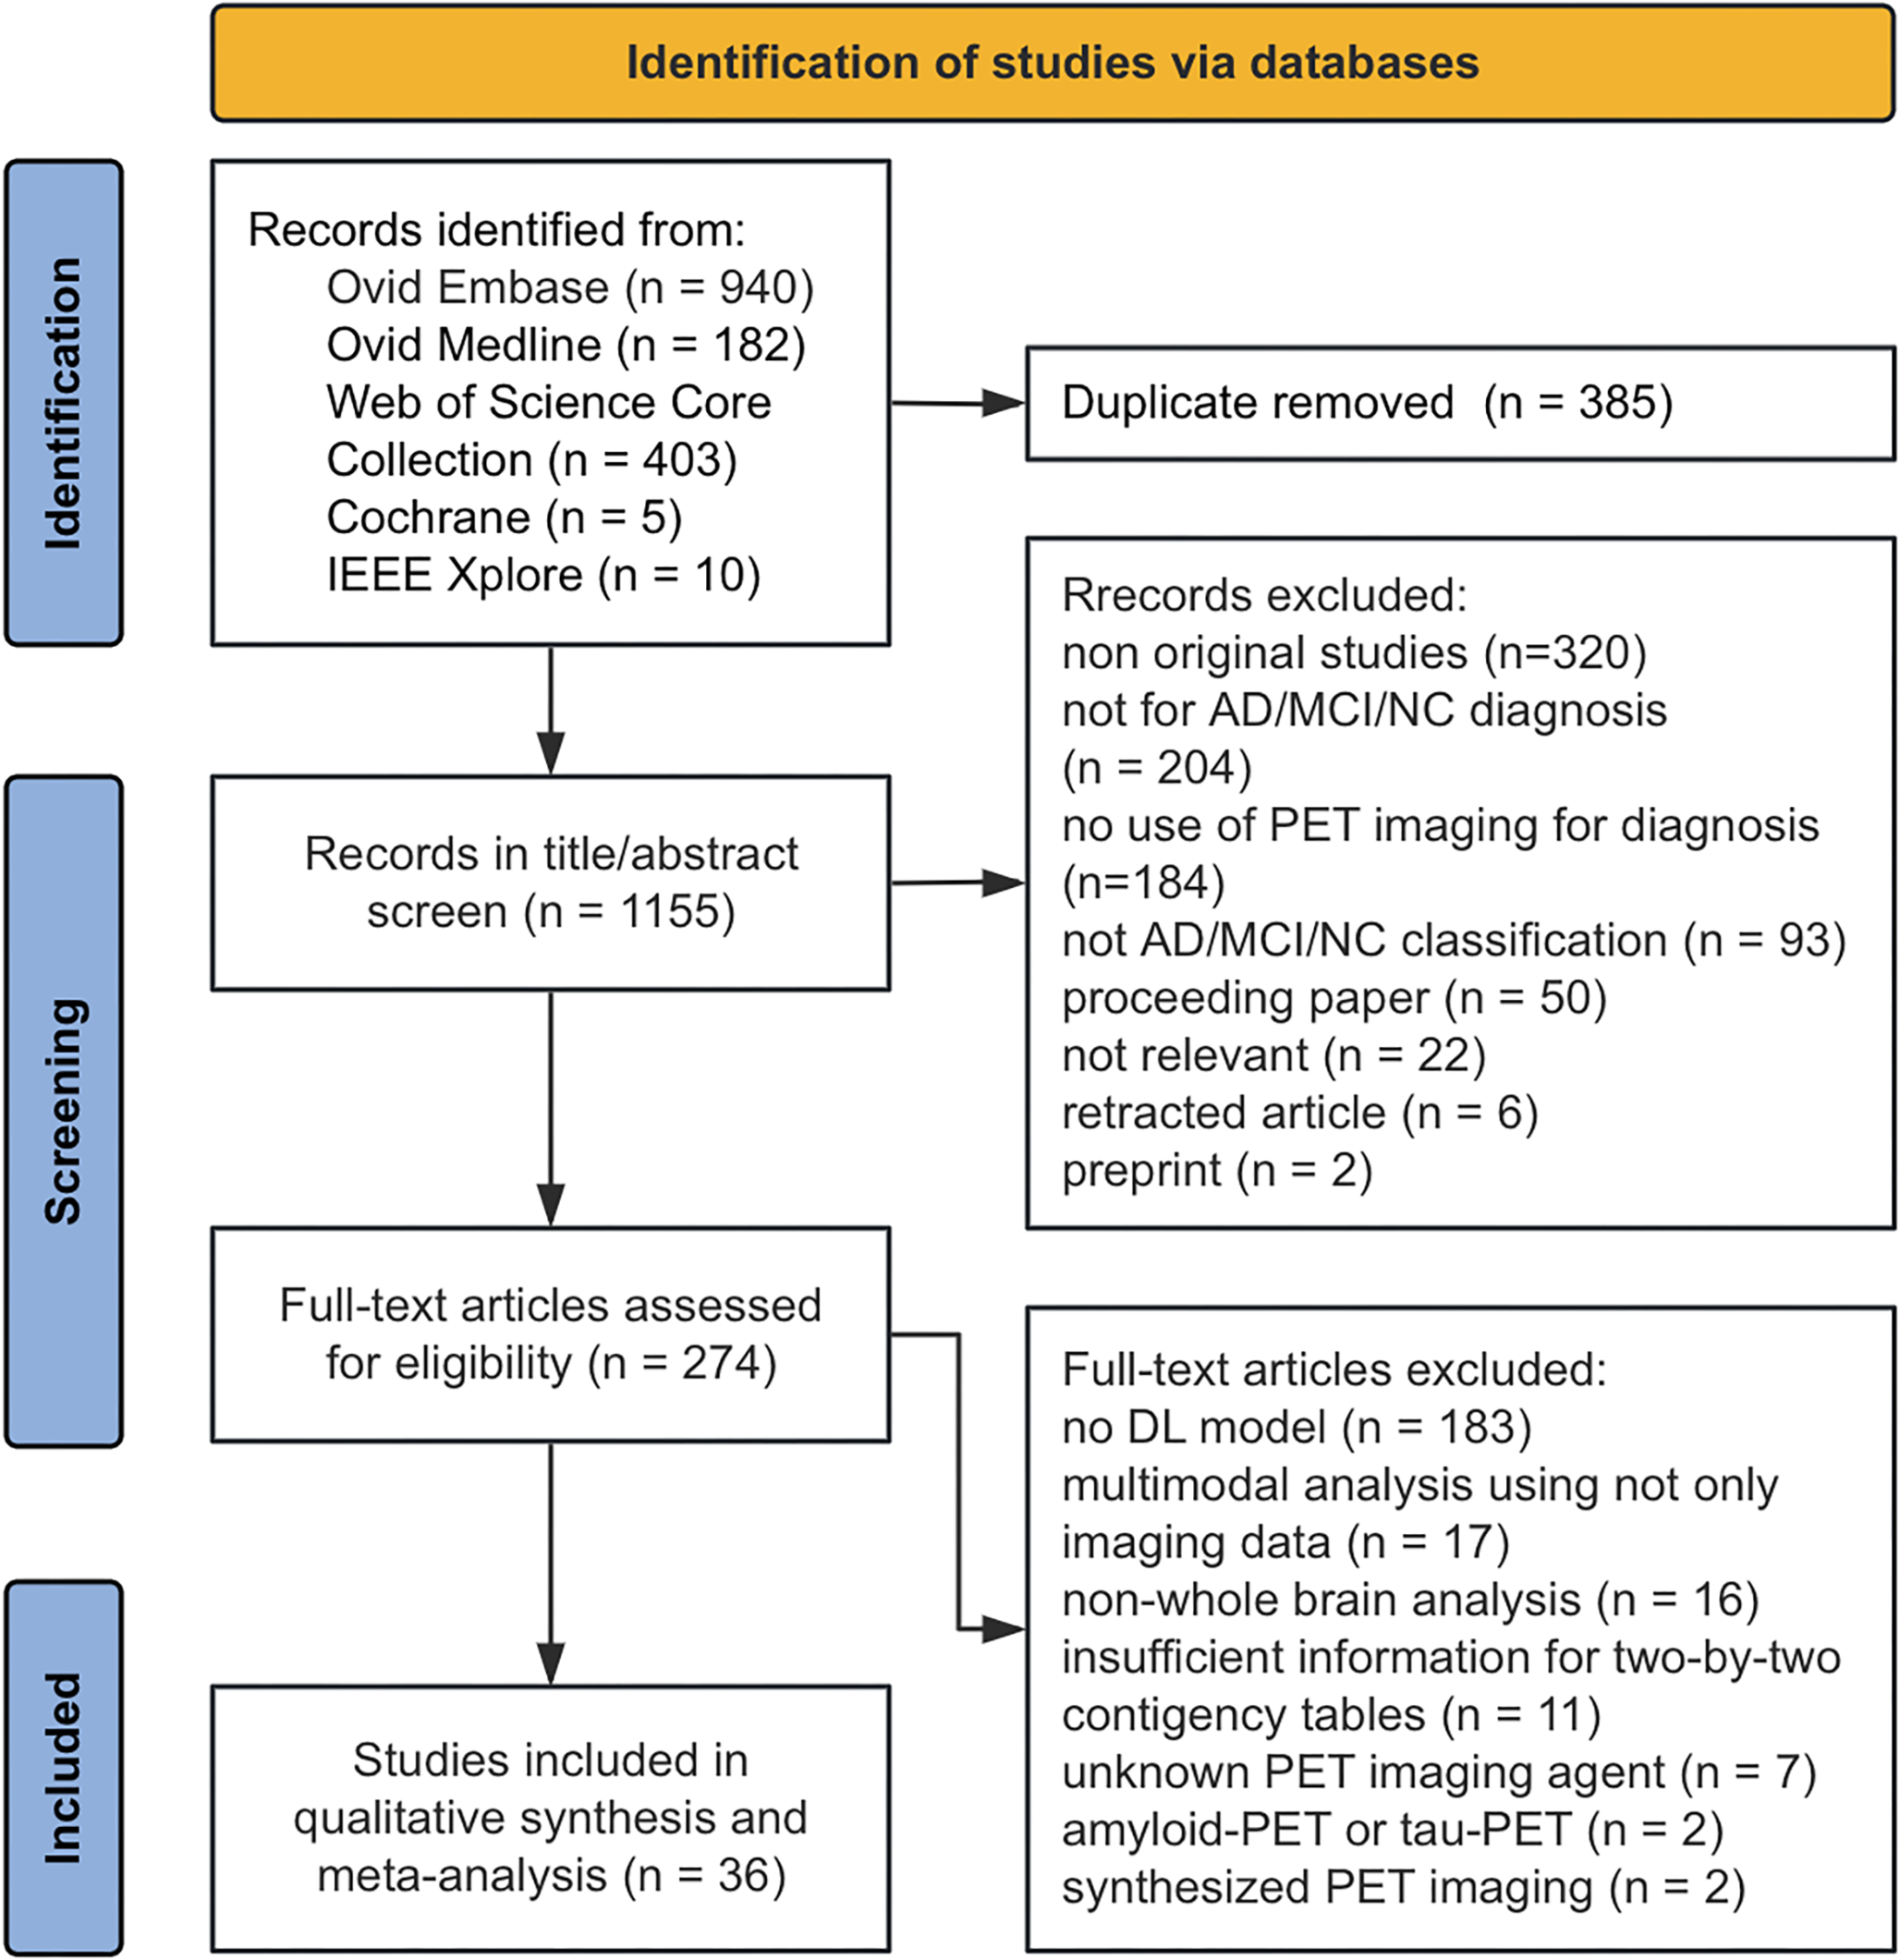


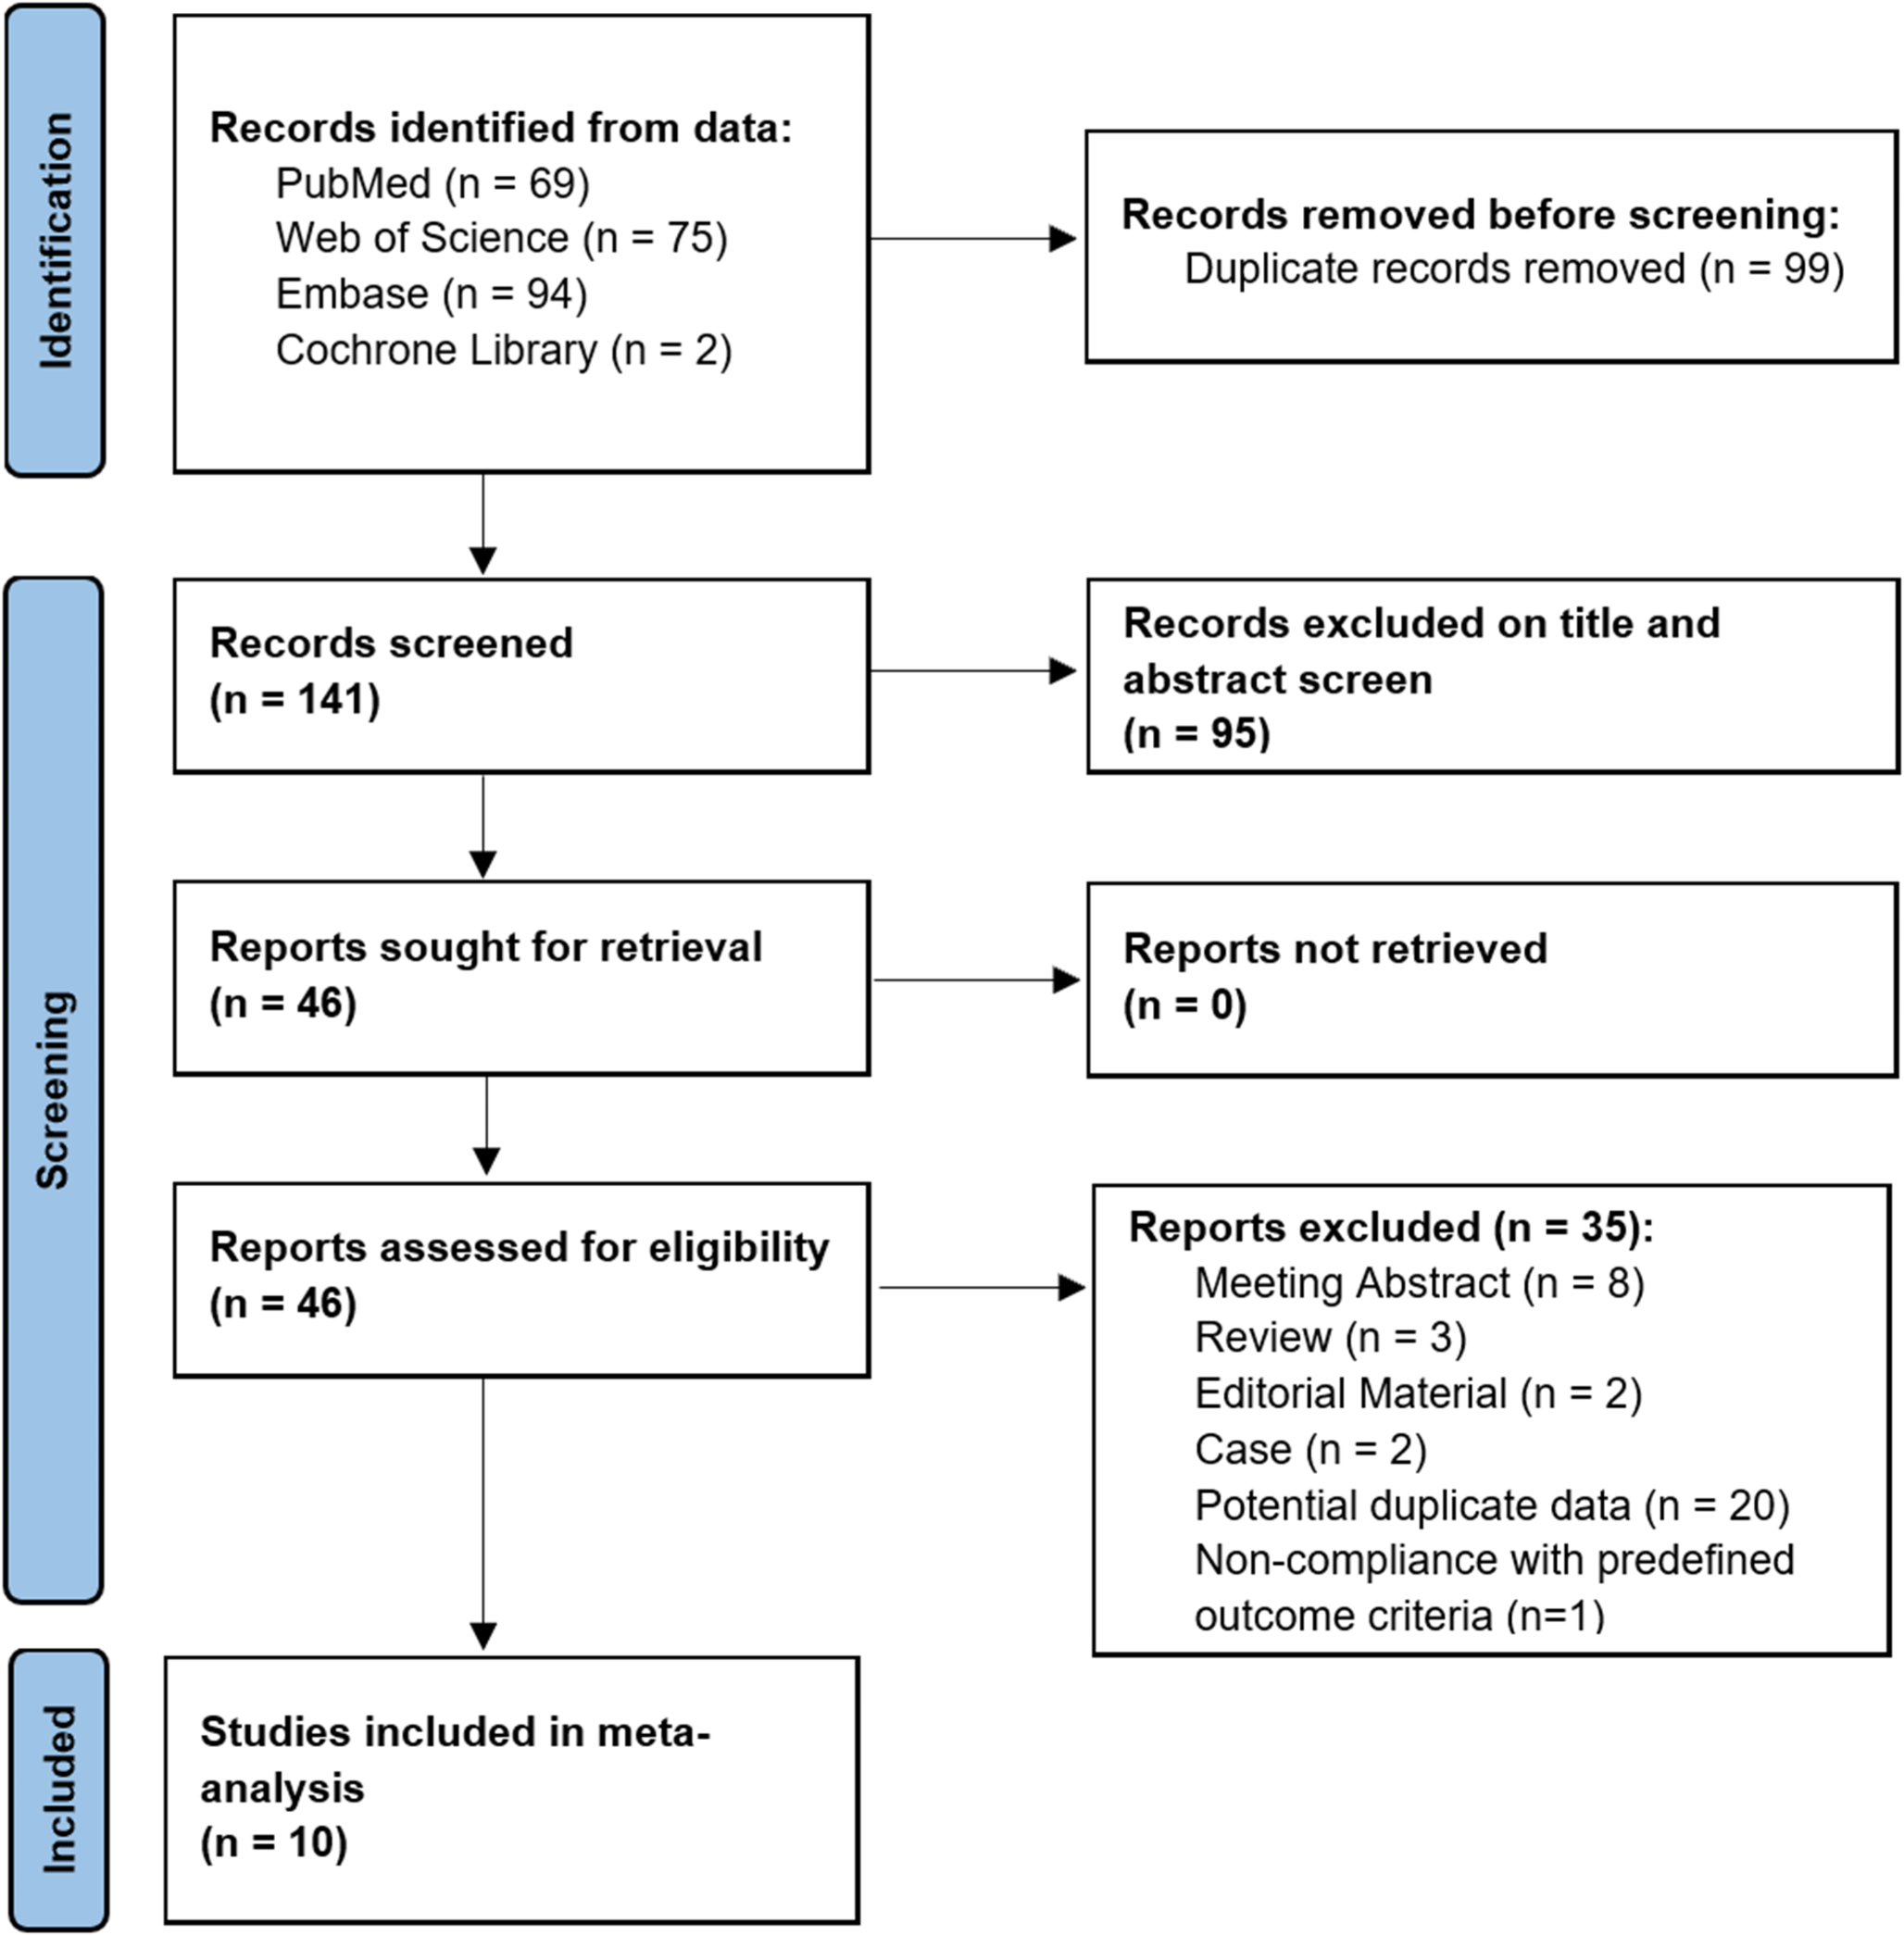
This study included a total of 647 cases (409 males and 238 females) from five centres (Fig. 2 shows the details of dataset construction, Table 1 shows relevant statistical information of each group). The internal dataset consisted of 426 cases, randomly divided into three independent subsets: training set (n = 267), validation set (n = 70), and internal test set (n = 69). The external dataset I contained 151 cases (16 from Lu'an, 10 from Jiangsu, 62 from Pulmonary Hospital, 63 from Proton Centre), while the external dataset II contained 70 cases using uEXPLORER of Ruijin Hospital, which were both used exclusively for external test.
Fig. 2
Flowchart of construction of internal and external datasets
Table 1 Characteristics of internal and external datasetsSegmentation EfficiencyThe effectiveness of our segmentation model was assessed from two perspectives: segmented-voxel-based and lesion-count-based, across all the internal and external test sets (Table 2).
Table 2 Evaluation of the effectiveness of the segmentation modelIn the volumetric context of performance assessment, the DSC, ranging from 0 to 1, was used as a metric, with higher values indicating superior segmentation accuracy. The volumes of FP and FN were measured in cubic centimetres with no upper limit, with lower values indicating better performance. On the internal test set, the model achieved a DSC of 0.6587 (95% CI: 0.6092 ~ 0.7041), with a FP volume of 1.0022 (95% CI: 0.4731 ~ 1.6365) and a FN volume of 1.3789 (95% CI: 0.6758 ~ 2.1493). On the external test I, the DSC reached 0.6503 (95% CI: 0.6053 ~ 0.6929), accompanied by an FP volume of approximately 1.1722 (95% CI: 0.6244 ~ 1.8070) and an FN volume of 0.6711 (95% CI: 0.4348 ~ 0.9391), whereas these values were 0.5595 (95% CI: 0.4941 ~ 0.6264), 1.9457 (95% CI: 0.7033 ~ 3.5396) and 0.6431 (95% CI: 0.3292 ~ 1.0470) respectively for the external test II.
In order to more comprehensively assess the model's ability to detect and label suspicious lesions, it was necessary to employ lesion count-based evaluation metrics. We also defined a lesion with a ratio of overlapping volume to the ROI volume segmented by the model exceeding 0.3 as a "well-detected lesion" to combine volume and count metrics. On the internal test set, the model demonstrated an accuracy of 81.19% (164/202) in lesion detection and a 79.21% (160/202) rate of good detection, with 38 false positives resulting from over-segmentation, representing 18.81% (38/202) of the total segmented results. The average number of false positives per case was 0.5507 (38/69). On the external test set I, the model demonstrated an 75.48% (274/363) accuracy in lesion detection and an 74.10% (269/363) good detection rate, generating only 89 false positives (24.45%, 89/364), which equates to approximately 0.5894 (89/151) FP per case. Similarly, on the external test set II, the model reached 77.59% (135/174) in detection and 77.01% (134/174) in good detection, generating a total of 39 FP which means 0.5571 (39/70) per case.
The model shows reasonable ability to detect and segment suspicious lesions. However, due to the limitations of PET imaging, including resolution and partial volume effects, as well as the small size of some lesions, minor discrepancies in segmentation can significantly influence voxel-related outcomes, leading to suboptimal DSC performance. Nevertheless, the model continues to offer some value in lesion detection and initial segmentation, providing insights for physicians.
Classification EfficiencyThe four-class lesion-level classification model was subjected to a comprehensive evaluation on internal and external test sets, and compare to a SVM model based on radiomics features.
The model demonstrated a relatively satisfactory performance on the internal test set, attaining a micro-average AUC of 88.4% and an accuracy of 67.7%, with a 55.8% F1 score, a 57.7% precision and a 56.6% recall, which are better than radiomics model in each aspect (the statistical results and ROCs are illustrated in Fig. 3a, b, c).
Fig. 3
Classification efficiency. The bar charts, ROC curves, and radar charts, arranged horizontally, illustrate the model’s classification performance on: a-c internal test set; d-f external test set I; g-i external test set II
Upon application to the external test set I, the model continued to demonstrate fine generalisation capabilities, despite the increased data variability and challenges. In particular, the model achieved a micro-average AUC of 80.7% and an accuracy of 56.9%, with a level of 40.5% F1 score, 44.0% precision and 42.7% recall, which are also evidently better than those of radiomics model (Fig. 3d, e, f). While on external test set II, the accuracy, F1 score, precision and recall were relatively lower and reached 41.5%, 36.5%, 44.1% and 38.3% (Fig. 3g, h, i), which is possibly due to the differences of the device and protocol of the external dataset II.
The four-class classification model based on DL has given good results on the test sets (Fig. 4 illustrates the segmentation and classification results of the model on one representative example from each group), showing generalisation capabilities in processing complex and diverse medical image data of lung lesions to some extent, and better performance compared to custom-used radiomics features in complex multi-classification.
Fig. 4
Representative cases of each group. The figures demonstrate the segmentation and classification results of the model on one representative case from each group: a-c benign; d-f lung cancer; g-i lymphoma; j-l metastasis. Each case consists of a screenshot of the lesion on the original image (a, d, g, j), the ROI segmented by the segmentation model on the pre-processed image (b, e, h, k), and the classification model's prediction of the probability of each group based on the segmentation results (c, f, i, l)
Judgement of the false-positive fociIn order to assess the practical applicability of the model suite and identify potential issues, we conducted a manual interpretation of false positives and a comparison with the model’s results.
With regard to the composition of FP segmentations (see Fig. 5a, b, c), the majority originated from the over-delineation of hypermetabolic hilar, mediastinal or axillary lymph nodes (55.26% on the internal test set, 46.07% and 38.46% on the external test set I and II). The remaining was attributed to the hypermetabolic lesions in bones of chest wall such as sternum, ribs and vertebrae (internal 7.89%, external I 20.22%, II 12.82%), the inclusion of lesion subsets excluded in the semiautomatic step (internal 5.26%, external I 10.11%, II 12.82%), some hot pixels in functional images without enough clear evidence in anatomical images (internal 5.26%, external I 5.62%, II 10.26%), adjacent hepatic (internal 5.26%, external I 3.37%, II 12.82%), splenic (external II 5.13%) and gastric (internal 2.63%, external II 2.56%) lesions near the base of lungs, and physiological or inflammatory FDG uptake in myocardium (internal 5.26%, external I 7.87%, II 2.56%), aortic walls (internal 2.63%, external I 3.37%), stomach and liver (internal 10.53%, external I 1.12%, II 2.56%).
Fig. 5
The results of FP assessments. The pie charts illustrate the manual interpretation of FP segmentations generated by the model and their proportions on the: (a) internal test set, (b) external test set I, and (c) external test set II. The bar chart depicts (d) the classification efficiency for FP of interest across different test sets
Our analysis of FP ROIs, in particular those pertaining to hilar and mediastinal lymph nodes, lends support that PET-based segmentation may be more susceptible to the introduction of FP contours of adjacent organs. It is hypothesised that this may be due to the model learning the characteristics of a large number of lymphoma lesions simultaneously. However, it is noteworthy that the majority of these segmentations pertaining to adjacent areas were suspicious lesions and required consideration by physicians during image review and diagnosis, therefore we later categorized them into “FPs of interest” (internal 81.58%, external I 87.64%, II 94.87%), while the other segmentations pertaining to physiological or gastric inflammatory FDG-uptake were categorized into “FPs out of interest”. It’s somewhat appropriate to accept these FP segmentations, given that they were classified as such solely because they fell outside the primary scope of this study which focused on pulmonary lesions. Moreover, some FPs out of interest could be reduced through the application of post-processing techniques in real-world scenarios.
A comparison was made between the classification model's interpretations of FPs of interest and human assessments (see Fig. 5d) and found that approximately 67.7% of the model’s classification were in alignment with manual judgments on the internal test set, while the concordance rate was 42.3% and 54.1% on the external test set I and II. This outcome is roughly comparable to the classification model's accuracy for accurately segmented lesions, indicating that the impact of processed false positives on classification outcomes is clinically acceptable to certain extent and may be useful in helping to diagnose some relevant lesions, especially lymph nodes.
Comments (0)