Cell culture and treatment
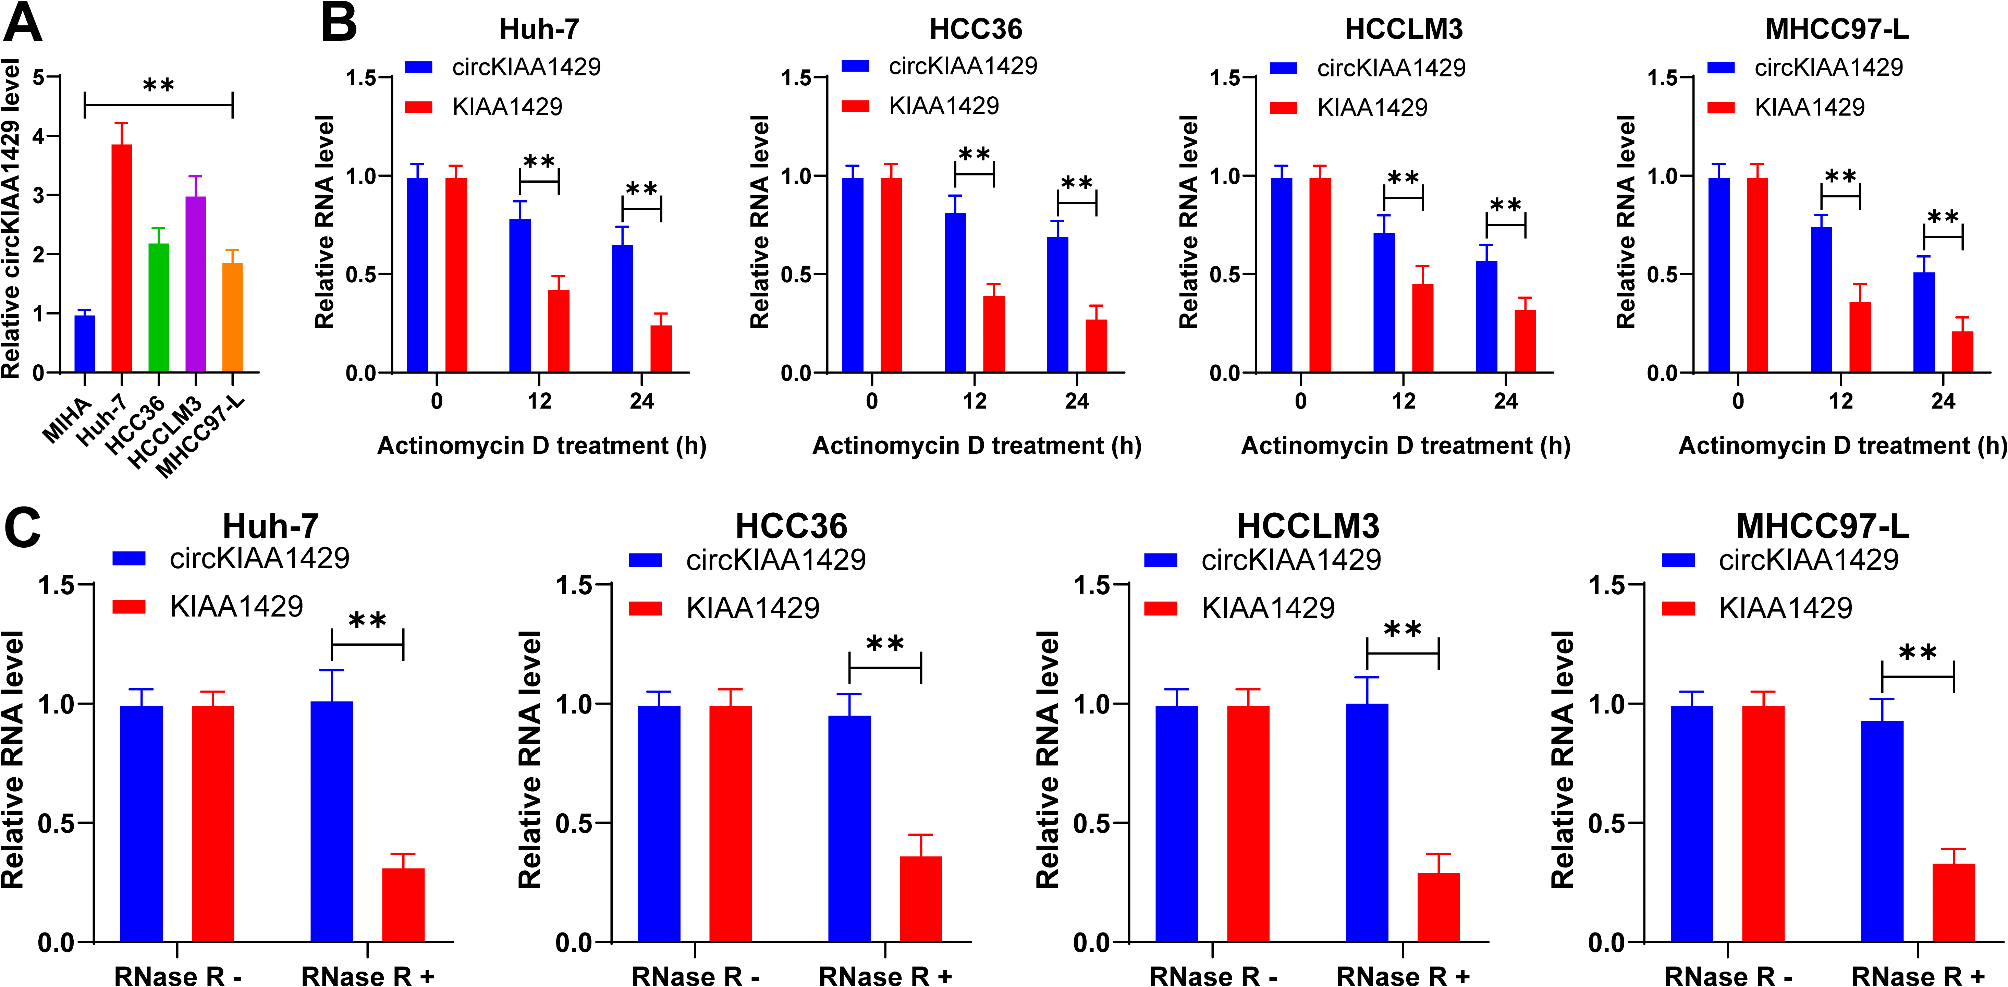
Human immortalized liver cell line (MIHA) and human HCC cell lines (Huh-7, HCC36, HCCLM3, MHCC97-L) were purchased from ATCC and maintained in Roswell Park Memorial Institute (RPMI)-1640 medium containing 10% heat inactivated bovine serum (GIBCO, Carlsbad, CA, USA), 100 U/mL penicillin, and 100 mg/mL streptomycin at 37℃ with 5% CO2.
Cell transfection and construction of cell lines with stable transfection
Small interfering RNA (siRNA) targeting circKIAA1429 or SETD1A or GLIS family zinc finger protein 2 (GLIS2) and negative control were designed and synthesized by GenePharm (Shanghai, China). The pcDNA3.1 vector overexpressing nucleosome assembly protein 1-like 3 (NAP1L3) was manufactured by Santa Cruz Biotechnology (Santa Cruz, CA, USA). The constructed siRNA or plasmid was transfected into Huh-7 and HCCLM3 cells, respectively, using Lipofectamine 2000 reagent (Invitrogen, Carlsbad, CA, USA). After 48 h, the gene intervention efficiency was validated by reverse transcription quantitative polymerase chain reaction (RT-qPCR) or Western blot.
Short hairpin RNA (shRNA) of circKIAA1429 was designed by GeneChem (Shanghai, China) and cloned into lentiviral vector (pAdTrack-CMV, Invitrogen). Huh-7 cells were infected with lentivirus in the presence of Polybrene (Sigma-Aldrich, MO, USA). After 48 h, 2 µ g/mL puromycin was added to the culture medium for screening stable cloned cells.
Cell counting assay
The cell proliferation was measured using CCK-8 assay (Dojindo, Tokyo, Japan). In short, cells (1 × 10³) were seeded into a 96-well plate and cultured in an incubator. At designated time points, 10 uL of CCK-8 solution was added and incubated for 2 h at 37 °C. Then the absorbance at 450 nm was analyzed by a microplate reader (Thomas Scientific, NJ, USA).
Apoptotic assay
The Annexin-V/Propidium Iodide apoptosis assay kit (Multiscience, Hangzhou, China) was used to quantify apoptotic cells. The cells were collected, washed with phosphate buffered saline (PBS), and resuspended in 200 µL of binding buffer containing 5 µL of Annexin-V (10 µg/mL) for 10 min. Then the cells were incubated with 10 µL of propidium iodide (PI) (20 µg/mL) and immediately analyzed by a flow cytometer (Epics XL; Beckman Coulter, Brea, CA, USA). CellQuest software was used for data collection and analysis.
Transwell invasion assay
To evaluate cell invasion ability, cells were seeded onto an 8 μm filter membrane pre-coated with Matrigel (Corning, NY, USA) in serum-free medium. The normal culture medium containing 10% fetal bovine serum was placed into the basolateral chamber. One day later, the filter was removed. The cells located in the basolateral chamber were invaded from the filter membrane. The invaded cells were fixed in 4% PFA, stained with 0.1% crystal violet, and then imaged. The detection procedures of migration ability were the same except for the absence of Matrigel.
Actinomycin D and RNase R treatment
Actinomycin D (2 mg/mL; Sigma-Aldrich) was added to the culture medium to block cell transcription. To evaluate the stability of RNA, total RNA extract (2 µg) was treated with RNase R (3 U/µg; BioVision, CA, USA) at 37 °C for 1 h, and then the levels of circKIAA1429 and linear KIAA1429 mRNA were analyzed by RT-qPCR.
RNA immunoprecipitation (RIP) assay
The binding probability of circKIAA1429 and SETD1A was predicted using the RPISeq database (http://pridb.gdcb.iastate.edu/RPISeq/) [24]. RIP was performed using RNA binding protein immunoprecipitation assay kit (Millipore, Bedford, MA, USA). The cells were lysed with buffer solution (50 mM Tris-HCl, 2.5 mM EDTA, 130 mM NaCl, 1% NP-40) supplemented with RNase and protease inhibitor (Thermo Fisher Scientific, Jiangsu, China). The lysate was incubated overnight with primary antibodies SETD1A (ab70378, Abcam, Cambridge, MA, USA) and IgG (ab172730, Abcam) at 4℃. Then the antibody bound sample was incubated with protein A Sepharose (Sigma-Aldrich) at 4℃ for 2 h. The sample was rinsed with washing buffer and then incubated with proteinase K (Sangon, Shanghai, China) for 1.5 h. RNA was extracted from the eluent using TRIzol reagent (Invitrogen) and then subjected to RT-qPCR.
RNA pull down assay
The cells were homogenized in lysis buffer, and the cell lysate was incubated with biotinylated-circKIAA1429 (generated by MEGAshortscript™ T7 kit; Sigma-Aldrich) at 4℃ for 2 h. The sample was added with streptavid-coupled dynabeads (Invitrogen) and incubated for 3 h at 4℃. The sample was washed with washing buffer and the beads were eluted with Laemmli buffer. Western blot was performed on the eluent.
Chromatin immunoprecipitation (ChIP)
Magna ChIP™ G assay kit was used for ChIP analysis. Simply put, the cells were cross-linked with 1% formaldehyde at room temperature for 10 min, and then the chromatin was sheared by ultrasound. Immunoprecipitation of chromatin-protein complexes was performed using anti-ChIP antibodies SETD1A (ab70378, Abcam), H3K4me3 (ab8580, Abcam), H3K27me3 (ab192985, Abcam), and IgG (ab172730, Abcam). The obtained DNA fragments were used as RT-qPCR templates based on specific primers (Table 1).
Table 1 PCR primer sequencesNude mouse xenograft tumors
All animal experiment schemes were approved by the Animal Ethics Committee of The First People’s Hospital of Tongxiang and implemented based on the Guide for the Care and Use of Laboratory Animals [25]. Twelve 4-week-old nude mice (male, 15–20 g, purchased from Beijing Vital River Laboratory) were randomly assigned to two groups, with six mice in each group. About 107 Huh-7 cells in 200 µL PBS were injected into the right side of nude mice. The tumor volume was measured every 7 days, and the tumor volume was calculated: 0.5 × length × width2. After 4 weeks of injection, mice were euthanized by intraperitoneal injection of 200 mg/kg pentobarbital sodium. Finally, the xenograft tumor tissue was removed for examination.
Immunohistochemistry
The tumor tissue was fixed in 4% formalin, embedded in paraffin, and sliced (4 μm). The tissue sections were baked at 60℃ for 2 h and de-paraffinized with xylene and gradient ethanol. Then, 3% hydrogen peroxide was used to block endogenous peroxidase for 20 min for antigen recovery. The sections were blocked with goat serum to avoid non-specific staining, and then incubated overnight with anti-Ki-67 (ab16667, Abcam), anti-E-cadherin (ab40772, Abcam), and anti-N-cadherin (ab76011, Abcam) at 4℃, followed by incubation with the secondary antibody (Ab205718, Abcam) at room temperature for 2 h. The signal was tested by 2,4-diaminobutyric acid substrate. Immunopositive staining was performed by measuring the proportion of positive cells.
After dewaxing, the sections were incubated with proteinase K working solution, washed with PBS, and then treated with terminal deoxynucleotidyl transferase (TdT)-mediated dUTP nick end labeling (TUNEL) reaction mixture at 37℃ in the dark for 60 min. TUNEL detection was performed on all sections according to the instructions of the In Situ BrdU-Red DNA Fragment (TUNEL) Detection Kit (Abcam).
RT-qPCR
The total RNA was extracted using TRIzol reagent (Invitrogen) and reverse transcribed into complementary DNA (cDNA) using Prime Script RT Master Mix (Takara, Dalian, China). Premix EX Taq (Takara) was used for qPCR. The primer sequences are shown in Table 1. The primers were synthesized by Generay (Shanghai, China). The relative expression of genes was calculated by the 2−ΔΔCt method [26], with glyceraldehyde-3-phosphate dehydrogenase (GAPDH) as the internal reference.
Western blot analysis
The proteins were extracted from cells using cell lysate, separated by electrophoresis (10% sodium dodecyl-sulfate polyacrylamide gel electrophoresis), and transferred onto polyvinylidene fluoride membranes. After blocking in 5% skim milk for 2 h, the membrane was incubated with the primary antibodies GLIS2 (PA5-72849, 1:1000, ThermoFisher), NAP1L3 (H00004675-D01P, 1:1000, ThermoFisher), SETD1A (ab70378, 1:10000, Abcam), and β-actin (ab8227, 1:1000, Abcam) at 4℃ overnight, and then treated with the secondary antibody (ab205718, 1:2000, Abcam) at room temperature for 2 h. The signal was detected by the enhanced chemiluminescence system (Bio-Rad, Hercules, CA, USA). The relative expression of proteins was analyzed using Image Pro Plus 6.0 software (Medical Cybernetics, Los Angeles, CA, USA).
Statistical analysis
Data analysis and map plotting were performed using the SPSS 21.0 (IBM Corp., Armonk, NY, USA) and GraphPad Prism 8.0 (GraphPad Software Inc., San Diego, CA, USA). The data were examined for normal distribution and homogeneity of variance. The t test was adopted for comparisons between two groups, and one-way or two-way analysis of variance (ANOVA) was employed for the comparisons among multiple groups, following Tukey’s multiple comparison test. A value of P < 0.05 indicated a significant difference.


Comments (0)