Bacterial strain identification, culture conditions, and antibiotic susceptibility
Twenty wound isolates of a presumptively identified strains were collected from patients visiting private laboratories in Cairo, Egypt. Subsequently, the isolates were cultured in 4 mL lysogeny broth (LB; HiMedia Laboratories Pvt. Limited, Mumbai, India) in 15 mL Falcon tubes and incubated at 35 °C for 18 h. Tubes showing turbidity were used for streaking the surfaces of mannitol-salt agar plates (HiMedia Laboratories Pvt. Limited, Mumbai, India), then incubated at 35 °C for 18 h. The plates with yellow colonies were then subjected to a series of conventional biochemical tests for the presumptive identification of S. aureus [19]. We used the automated VITEK® (bioMérieux, Marcy l’Etoile, France) to confirm the species-level identity of the strains. The sensitivity of the recovered strains to different antibiotics (oxacillin, cefoxitin vancomycin, linezolid, gentamicin, amoxicillin-clavulanic, fusidic acid, tetracycline, tigecycline, sulphadiazine, and erythromycin) was assessed using the standard Kirby-Bauer disk diffusion method [20].
For the host range analysis, we also included two reference strains (S. aureus ATCC43300 and ATCC25923) and four additional previously characterized S. aureus clinical strains displaying methicillin (SK10 and SK15) and vancomycin (SK12 and SK30) resistance.
All strains were sub-cultured from their respective glycerol stocks using LB and incubated at 37 °C for 18–20 h. Then, they were streaked over LB agar plates (LB supplemented with 1.5% agar) and incubated under the same conditions.
Bacteriophage isolation, propagation, and high-titer preparation
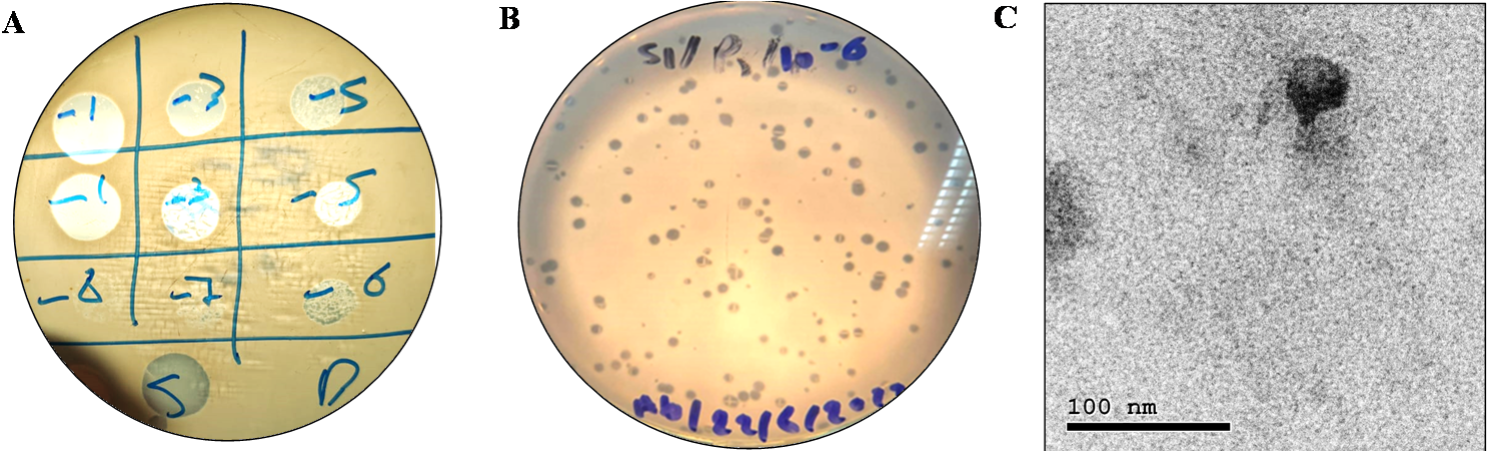
Twenty raw sewage samples (50 mL each) were collected from different collecting systems located in Cairo, Egypt, using sterile Falcon tubes. The collected samples were used to isolate lytic phage(s) targeting the MRSA SK1 strain using the enrichment technique as described previously [21] with minor modifications. Briefly, 20–30 mL of sewage samples were centrifuged (5000 ×g at 10 °C for 5 min), filtered using 0.45 μm PES membrane filter (Sigma-Aldrich, UK), and mixed with an equal volume of 2× LB. The sample was then enriched with 200 µl of S. aureus SK1 grown till exponential phase (optical density of 0.6) and incubated for 18–20 h at 35 °C. Subsequently, the enriched samples were centrifuged, filtered, and screened for lytic activity using spot-on lawn assay and plaque assays [22].
For purification and high titer preparation, the plaques were collected in 900 µl sterile SM buffer [10 mM Tris-HCl, 10 mM MgSO4, and 100 mM NaCl, pH 7.5], and re-plated at least five times till morphologically similar plaques were obtained. Higher titer stocks were prepared by collecting LB overlay from three semi-confluent plates in 10 mL SM buffer, followed by incubation at 4 °C for 2 h, centrifugation and filtration as before. Finally, phage count was done using plaque assay [22].
Transmission electron microscopy
The morphology of the isolated phage was examined using transmission electron microscope (TEM) of the pre-filtered high titer phage stock (~ 1010 PFU/mL). Briefly, 10 µl of the purified phage was dropped on the carbon-coated copper grid and left for 30 s for drying. Subsequently, negative staining of bacteriophage was done by adding 2% potassium phosphotungstic acid and examined by TEM (JEM-2100, HRTEM, JEOL, Japan).
Adsorption and one-step growth curve
The infection kinetic parameters of the isolated phage against MRSA SK1 strain were assessed using adsorption and one-step growth curve assays as described previously [23]. The adsorption assay was performed by mixing the purified phage (with a final concentration of 104 PFU/mL) with the exponentially grown MRSA SK1 strain (diluted in LB broth to obtain a final concentration of 106 CFU/mL) to achieve a multiplicity of infection of 0.01. The mixture was incubated at room temperature, then 100 µl samples were withdrawn at 1 min intervals over 5 min. In addition, two samples were taken at 5 and 10 min timepoints. The collected samples were then 10-fold diluted in cold LB broth, centrifuged at 12,000 ×g for 5 min, then supernatants were utilized for counting un-adsorbed phage particles using plaque assay [22]. The experiment was conducted as independent triplicates.
The one-step growth curve was constructed using a change in phage number over 90 min. Briefly, 10 mL of the exponentially grown MRSA SK1 strain (optical density of 0.6) was diluted to 106 CFU/mL in LB, mixed with the purified phage (final concentration of 104 PFU/mL) and incubated for 10 min to facilitate adsorption. The adsorbed phage particles were then pelleted (16,000 ×g for 10 min) and resuspended in 10 mL fresh LB. Subsequently, 100 µl samples were taken at 5 min intervals for 30 min, followed by 10 min for 60 min. Then, the samples were diluted and centrifuged as before, and the supernatants were utilized for phage count. Burst size is determined as the significant increase in phage count/infected cell, whereas the latent period is the time (min) preceding the onset of this change.
Thermal and pH stability
Thermal and pH stability of the isolated phage were investigated using temperature and pH ranges of 4–70 °C and 4–11, respectively [24]. The thermal stability was assessed by incubating high titer phage stock (1010 PFU/mL suspended in SM buffer at pH 7.5) at the specified temperature for 1 h followed by counting the remaining infective phage particles using plaque assay. The pH stability was assessed by 100-fold dilution of high titer phage (1010 PFU/mL in SM buffer) in the universal Britton Robinson universal buffer (0.04 M H3PO4, 0.04 M H3BO3, 0.04 M CH3COOH, and 0.15 M NaCl) adjusted to the test pH range. After 1 h, the phage count at each pH point was detected using plaque assay. All experiments were conducted in three replicates.
Host range analysis and in vitro antibacterial activity
The host spectrum of the isolated phage was analyzed against a panel of ten S. aureus strains (Table 1) using a spot-on lawn assay [25]. Briefly, exponentially grown test strains were individually used to inoculate 4 mL LB soft agar (LB supplemented with 0.6% agar) and mixed well. Next, the seeded soft agar tubes were poured over LB agar plates and left at room temperature until solidified. Finally, 10 µl phage stocks (final concentration of 104 PFU/mL in SM buffer) were dropped over each bacterial lawn and incubated at 35 °C for 18 h. Strains are assigned as sensitive to phage infection by displaying a lysis zone after incubation. Host range results were further confirmed using efficacy of plating (EOP) as described previously [26]. Briefly, the strains showed sensitivity to the PSK stock were spotted with serial dilutions of PSK (prepared in SM buffer) and incubated at 35 ̊C for plaque counting. Finally, the efficacy of plating was calculated as the phage titer on the test strain was divided by the titer on host bacteria (S. aureus SK1).
Table 1 Overview of theS. aureusstrains used in the current study. This includes the origin of the used strains, their resistance to different antibiotics and sensitivity to the isolated phage (PSK1)The in vitro antibacterial potential of the isolated phage was evaluated against S. aureus SK1 strain grown to exponential phase spectrophotometrically as previously described [24]. Briefly, the host strain was mixed with different concentrations of the purified phages to achieve an MOI range of 10− 4 − 10 and incubated at 35 °C for 24 h. During incubation, 1 mL samples were collected at 2 h intervals to measure optical density using a spectrophotometer (photometer 4010, Boehringer Mannheim, Ingelheim, Germany). Finally, the measured optical densities were plotted against time. Controls were conducted by incubating plain SM buffer with the bacterial host.
Bacteriophage-insensitive mutation frequency
The frequency of phage mutation was assessed by subjecting the host strain, S. aureus SK1 to high phage titer followed by counting viable colonies. For this, overnight cultured host strain was grown to exponential phase (optical density of 0.6) and then diluted to a final density of 106 CFU/mL. Then, 100 µl of the prepared culture was mixed with an equal volume of the purified phage (or SM buffer as control) to achieve a final MOI of 100 followed by incubation for 10 min at room temperature. Subsequently, the mixture was added to 4 mL soft LB agar, overlayed on LB agar plate and left to dry aseptically. Finally, the viable colonies were counted and compared to control plates (SM-treated culture). Mutation frequency was calculated by dividing the number of viable colonies in the treated culture by those treated with SM buffer. A parallel experiment was conducted by subjecting the prepared host strain to the phage mixed with 0.25× MIC of vancomycin, fusidic acid or oxacillin individually.
In vitro antibacterial assay, MIC assay and synergy analysis.
MIC analysis of the phage (PSK), oxacillin, vancomycin and fusidic acid was performed using the conventional microdilution broth assay [27]. Briefly, PSK (0.001–10 PFU/mL), oxacillin (2–16 µg/mL), fusidic acid (1–8 µg/mL) and vancomycin (0.25–2 µg/mL) were dispensed into the wells of microtiter plate reader. Subsequently, an exponentially grown S. aureus SK1 was added to achieve a final density of 106 CFU/mL. The plates were then incubated at 35 °C for 18 h and examined for growth. MIC was detected as the minimum antibiotic/phage concentration that showed no growth. The obtained MIC values were then used to analyze the potential synergy between phage and each individual antibiotic using checkerboard assay to cover concentration ranges of 0.001–10 PFU/mL and 0.25–2× MIC values respectively [28]. The in vitro antibacterial activity was assessed by treating host strain (with final density of 107 CFU/mL) with the bacteriophage (PSK; to obtain final MOI of 10) in combination with antibiotic (oxacillin, vancomycin or fusidic acid adjusted at final concentration of 0.25× MIC) for 24 h, followed by 10-fold serial dilutions and plating to count the remaining viable cells. Finally, the antibacterial activity was calculated by dividing Log (CFU/mL) of the treated cells by Log (CFU/mL) from the buffer treated cells.
Bacteriophage genomic extraction and bioinformatic analysis
Bacteriophage genomic extraction from its respective stock (1012 PFU/mL) was conducted using the PureLinkTM Microbiome DNA Purification Kit (Invitrogen, USA), which was then utilized to generate libraries with the Nextera XT DNA Library Preparation (Illumina, USA). The Illumina MiniSeq sequenced the genome using a paired-end method (2 × 150 bp). The raw data was quality controlled using Fastp v 0.12.4 [29], and the resultant data was assembled using Unicylcer version 0.4.8 [30]. Assembly quality control was achieved using QUAST 5.0.2 [31]. Subsequently, the RAST online server [32] was exploited for initial annotation of the phage-related contigs. The RAST-predicted functions were further confirmed using Blastx [33], conserved domain database (CDD) [34], InterPro [35] and HHpred [36] online servers. The putative holin topology was analyzed and represented using DeepTMHMM– Predictions [37] Dpofinder was used to detect potential depolymerases [38]. The phage genome was then visualized using the circular genome (CG) viewer online server [39]. The presence of t-RNA and antibiotic resistance genes was screened using tRNAscan-SE [40] and CARD [41] tools. Phage infection cycle was predicted using PhageAI tool [42],. Viral promoters and rho-dependent terminators were detected using MEME [43] and ARNold [44] tools respectively.
Phage taxonomical classification was conducted according to the new roadmap designed by ICTV [45]. Family delineation was analyzed using proteomic-based VipTree against dsDNA bacteriophages (accessed 10th August 2024) [46]. While genus and species demarcations were predicted using Genomic-based tools, Virus Intergenomic Distance Calculator (VIRIDIC) [47] and Virus Classification and Tree Building Online Resource (VICTOR) [48]. Finally a pairwise global genomic alignment was performed with the top ten BLASTn hits using DIGAlign tool [49].
Murine wound-infection model
Thirty healthy Swiss albino male mice (5–7 weeks old) weighing 20–25 g and procured from Nahda University Beni-Suef Central Animal House, were included in the current study. The animals were housed in well-ventilated cages with temperature optimized at 25 °C using air conditioning and free access to water and antibiotic-free food throughout the experiment. For the experiment, mice were randomly allocated into five experimental groups (n = 6) and anesthetized using chloral hydrate (300 mg/kg). Animals were prepared for incision by trimming their dorsal hair followed by complete hair removal using hair removal cream and disinfection with 70% ethyl alcohol. Subsequently, a 6 mm incision was created using a sterile scissor and infected by subcutaneous injection, at the anterior end of the incision, of S. aureus SK1 (final density of 106 CFU/mL in sterile PBS buffer pH 7.5) grown to exponential phase. The animals were treated, subcutaneously, with either purified phage (108 PFU/mL in PBS buffer; once) or vancomycin (25 mg/kg/day; divided into two doses for two days). The prepared phage stock was dialyzed by using 3.5 K MWCO Slide-A-Lyzer MINI Dialysis Devices (Thermo Fisher Scientific). The treated groups were subdivided into a group that received the treatment on day 0 (2 h post-infection) and a group that received the treatment 2 days post-infection. Parallel controls were conducted by treating animals with sterile PBS. During the experiment, wound closure rates were calculated on days 0, 2, 4, 6, and 8 using the following equation:
$$}\,}\,}\,}\left[ \over }} \right] \times 100$$
Where V0 represents wound size at time zero and Vt is the wound size at time t (days). The wounds were photographed at each time interval using a digital camera.
The bacterial count was calculated from the harvested wound tissues on days 2 and 8. The animals were sacrificed, wound tissues were harvested homogenized with PBS buffer, centrifuged (3000 ×g for 5 min), and then serially diluted and plated over mannitol salt agar plates.
Histopathological analysis of the wound tissues
On day 2 and at the end of the experiment, the mice were euthanized by cervical dislocation. Skin tissue samples were collected from all the mice, fixed in 10% neutral buffered formalin, and processed using the paraffin embedding technique. Tissue sections of 5 μm thickness were prepared and stained with Haematoxylin and Eosin (H&E) at days 2 and 8. Whereas Masson’s Trichrome (MTC) staining was performed to assess collagen deposition at days 8. The samples were examined blindly by a pathologist using a light microscope (BX43, Olympus).
Wound healing parameters were evaluated according to a modified version of the criteria from Bakr et al. (2021) [50]. Briefly, inflammation, granulation tissue formation, and re-epithelialization were assessed blindly in five random microscopic fields per animal (n = 3), and scored on a scale of 0 to 3, where (0) represented no changes, and (1), (2), and (3) indicated mild, moderate, and severe changes, respectively. The percentage area of positive MTC staining was visualized and quantified using CellSens Dimensions software (Olympus) [51].
Ethics statement
All procedures followed the standards set by the Institutional Animal Care and Use Committee (IACUC) of Beni-Suef University. The study adhered to the ARRIVE guidelines and internationally recognized standards for the care and use of laboratory animals, as outlined in the US guidelines (NIH publication #85 − 23, revised 1985). Approval was granted by the Faculty of Pharmacy’s Ethics Committee (Approval no. 022–490).
Statistical analysis
GraphPad Prism software version 6.1 (GraphPad Software Inc., USA) was used for statistical analysis. For analysis of wound size, statistical significance was assessed using two-way ANOVA test and the multiple comparison was done using Tukey’s multiple comparisons test, the data was expressed as mean ± standard error of means (M ± SEM). For the statistical analysis of the histopathological scores of necrosis and inflammatory cells infiltration, the data expressed as the median and interquartile range (p25-p75). Statistics were carried out by Kruskal Wallis test followed by Dunn test. Finally, Student’s t test was used to test the difference in the antibacterial activity of phage- or vancomycin-treated group compared to PBS treated group. p values of < 0.05 were considered statistically significant.


Comments (0)