
Remember me
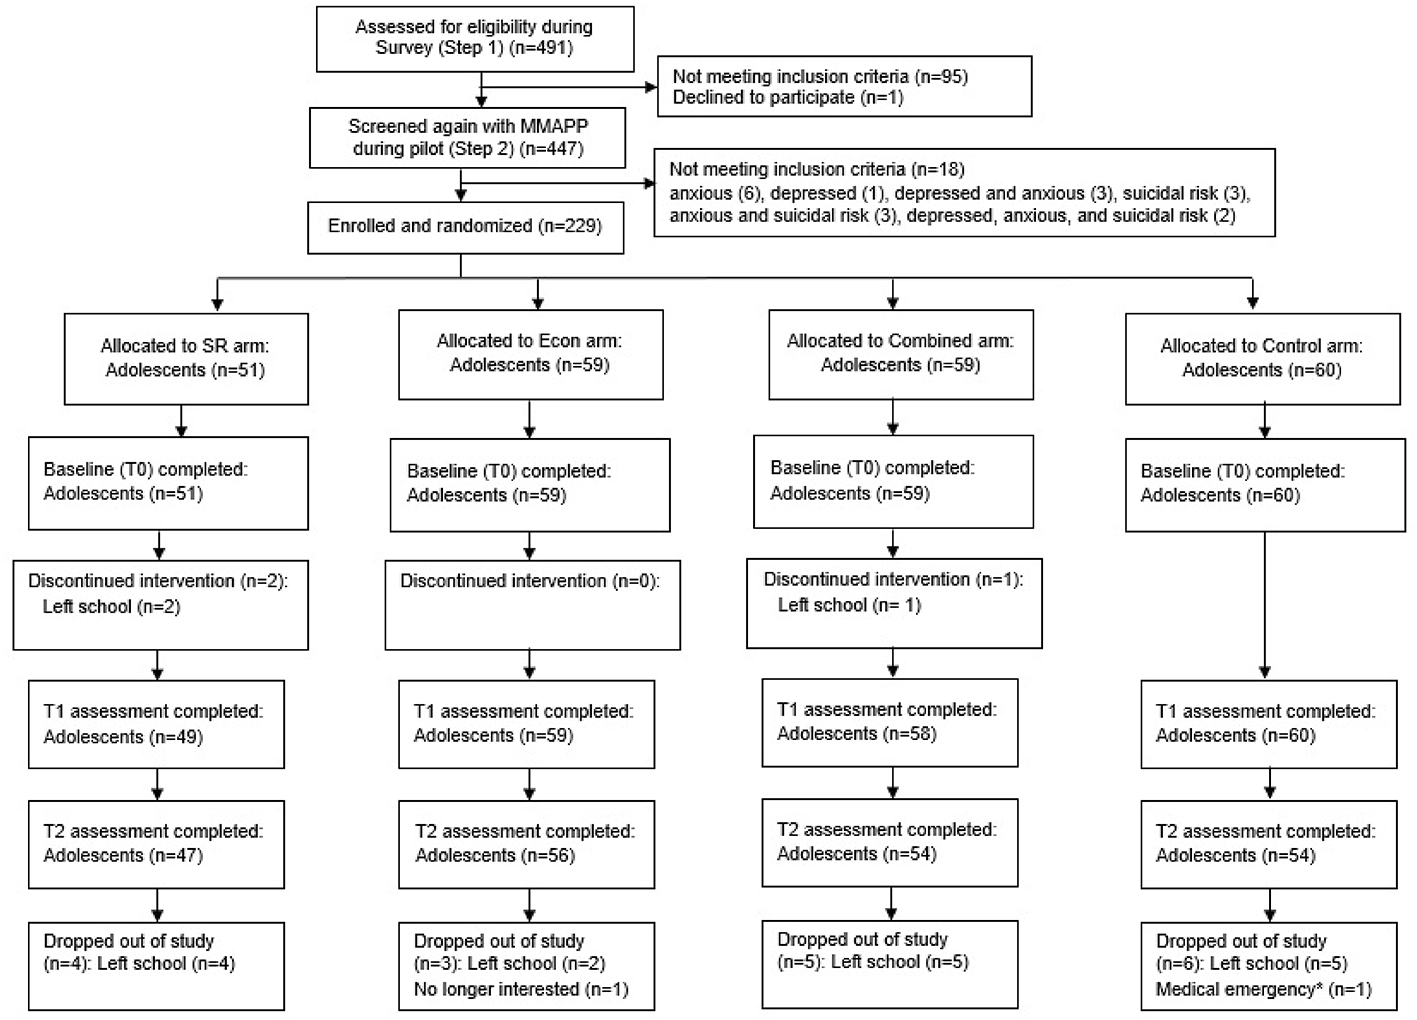
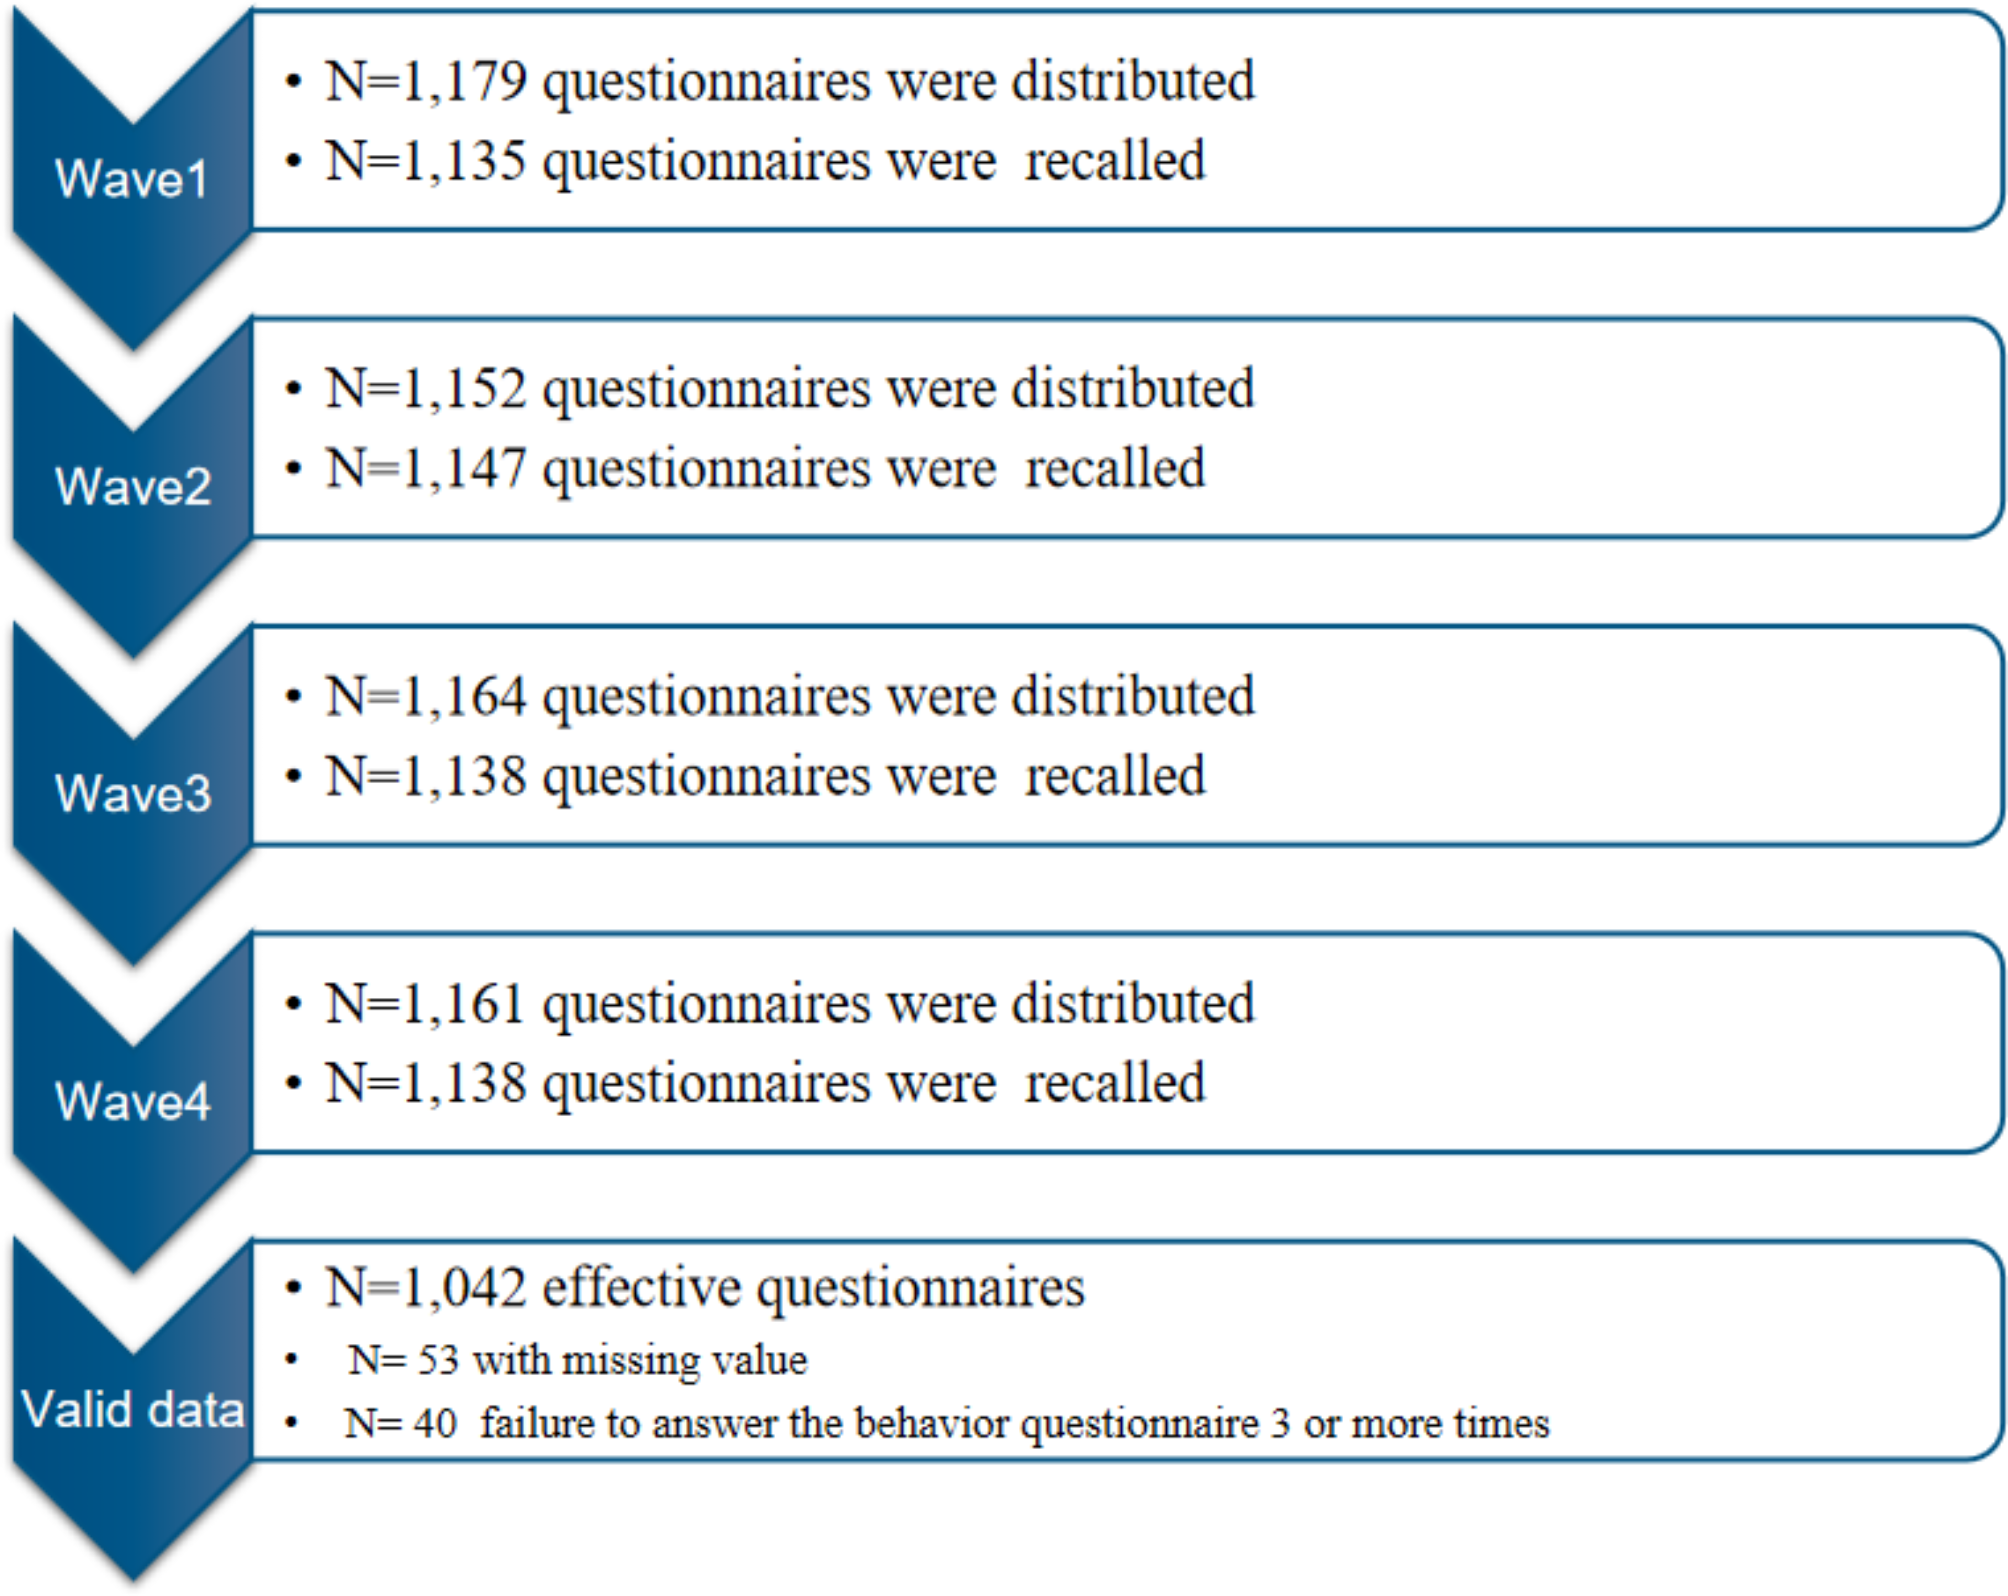


Participants were enrolled in the College Student Behavior and Health Cohort Study, which is an cohort designed to track behaviors, physical and mental health in college students. This research used data from the first four follow-up studies. This cohort was selected from 2 universities in Hefei, Anhui Province and Shangrao, Jiangxi Province in China during April-May 2019, and 1,179 freshmen were selected by cluster random sampling for baseline questionnaire survey. Follow-up surveys were conducted every six months, and by December 2021, a total of three follow-up surveys had been conducted. We needed to fit the trajectories of HRBs, so participants who completed the HRBs questionnaire less than three times were excluded. Finally, 1,042 college students who had both completed the MEQ-5 and behavioral questions over the course of two years. The specific inclusion and exclusion criteria of this study are shown in Fig. 1.
This research was approved by the ethics committee of Anhui Medical University (No.20170291). All participants obtained written informed consent. Figure 1 show the selection criteria for participants.
Fig. 1
The flow chart of participants
Sociodemographic dataSociodemographic data were collected by the questionnaire, including gender, age, self-reported family economic status, self-reported academic performance, parents’ education level and any siblings.
ChronotypeDuring Wave 1, the Morningness-Eveningness Questionnaire-5 (MEQ-5) was used to evaluate the chronotype of college students [22]. The scale consists of 5 items, including wake up time, fatigue time, best time to fall asleep, best state time and self-rated morning/night type, to assess the long-term chronotype of individuals. The total score of the scale ranges from 4 to 25 points. In this research, it was divided into M-type (18 ~ 25 points), N-type (12 ~ 17 points) and E-type (4 ~ 11 points). Cronbach’s α in this study was 0.68.
Sleep durationDuring Wave 1, by asking participants “During the past month, how many hours of actual sleep did you get at night? “. Based on the National Sleep Foundation’s updated sleep duration recommendations [23], students (aged 18 to 25 years) who were sleeping at least 7 h/night, responses were categorized into three groups: short sleep (< 7 h), normal sleep (7–9 h), and long sleep (> 9 h).
Health-risk behaviorsDuring Wave 1 ~ Wave 4, the four kinds of HRBs self-reported by college students were evaluated to understand the cumulative health risks.
SmokingBy asking participants “During the past month, how many days did you smoke cigarettes? “, to judge the smoking status of college students. There are seven options for this question: none, 1–2 days, 3–5 days, 6–9 days, 10–19 days, and almost every day. In this study, the answer “none” means no smoking behavior, and all other options mean smoking behavior.
Alcohol useBy asking participants “During the past month, how many days have you drunk at least 1 glass of wine? “, to judge the alcohol use status of college students. There are five options for this question: none, 1–2 days, 3–5 days, 6–9 days, or more than 10 days. In this study, the answer “none” means no alcohol use, and all other options mean alcohol use.
Low physical activityThe physical activity of college students was assessed according to the short version of the International Physical Activity Questionnaire (IPAQ) [24]. The frequency and duration of physical activity of college students in the past week that were less than 600 MET were classified as low physical activity.
Smartphone addictionThe smartphone addiction of college students was assessed by the Self-rating Questionnaire for Adolescent Problematic Mobile Phone Use (SQAPMPU) [25]. The questionnaire has 13 items, with good reliability and validity, and Cronbach’s α coefficient is 0.87. If the adolescents’ total score was ≥ P75 of the participants, it was determined as smartphone addicts.
Statistical analysisSPSS 23.0 was used for data processing and analysis, and the inspection level was α = 0.05.
First, to identify distinct subgroups of participants with different longitudinal trajectories, Mplus version 7.4 was used for the LCGA. This analysis is capable of identifying homogeneous subgroups in a larger heterogeneous population. By running the LCGA model continuously, the number of classifications was increased by one, and the optimal number of classifications was obtained. The model fitting criteria included adjusting the Bayesian information criterion (ABIC), Akaike information criterion (AIC), Bayesian information criterion (BIC), Lo-Mendell likelihood ratio test (LMR), and bootstrap likelihood ratio test (BLRT). The closer the ABIC and BIC values are to zero, the better fitting effect of the model is. The best model should have the minimum ABIC AIC and BIC, and then the combined judgment is based on relative entropy, classification probability, and classification interpret ability. Generally, relative entropy > 0.7 means that the model is in the acceptable range, and the proportion of each classification group should be > 5% of the total population.
Second, the χ2 test was used to compare the differences between the demographic variables in the trajectories of different HRBs. Ultimately, the multivariate logistics regression model was used to analyze the correlation between the baseline chronotype, sleep duration and the trajectories of HRBs.
Comments (0)