Sample collection
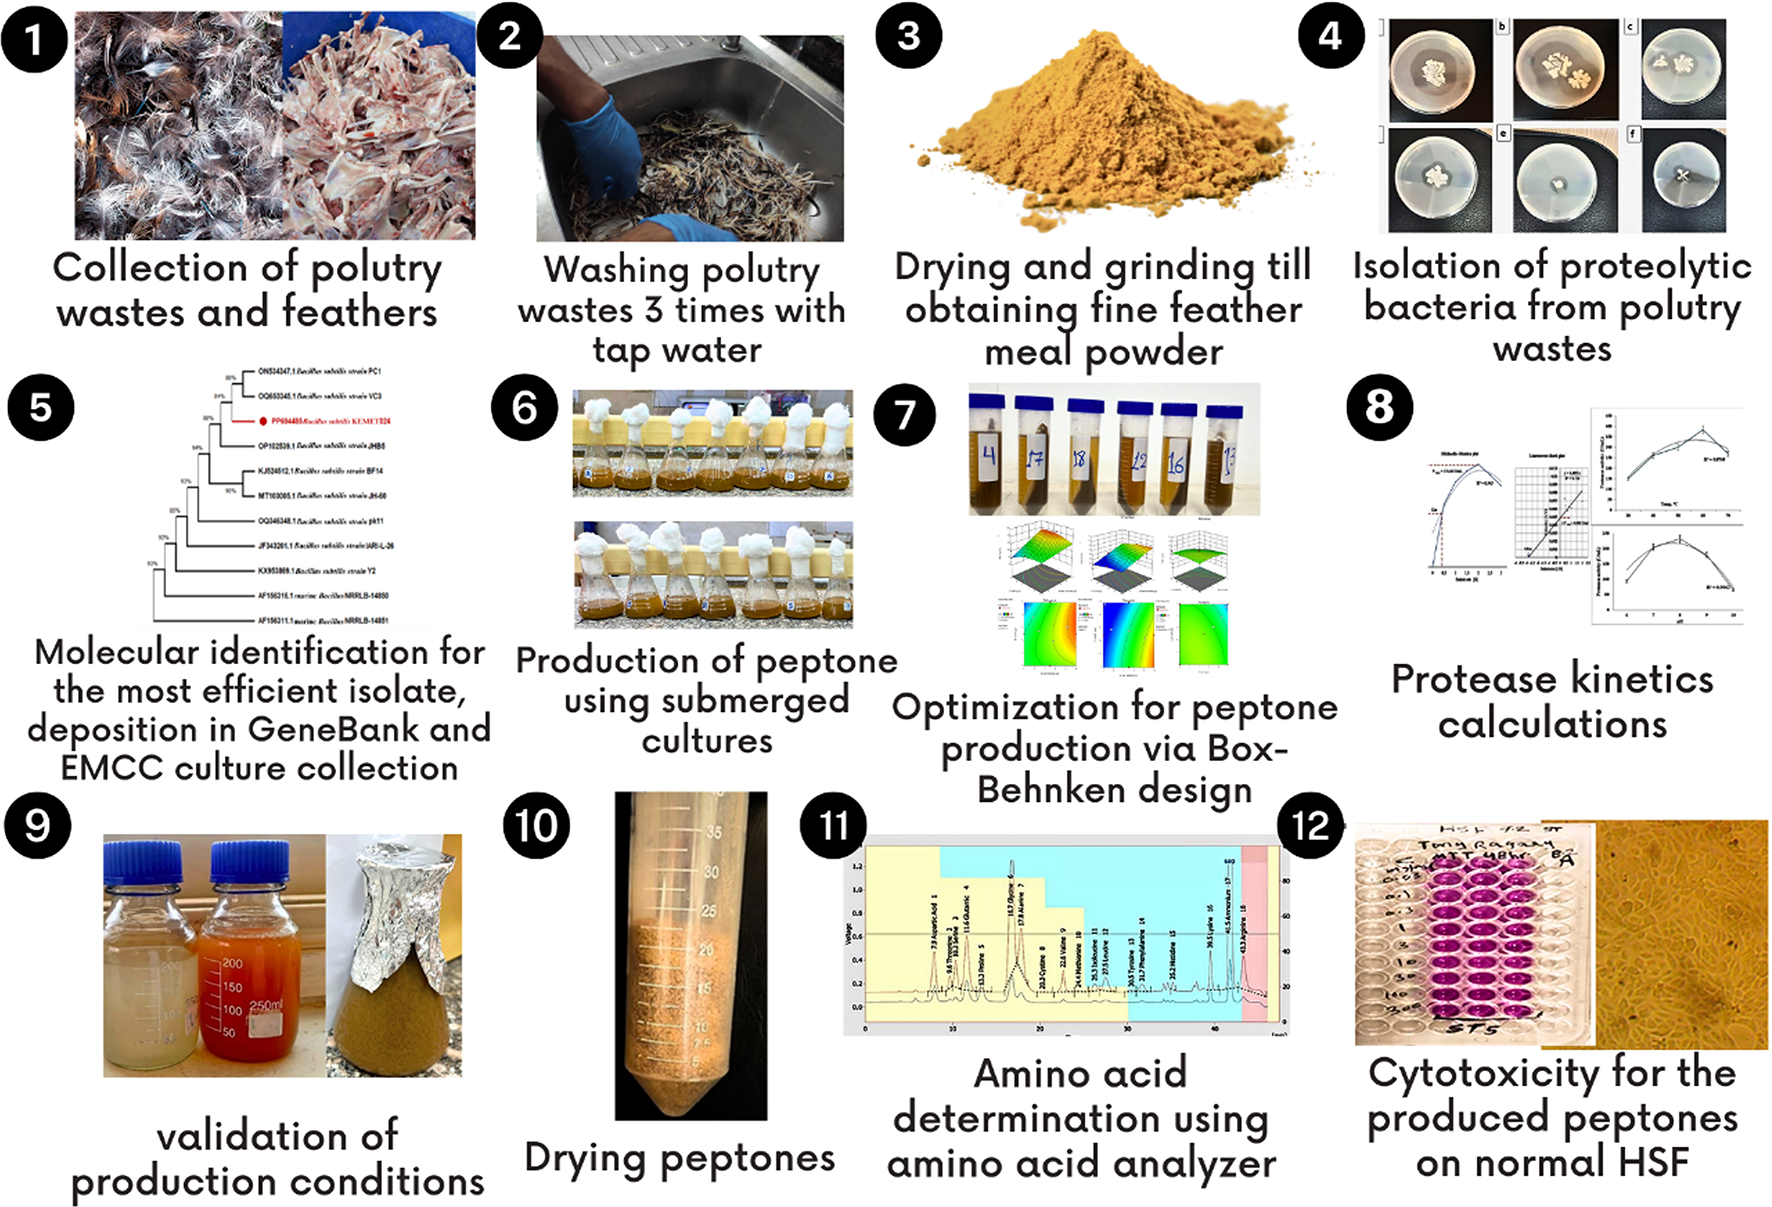
Twenty-five samples of poultry waste (feathers, meat, and bones) were collected in sterile plastic bags from slaughterhouses in Cairo, Egypt. The samples were transported under cooling to the New Programs Administration, Biology lab, Faculty of Agriculture, Ain Shams University, Cairo, Egypt on ice and stored at 4°C for further studies.
Microorganisms and media used
B. subtilis ATCC 6051 (https://www.atcc.org/products/6051) was used as a strain for skim milk hydrolysis. It was obtained from the Microbial Resources Center (MIRCEN) located in Cairo, Egypt. Tryptic Soy Broth (TSB) was used for cultivating all obtained isolates. It has the following composition (Pancreatic digest of casein: 17.0 g/L, Papaic digest of soybean meal: 3.0 g/L, Sodium chloride: 5.0 g/L, Dipotassium phosphate: 2.5 g/L, Glucose: 2.5 g/L) (Joardar and Rahman 2018). Skim Milk Agar, was used for the detection and enumeration of proteolytic bacteria. It has the following composition(Skim milk powder: 28.0 g/L, Tryptone: 5.0 g/L, Glucose: 1.0 g/L, Yeast extract: 2.5 g/L, Agar 15.0 g/L) Skim Milk Agar (DM613). All chemicals were of fine grade.
Isolation of proteolytic bacteria
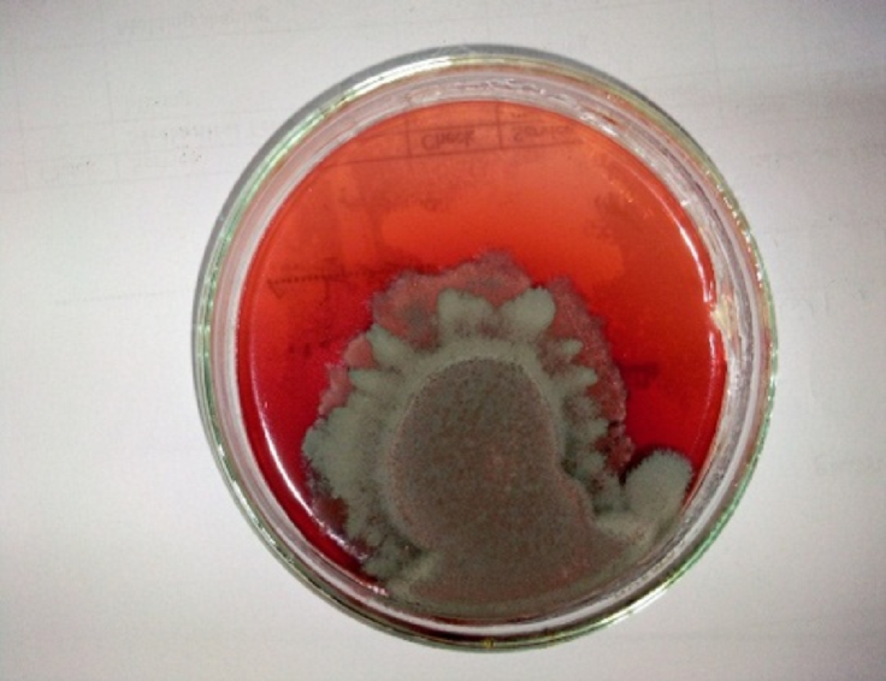
For isolation of proteolytic bacteria, 100 µL of each of all waste samples were spread plated onto skim milk agar plates containing 2% skim milk powder, 0.5% peptone, and 1.5% agar. The inoculated plates were incubated under aerobic conditions at 30℃ for 48 h. After incubation, the skim milk agar plates were inspected for zones of clearance. Hydrolysis zones were measured in cm and the most efficient isolate was selected and transferred onto new skim milk agar plates through streak plating to obtain pure culture isolates (Nassar 2015a). The selected isolate P6 was maintained on nutrient agar slants at 4℃ and subcultured at monthly intervals and for further studies.
Standard inoculum
For standard inoculum preparation, the selected P6 isolate was streaked and grown on TSB at 30℃ for 24h. 50 mL of TSB were inoculated with a single colony of P6 isolate and incubated at 30℃ for 24 h at an agitation speed of 150 rpm yielding a final working inoculum of approximately 1 × 10⁶ CFU/mL (Abu-Hussien and Mohamed 2020).
Phenotypic identification of the selected P6 isolate
The identification of the bacterial isolates was done by examining their phenotypic characteristics. This involved observing the properties of the bacterial colonies on culture media as well as studying the morphological features of the individual bacterial cells under the microscope. To facilitate the examination of cell morphology, the bacterial isolates were subjected to Gram staining and spore staining techniques. ( Pradhan and Tamang 2019).
Molecular identification of the P6 isolate
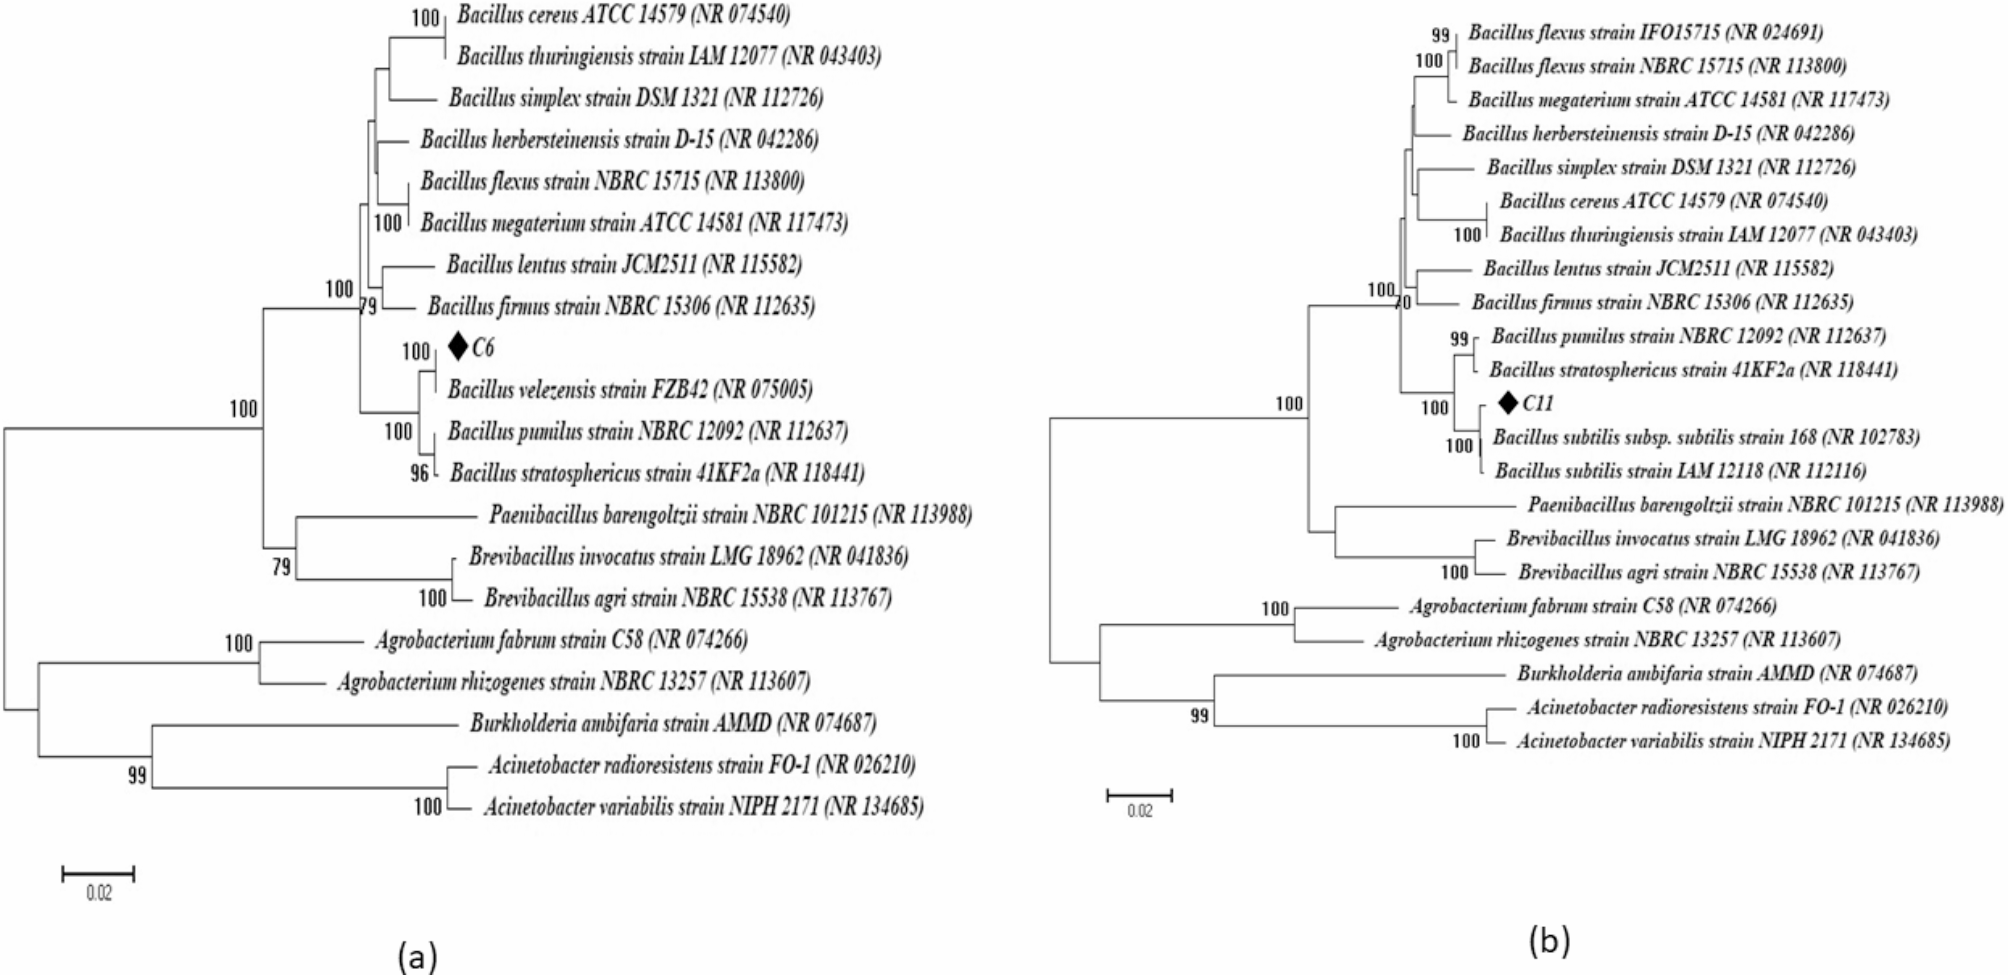
The bacterial DNA was extracted, and a molecular approach utilizing the polymerase chain reaction (PCR) technique was employed for gene sequencing. The 16S rRNA gene sequence was partially amplified using two universal primers of 27F (5′AGAGTTTGATCCTGGCTCAG3′) and 1492R (5′TACG GCTACCTTGTTACGACTT3′). The partially amplified PCR product was purified using a QIA quick gel extraction kit (Qiagen, Germany). The purified PCR product containing the 16S rRNA sequence was sent to Macrogen company (South Korea) for sequencing. The sequence readings were clipped and assembled using BioEdit version 7.0.4. ClusterW version 4.5.1 was utilized to align the resulting genomic information. BLAST inquiries were carried out against the NCBI database to identify the bacterial isolates. Phylogenetic trees were constructed using the neighbor-joining method with the MEGA 11 software. The MEGA software (version 11.0) is available from https://www.megasoftware.net/(Abd-Elhalim 2023b).
Time course of peptone production
The prepared standard inoculum of B. subtilis strain KEMET024 isolate was inoculated into TSB medium at a concentration of 5% v/v (2 × 10^7 CFU/mL) and incubated at 30°C for 48 h with shaking at 150 rpm. At intervals of 6h, 10 mL samples were collected from the cultures. These samples were centrifuged at 10,000 rpm for 15 min. The resulting pellets were used for determining the cell dry weight (CDW), while the supernatants were collected to evaluate Protease activity (U/mL), and total amino acids (mg/mL). All experiments were performed in triplicate (Nassar 2015a).
Optimization for peptone production using the selected B.subtilis strain KEMET024Statistical screening using the Plackett–Burman design
A Plackett–Burman experimental design as shown in Tables (S1, and S2) was carried out to screen 11 nutritional and environmental factors (A: Feather meal, B: Meat and bone meal, C: Starch, D: Casein, E: CaCO3, F: KH2PO4, G: pH, H: Temperature, J: Inoculum size, K: Agitation, and L: Incubation time) for their effects on the peptone production by the selected isolate. (Abu-Hussien and Mohamed 2020; Thiruchelvi 2020). Independent variables were studied at high (+ 1) and low (-1) levels along with center points (0) in a two-level fractional factorial design consisting of 12 runs and 5 additional center points. All trials were carried out in triplicates. Significant factors from the Plackett–Burman design were identified based on the magnitude and direction of their main effect coefficient and corresponding p-values. For peptone extraction and amino acids determination, the fermented medium was centrifuged at 6000 rpm for 15 min at 4ºC to obtain amino acids-rich broth., the supernatant was stored at 4ºC for analysis and the assay was done within 24 h. as described below. For Protease activity and protein content, the protein content was determined by the method of as described later. (Nassar 2015b).
Box-Behnken design for peptone optimization using P6 isolate
A three-factor, three-level Box-Behnken design as shown in Table (S3) was implemented to optimize peptone production by assessing the effects and interactions of meat and bone waste (5, 7.5, and 10 g/L), starch (0, 2.5, and 5 g/L), and CaCO3 (0, 0.25, and 0.5 g/L) through response surface methodology quadratic model fitting (Nassar 2015c). The complete design consisted of 17 experimental runs with the independent variables set at low, middle, and high values. All trials were carried out in triplicates. Statistical analysis of the experimental data enabled the modeling of peptone yield to determine the optimum formulation through the evaluation of the quadratic effects and interactions between the studied nutrient components.
Cytotoxicity of produced peptone against normal human skin fibroblast
Human skin fibroblast (HSF) cells acquired from Nawah Scientific Inc. (https://nawah-scientific.com) were cultivated in Dulbecco's Modified Eagle's Medium (DMEM) supplemented with 10% fetal bovine serum, 100 mg/mL streptomycin and 100 U/mL penicillin at 37°C in a 5% CO2 humidified atmosphere (Abd-Elhalim 2023a). The sulforhodamine B (SRB) assay was utilized to evaluate the cytotoxicity of metabolites obtained from P6 isolate by quantifying HSF cell viability after treatments (Mansour 2023).
Protease activity
The activity of proteases was evaluated using a modified version of (Anson 1938) method. A 1 mL sample of the crude enzyme solution was mixed with 5 ml mL of casein solution and incubated for 10 min at 37°C. After incubation, the reaction was terminated by adding 5 ml mL of 0.11M trichloroacetic acid (TCA) solution. Following 30 min, the mixture was centrifuged at 10,000 rpm for 15 min. Two mL of the supernatant was then combined with 5 mL of 0.5M sodium carbonate and 1 mL of Folin-Ciocalteu's Phenol reagent and allowed to stand for 30 min. at room temperature. All trials were carried out in triplicates. The optical densities of the solutions were measured against a blank at 660 nm. The blank sample consisted of the same components, except that the enzyme solution was substituted with distilled water. The readings were completed within 30 min. The casein solution (0.65% w/v) was prepared by dissolving 6.5 mg/mL of casein in 50 mM potassium phosphate buffer. The solution was gradually heated to 80–85°C for about 10 min, with gentle stirring, to achieve a homogeneous dispersion. The pH was adjusted, if necessary, with NaOH and HCl. A tyrosine standard solution in the range of 0–1000 mg/L was prepared in triplicate to obtain a standard curve. One unit (U) of protease activity was defined as the amount of enzyme that produced 1μg of tyrosine in 10 min. under the specified assay conditions.( Nassar et al. 2015b).
Total amino acids
The crude amino acids were first separated from the bacterial culture by centrifugation at 10,000 rpm under cooled conditions for 15 min. The cell pellets were collected to measure the dry cell weight, while the supernatant containing the extracellular amino acids was used for amino acid identification and analysis. The quantification of the total amino acid content was performed using the ninhydrin method outlined by (Anson 1938). All trials were carried out in triplicates. This colorimetric assay involves mixing 1 mL of the sample with 1 mL of ninhydrin reagent solution, which is prepared by dissolving 2–4% (w/v) ninhydrin powder in a sodium acetate buffer and ethanol. A standard solution of glycine is prepared at various concentrations (e.g., 0.1 to 1.0 mM) to create a calibration curve. After mixing the sample and ninhydrin reagent, the reaction is carried out by heating at 100°C for 30 min. to allow color development, where ninhydrin reacts with amino groups to form a purple-colored complex (Ruhemann's purple). The colored solution is measured at 570 nm and compared to the standard curve to determine the total amino acid concentration in the sample.
Amino acid profile using amino acid analyzer
The analysis of amino acids was performed using a Sykam Amino Acid Analyzer (Sykam GmbH, Germany). The analyzer was equipped with a Solvent Delivery System S 2100 (Quaternary pump with a flow range of 0.01 to 10.00 mL/min and a maximum pressure of up to 400 bar), Autosampler S 5200, Amino Acid Reaction Module S4300 (with a built-in dual filter photometer between 440 and 570 nm, providing constant signal output and signal summary option), and Refrigerated Reagent Organizer S 4130. For standard sample preparation, A stock solution containing 18 amino acids (aspartic acid, threonine, serine, glutamic acid, proline, glycine, alanine, cystine, valine, methionine, isoleucine, leucine, tyrosine, phenylalanine, histidine, lysine, ammonia, and arginine) was prepared. The concentration of all amino acids, except cystine, was 2.5 μMol/mL, while the concentration of cystine was 1.25 μMol/mL. For analysis, 60 μL of the stock solution was diluted in a 1.5 mL vial with a sample dilution buffer. The diluted solution was then filtered using a 0.45 μm syringe filter, and 100 μL of the filtered solution was injected into the analyzer. For sample preparation, 0.531 g of the sample was transferred into a seal and digested with 25 ml of 6 N HCl at 100°C for 24 h. After cooling, the solvent was evaporated using a Rota Vab. The samples were then dissolved in 10 mL of dilution buffer and sonicated for 15 min. The volume was made up to 50 mL in a volumetric flask. Subsequently, 1 mL of this solution was diluted with 20 mL of dilution buffer, filtered using a 0.45 μm PTFE syringe filter, and 100 μL of the filtered solution was injected into the analyzer. The following parameters were set for the amino acid analysis: LCA K06/Na column, mobile phases comprising Buffer A, Buffer B, and Regeneration solution, gradient elution mode, a flow rate of 0.45 mL/min, a temperature gradient from 57°C to 74°C, and detection wavelengths of 440 nm and 570 nm (Abu-Hussien and Mohamed 2020).
Effect of poultry waste substrate concentration on enzyme velocity
To determine the kinetic parameters Vmax and Km, the effect of substrate concentration on protease activity was investigated. The crude enzyme was incubated with varying concentrations of poultry waste (0, 0.5, 1, 1.5, 2, 2.5, 3g/L) in the reaction mixture and assayed under standard conditions at each concentration. Enzyme activity per unit of time was measured at each substrate level. All trials were carried out in triplicates. The data obtained was plotted using both the Michaelis–Menten and Lineweaver–Burk models to calculate the values of Km and Vmax. By assaying enzyme activity across a range of substrate concentrations and graphing the data, the maximum velocity (Vmax) and Michaelis constant (Km) kinetics values for the protease enzyme could be determined.(Mousami Shankar et al. 2018).
Application of produced peptone from B. subtilis strain KEMET024 as the sole source of nitrogen
The ability of the produced peptone to serve as a sole nitrogen source was evaluated by cultivating B.subtilis ATCC 6051 in a minimal medium supplemented with varying concentrations of peptone. The minimal medium was prepared with the following composition (per liter): 6.8 g Na2HPO4, 3.0 g KH2PO4, 0.5 g NaCl, 1.0 g NH4Cl, 0.24 g MgSO4, 0.01 g CaCl2, and 4.0 g glucose. For the nitrogen source evaluation, NH4Cl was omitted from the minimal medium, and the produced peptone was added at concentrations of 0.1%, 0.3%, 0.5%, and 1.0% (w/v). A control culture without any supplemented nitrogen source was also included. Each culture was inoculated with a single colony of B.subtilis from a fresh TSA plate and incubated at 30°C for 24h with shaking at 150 rpm. The growth of the cultures was monitored by measuring the cell dry weight at regular intervals over 24h. The ability of the peptone to support bacterial growth was evaluated by comparing the growth curves of the cultures with different peptone concentrations to the control culture without any supplemented nitrogen source(Gray et al. 2008). All trials were carried out in triplicates.
Statistical analysis
Data were analyzed by one-way ANOVA followed by Tukey's post-hoc test using SPSS 12. P < 0.05 was considered statistically significant. A Tukey test at a P-value of 0.05 was applied.( Keselman and Rogan 1977) All samples and collected data were statistically analyzed using Design Expert 12 Statistics software (https://www.statease.com/software/design-expert).


Comments (0)