Hepatocellular carcinoma (HCC) is a lethal, asymptomatic cancer and the fourth leading cause of cancer-related mortality.[1] A minority of patients with HCC are diagnosed at an early stage and receive curative therapies such as surgical resection, ablation, and liver transplantation. However, most patients with HCC receive palliative therapy due to late presentation.[2,3] Transarterial chemoembolization (TACE) is the most common palliative therapy used in patients with HCC with maintained liver function.[4]
TACE is a widely recommended first-line therapy for intermediate stages of HCC.[5] There are two main techniques used for TACE: Conventional TACE (cTACE) and drug-eluting bead TACE (DEBTACE). While both techniques have similar efficacy, DEBTACE is favored for its reduced toxicity and enhanced tolerability due to the controlled release of chemotherapeutic agents.[5-8] Tumor response to TACE can vary, but achieving a radiological complete response is a strong indicator of positive outcomes and improved patient survival.[9] Early identification of treatment response is crucial for guiding patient management decisions, especially in distinguishing potential responders from non-responders during the TACE procedure.[10,11]
In cTACE, Lipiodol, an oil-based contrast agent, is frequently distributed and retained within the tumor. The distribution of lipiodol retention within the tumor has been positively correlated with complete response and used as a predictive factor.[11-13] In DEBTACE, water-soluble contrast is injected with loaded microspheres, and transient contrast staining of the tumor is frequently observed.[14]
Our study aimed to evaluate the association between complete tumor contrast staining using two-dimensional (2D) fluoroscopy during DEBTACE and complete tumor response.
MATERIAL AND METHODS Study designWe retrospectively collected data from consecutive patients who underwent DEBTACE for HCC between January 2015 and January 2021 at a large University Hospital. The inclusion criteria were as follows: age >18 years, Child–Pugh score of A or B, solitary HCC, and no vascular invasion or extrahepatic metastasis. The exclusion criteria were multiple HCCs, vascular invasion, prior or adjuvant HCC therapy, Child–Pugh score of C, and incomplete data.
DEBTACEFollowing local anesthetic infiltration of the subcutaneous tissue, the common femoral artery was punctured using the Seldinger technique under aseptic conditions and ultrasound guidance, followed by the placement of a 5-French vascular sheath. A 5-French angled catheter and wire were used to select the celiac and mesenteric arteries. Angiography of the celiac trunk and mesenteric arteries was performed to delineate the arteries feeding the HCC. A Renegade Hi-Flo microcatheter and Transend-18 Steerable Guidewire (Boston Scientific) were used for super selection of the feeding arteries as distally as possible. Subsequently, 1 vial of 100–300 µ of drug-eluting microspheres loaded with 75 mg doxorubicin was mixed with 10 mL of Iodixanol contrast medium (320 mL/mL Visipaque) and 5 mL saline. It was slowly pulse-injected into the feeding arteries until almost complete stasis. Large tumors required two vials of drug-eluting beads loaded with 150 mg doxorubicin.
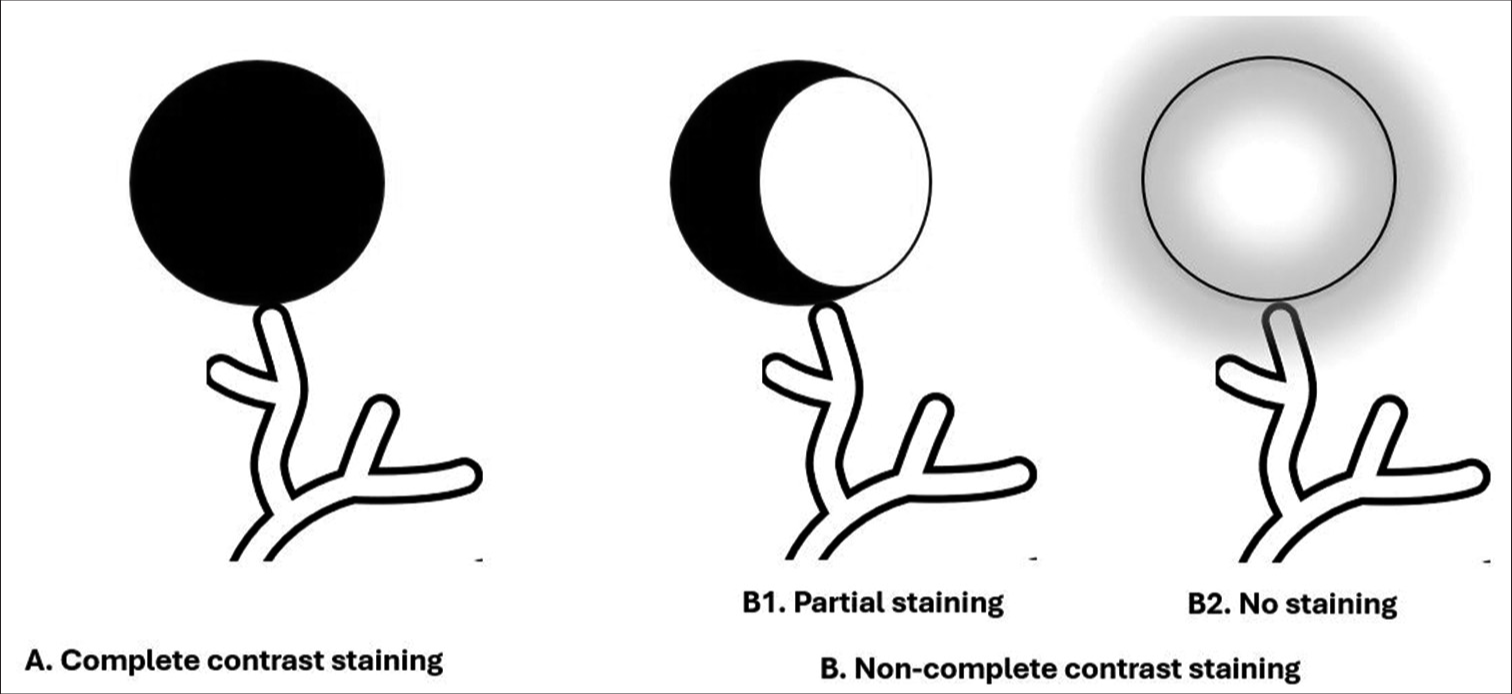
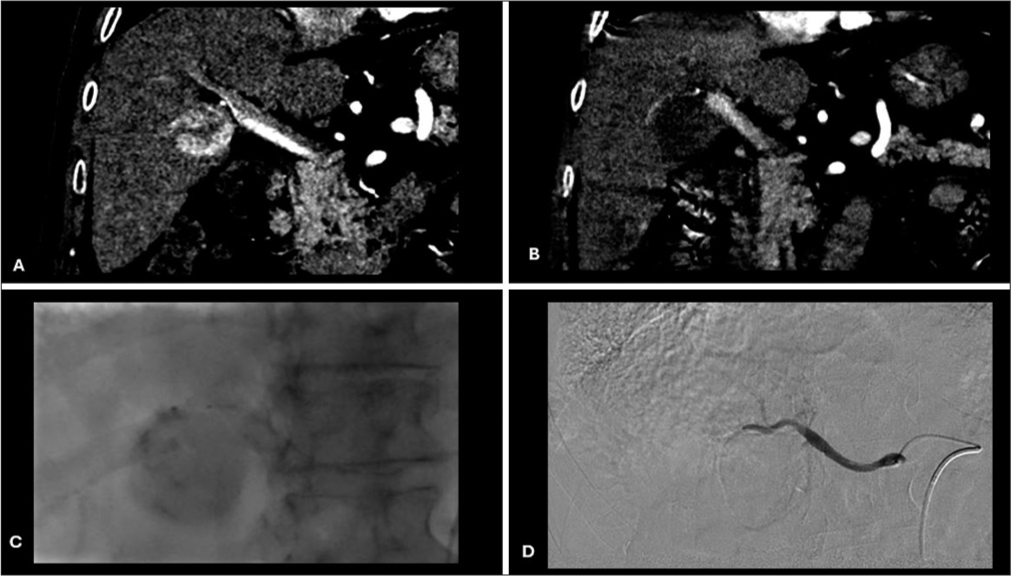
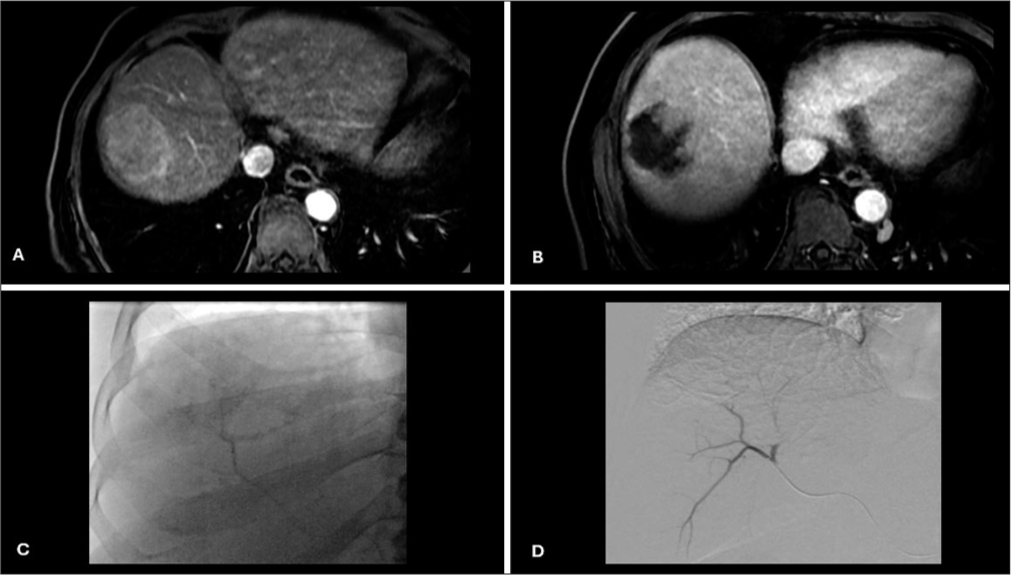
Contrast staining of tumor during chemoembolizationDuring the injection of drug-eluting beads loaded with doxorubicin and mixed with water-soluble contrast medium, contrast gradually accumulated in the HCC in variable amounts depending on the vascularity of the tumor, well-defined borders, and super selection of feeding arteries. Complete contrast staining (CCS) was defined as complete tumor contrast uptake during chemoembolization and no contrast uptake on post-chemoembolization angiography. Non-CCS was defined as partial or no tumor contrast uptake during chemoembolization [Figures 1-3].

Export to PPT

Export to PPT

Export to PPT
Follow-up and response evaluationAll patients underwent contrast-enhanced computed tomography (CT) or magnetic resonance imaging during follow-up at 4–8 weeks after DEBTACE. Response evaluation was performed based on the modified Response Evaluation Criteria in Solid Tumors (mRECIST).
Statistical analysisStatistical analyses were performed using the IBM Statistical Package for the Social Sciences software version 20 (IBM Corporation, New York, USA). Descriptive statistics were used to summarize the data and provide a comprehensive overview of their characteristics. Continuous data was presented using mean ± standard deviation and median (minimum, maximum) values. Categorical variables are represented as frequencies and percentages. Normality of the continuous data was checked using the Shapiro–Wilk test. As the variables were found to be non-normally distributed, the Mann–Whitney U-test was used to compare differences between groups. Chi-squared and Fisher’s exact tests were used to test the statistical significance of the cross-tabulation between categorical variables. Statistical significance was set at P < 0.05.
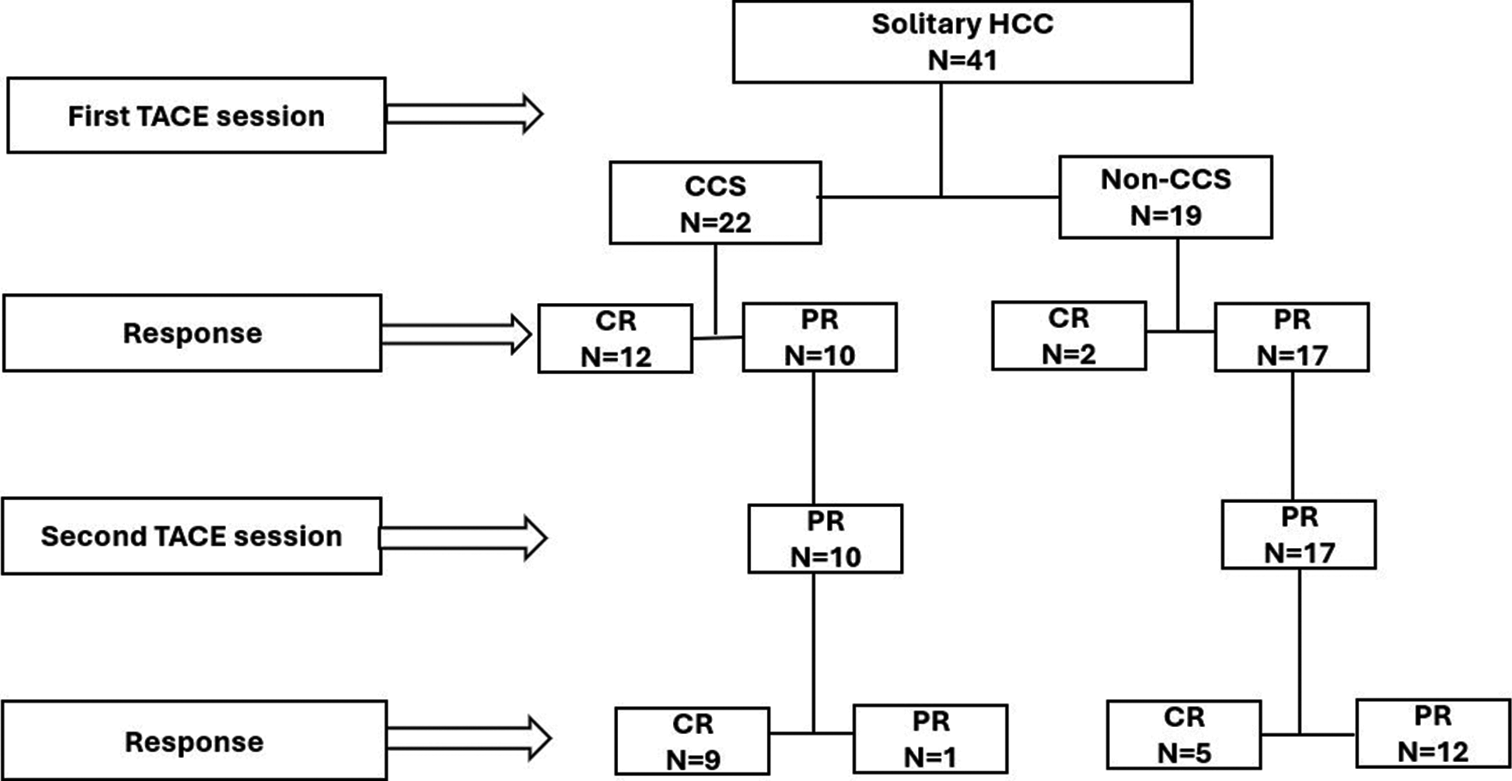
RESULTS Bassline characteristics of patientsA total of 41 patients with solitary HCC underwent DEBTACE as the primary treatment at a single institution. Figure 4 presents the flowchart of this study. Table 1 shows the baseline patient characteristics. The median age of participants was 70 years. The study participants comprised 28 men (68.3%) and 13 women (31.7%).

Export to PPT
Table 1: Patients’ characteristics.
Variables Sub category Number of patients (%) Age (years) Mean±SD 68.27±12.79 Median (Min, Max) 70 (27, 89) Gender Male 28 (68.3) Female 13 (31.7) Child Pugh score A 35 (85.4) B 6 (14.6) BCLC stage Stage A 41 (100) Etiology AIH 1 (2.4) Alcoholic 1 (2.4) HBV 11 (26.8) HCV 18 (43.9) NASH 7 (17.1) Non-cirrhotic 3 (7.3) First TACE doxorubicin dose (mg) Mean±SD 104.27±37.04 Median (Min, Max) 75 (75, 150) Second TACE doxorubin dose (mg) (n=27) Mean±SD 83.33±24.02 Median (Min, Max) 75 (75, 150) Size of HCC (cm) Mean±SD 4.66±2.3 Median (Min, Max) 4.8 (2.0, 10.5) AFP Normal 20 (48.8) Raised 21 (51.2) Borders Ill defined 4 (9.8) Well defined 37 (90.2) Capsules No 27 (65.9) Yes 14 (34.1) First TACE embolization point Lobar 10 (24.4) Super selective 31 (75.6) Second TACE embolization point Lobar 1 (3.7) Super selective 26 (96.3) Complete contrast staining No 19 (46.3) Yes 22 (53.7) Response CR 28 (68.3) PR 13 (31.7)Among the 41 patients, 85.4% had a Child-Pugh score of A and 14.6% had a Child-Pugh score of B. Hepatitis C virus was the most common etiology, found in 18 (43.9%) of the study participants, followed by hepatitis B virus in 11 (26.8%). α fetoprotein levels were normal in 20 (48.8%) study participants and elevated in 21 (51.2%). The median HCC lesions were 4.8 cm. The minimum and maximum sizes were 2 and 10.5 cm, respectively.
CCS versus non-CCSCCS was observed in 22 (53.7%) patients but not in 19 (46.3%) patients. Age and size of the HCC were significantly different between the CCS and non-CCS patient groups. The HCC borders and first and second TACE embolization points were significantly different between the CCS and non-CCS patient groups. There were no significant differences between the TACE doxorubicin doses between the CCS and non-CCS patient groups [Table 2].
Table 2: Comparison of categorical variables between CCS and non complete staining patients’ groups.
Variables Sub category CCS (%) Non-CCS (%) P-value Gender Female (n=13) 7 (53.8) 6 (46.2) 0.987 Male (n=28) 15 (53.6) 13 (46.4) Capsule No (n=27) 12 (44.4) 15 (55.6) 0.1 Yes (n=14) 10 (71.4) 4 (28.6) Borders Ill-defined (n=4) 0 (0) 4 (100) 0.038*# Well defined (n=37) 22 (58.5) 15 (40.5) First TACE embolization point Lobar (n=10) 2 (20) 8 (80) 0.017*# Super selective (n=31) 20 (64.5) 11 (35.5) Number of TACE session 1 (n=14) 12 (85.7) 2 (14.3) 0.003* 2 (n=27) 10 (37) 17 (63) Response to treatmentThe patients who had complete treatment response were younger than of those who had partial response (P = 0.031). The lesions were significantly smaller in patients with a complete response than in those with a partial response (P = 0.038). Significant statistical differences were also found between treatment response and Child–Pugh score (P = 0.046), lesion borders (P = 0.050), and capsule (P = 0.015). There was no significant difference in the first and second TACE dosages over treatment response [Table 3].
Table 3: Comparison of continues variables between complete contrast staining and non complete staining patients’ groups.
Variables Complete contrast staining n Mean±SD Median (Min, Max) U P-value Age Yes 22 64.27±12.92 67 (27, 83) 111.5 0.011* No 19 72.89±11.25 74 (41, 89) First TACE doxorubicin dose (mg) Yes 22 95.45±34.19 75 (75, 150) 156 0.101 No 19 114.47±38.47 150 (75, 150) Second TACE doxorubicin dose (mg) Yes 10 75±0 75 (75, 75) 70 0.473 No 17 88.24±29.47 75 (75, 150) Size of HCC (cm) Yes 22 3.92±1.86 3.35 (2.0, 7.8) 117.5 0.017* No 19 5.51±2.51 4.8 (2.3, 10.5) Association between CCS and treatment responseA complete response was observed in 54.54%, 90%, and 95.45% of CCS patient group after the first, second, and cumulative sessions of TACE, respectively. Complete responses were observed in 10.52%, 29.41%, and 36.84% in the non-CCS group after the first, second, and the cumulative sessions of TACE, respectively. The differences were found to be significant (0.003 < P < 0.001; [Table 4]).
Table 4: Cross tabulation of TACE response to contrast staining status.
Variable First TACE session response (n=41) P-value CR (%) PR (%) CCS (n=22) 12 (54.54) 10 (45.45) 0.003* NCCS (n=19) 2 (10.52) 17 (89.47) Second TACE session response (n=27) CCS (n=10) 9 (90) 1 (10) 0.004*# NCCS (n=17) 5 (29.41) 12 (70.58) Accumulative response after 2 TACE (n=41) CCS (n=22) 21 (95.45) 1 (4.54) <0.001* NCCS (n=19) 7 (36.84) 12 (63.15)Logistic regression results for predicting treatment response based on CCS revealed that CCS had a significant predictive effect on treatment response. In the presence of CCS, the odds for a complete response were 36 times higher than in its absence [Table 5].
Table 5: Logistic regression for predicting treatment response using CCS.
Variables B S.E. Wald Df P-value Odds ratio (95% CI) Constant −3.045 1.024 8.848 1 0.003* CCS: Yes (Ref: No) 3.584 1.129 10.081 1 0.001* 36.0 (3.94, 328.85) DISCUSSIONOur study found that CCS of HCC using 2D fluoroscopy during DEBTACE predicted the complete response of HCC. Well-defined HCC tumors and super-selective chemoembolization were significantly associated with CCS during DEBTACE. Younger patient age and smaller HCC size were independent factors associated with complete response. CCS of HCC seen on 2D fluoroscopy during DEBTACE may indicate that the chemotherapy-loaded beads accumulated and concentrated in the HCC tumor with no further arterial supply. In contrast, non-CCS was seen as partial HCC contrast staining or diffuse distribution of beads into the liver parenchyma and is likely related to the decreased accumulation of loaded beads in HCC. This could be secondary to the decreased vascularity of HCC or a persistent arterial feeder that was not embolized.
In cTACE, complete lipiodol deposition within the HCC tumor is likely related to complete embolization of all arterial feeders and diffusion of smaller tumor capillaries. However, incomplete lipiodol deposition is likely attributed to the incomplete embolization of all arterial feeders or the inability of lipiodol particles to diffuse into smaller tumor capillaries. It has also been linked to incompletely treated HCC with a higher chance of recurrence.[15]
\CCS during DEBTACE resembles complete lipiodol deposition in cTACE, and both indicate accumulation of embolized material in HCC tumors and complete embolization of all arterial feeders. However, non-CCS is similar to incomplete lipiodol deposition, and both are associated with incomplete embolization.
As lipiodol is permanently deposited in HCC, its distribution and amount can be easily assessed by unenhanced CT after the procedure. However, the water-soluble contrast used in DEBTACE temporarily stains HCC, and its assessment is very limited and transient.[14] Several studies have investigated the distribution of drug-eluting beads in DEBTACE using cone-beam CT (CBCT) and their relationship to HCC response.[14,16-18]
Fronda et al.[14] studied unenhanced CBCT at the end of DEBTACE and found that complete intense contrast deposition with a clear margin in treated HCC correlated with a complete response. Taiji et al.[16] studied computer tomography hepatic arteriography enhancement mapping by subtracting pre- and post-treatment CBCT images using a subtraction software. Their method has been reported to accurately predict complete response and identify residual tumors. Syha et al.[17] conducted a quantitative perfusion study and called the parenchymal blood volume using non-enhanced and enhanced CBCT pre- and post-DEBTACE. They found that residual tumor perfusion was associated with unfavorable outcomes and that the diameter of visible contrast media deposition correlated with complete response. Orlacchio et al.[18] studied unenhanced CBCT performed at the end of DEBTACE and found that contrast retention volume, diameter, and density in treated HCC were accurately associated with complete response.
Although CBCT can accurately delineate the distribution of drug-eluting beads in DEBTACE, its images are vulnerable to artifacts and require more time, radiation, and contrast doses. To the best of our knowledge, this is the first study to evaluate CCS of HCC using 2D fluoroscopy during DEBTACE and to address its association with complete response. Our study found that CCS of HCC can be observed by 2D fluoroscopy in 53% of patients, and it accurately predicted an accumulative complete response of 95.5% after 2 sessions of DEBTACE, with an odds ratio of 36. However, non-CCS of HCC achieved a complete response in 36.8% of the patients after 2 sessions of DEBTACE.
Our study has several limitations. First, it was a single-center retrospective study with an inherited bias. Second, the small number of patients may have affected the statistical analysis. Despite this, we included only patients with solitary HCC without vascular invasion and without prior intervention and subjected them to the standard DEBTACE technique and follow-up evaluation using the mRECIST criteria. These strict inclusion criteria, standard treatment techniques, and follow-up evaluations may ensure that these findings are reproducible.
CONCLUSIONCCS of HCC using 2D fluoroscopy during DEBTACE is an intraprocedural predictor of a favorable response after two sessions of DEBTACE treatment.
Comments (0)