Sample collection
This research is a descriptive cross-sectional investigation that employs specific inclusion and exclusion criteria. The inclusion criterion focuses on the generation of metabolites by Bacillus spp, while the exclusion criterion pertains to the impact of these metabolites on apoptosis induction in prostate cancer cells (PC-3). Following the previous research done by Shahniani et al., 70 soil samples were collected from different parts of Chaharmahal and Bakhtiari provinces in the spring of 2018, and these samples were obtained from a depth of 10 to 15 cm next to the plant roots. Then, the collected samples were transferred to the laboratory to isolate and identify gram-positive bacteria. To determine the phenotype of the bacteria, an analysis was conducted on the macroscopic and microscopic properties of each isolate after their culture and purification. Following the first identification process, the isolate that showed the highest potential for producing antimicrobial compounds with a broader spectrum of effects was determined via molecular identification methods. Genotypic identification of isolated soil isolates was done using 16SrRNA gene sequence, 16SrRNA forward and reverse primers, and polymerase chain reaction (PCR) [41]. Initial DNA extraction was conducted using a CinnaGen kit (Iran). Ensured DNA quality by measuring light absorption at 260/280 nm wavelength. To create a 25 µL master mix, mix 18 µL sterile distilled water, 2.5 µL 10X PCR buffer, 0.75 µL MgCl2, 0.5 µL dNTP, 1 µL forward and reverse primers (10 pmol/µL), 0.25 µL polymerase enzyme, and 1 µL template DNA. Final PCR program using thermal cycling equipment (Eppendorf, Germany). It was done at 95 C° for 30 s, 45 s at 56 C°, and 30 s at 72 C°. This process was repeated 30 times. A phylogenetic analysis was performed to compare the similarity of the sequences obtained in this study with the nucleotide databases of GenBank. For this purpose, the BLAST tool was used and the sequences selected from the bacterial strains isolated from the soil were evaluated with 10 sequences from the reference strain. The two stains’ sequence was submitted to the National Center for Biotechnology Information (NCBI) Data Bank and assigned accession numbers, which are listed in the Data Availability section.
Measuring the antimicrobial activity of gram-positive isolates
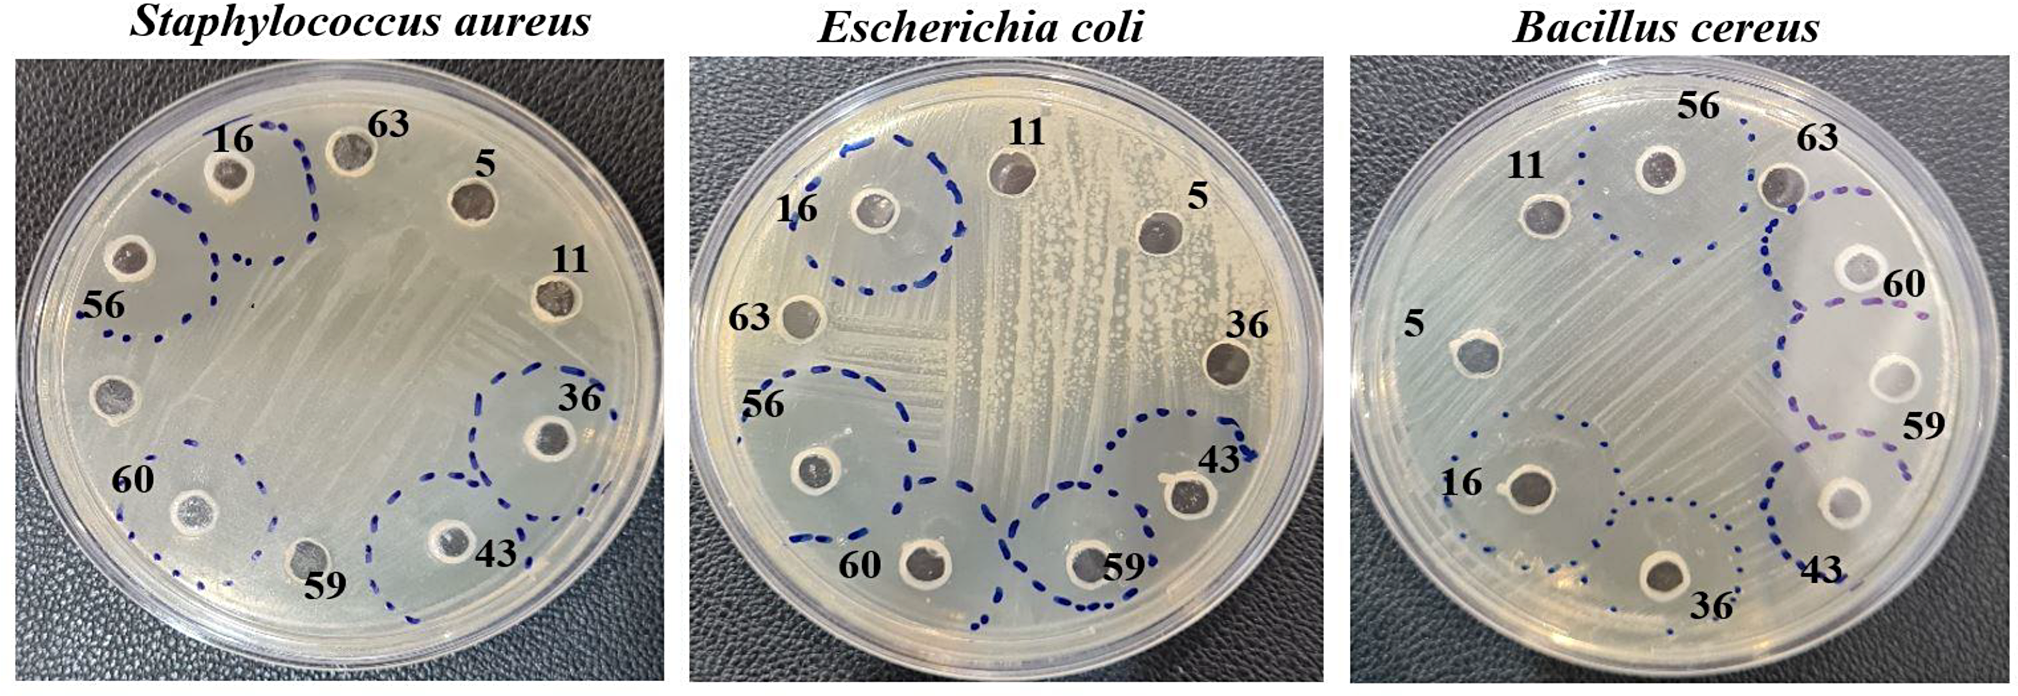
Following the initial discovery of gram-positive bacteria, a further investigation was conducted to explore their potential for creating antibiotic substances. This investigation used the agar well diffusion technique. One loop of selected pure isolates was inoculated into 50 mL of tryptic casein broth (Merck, Germany) culture medium and incubated at 37 °C and 250 rpm in a shaker incubator for 24 to 72 h. After the proliferation of the desired microorganisms, sterile sampling was conducted. 100 ml of the culture medium was centrifuged at 10,000 rpm for 20 min. The resulting supernatant was then collected for antimicrobial activity evaluation. To evaluate the antibacterial activity of the secondary metabolites isolated from the target gram-positive bacteria, standard strains of Escherichia coli (E. coli) (PTCC1399), Staphylococcus aureus (S. aureus) (PTCC1189), and B. cereus (PTCC1154) were prepared from the Scientific and Industrial Research Organization of Iran, the collection center of industrial and infectious fungi and bacteria. The bacteria were cultured in nutrient broth (Condalab, Spain) for 18–24 h at 37 °C. After that, the bacterial suspension was adjusted to a turbidity comparable to 0.5 McFarland solution (1–2 × 10⁸ CFU/mL, OD600). The aseptic brush was immersed in the solution and, afterward, used to disperse bacteria evenly onto a Muller-Hinton agar (Condalab, Spain) medium, aiming to achieve equal distribution throughout the surface of the plate. Cork borers were used to excise agar wells of 6 mm diameter, which were then filled with 100 µL of filtered supernatants. The plates were then incubated at 37 °C for 24 h. The millimeter-sized inhibition zones surrounding the wells were measured after incubation to assess the antibacterial effect [42].
Optimizing the production of secondary antibacterial metabolites
The purpose of optimization is to obtain the best environmental conditions for the production of antimicrobial metabolites with the highest production rate. Glucose, lactose, maltose, and peptone were used to determine the most suitable carbon and nitrogen sources. The above sources added 1% to the broth’s Tryptic Soy Broth (TSB) (Merck, Germany) medium. After the inoculation of the bacteria, the culture medium was incubated at the specified optimal temperature for 72 h. Also, the effect of pH (5–9) and temperature (30, 33, and 40) on optimizing the growth conditions of selected bacteria was investigated. Antimicrobial activity was measured using the agar well diffusion method against pathogenic bacteria E. coli, B. cereus, and S. aureus, and the plates were incubated at 37 °C for 24 h [43].
Extraction of compounds
The selection of the Bacillus isolates, which exhibited high activity, was based on the outcomes of primary and secondary screening (strains 56 and 60). These isolates were then subjected to a liquid-liquid extraction technique using several solvents to identify the bioactive metabolites. To the fermented culture filtrate, equal volumes of butanol, diethyl ether, petroleum ether, ethyl acetate, hexane, chloroform, acetone, methanol, and ethanol (bought from Sigma Company) were added and vigorously shaken for 30 min. In this method, each solvent was added separately to the culture medium. The two phases were subjected to vortexing for one hour. Then, a separating funnel was used for liquid-liquid extraction, and the resulting solution was added to it with two phases that did not dissolve in each other. The lower aqueous phase was removed, while the upper organic phase was collected and subjected to evaporation using a water bath maintained at a temperature of 40 °C. The thoroughly desiccated crude extract was collected and used for further investigations [44].
GC-MS analysis
Gas chromatography-mass spectrometry (GC-MS) was used to analyze the constituents of the crude extract from strains 56 and 60. The starting temperature of the gas chromatography (GC) oven was set to 50 °C and held for 5 min. Following this, the temperature was incrementally raised at a rate of 5 °C per minute until it reached a final temperature of 260 °C. The injector temperature was set to 250 °C, and the helium gas flow rate was set to 1.0 ml per minute with a 10:1 split ratio. The volume of the injected sample was 1 µl. The ion source temperature in the MS system was set to 250 °C, while the voltage applied was 70 eV. The examination was conducted at two separate times [45].
In vitro cytotoxicity studyCytotoxicity examination
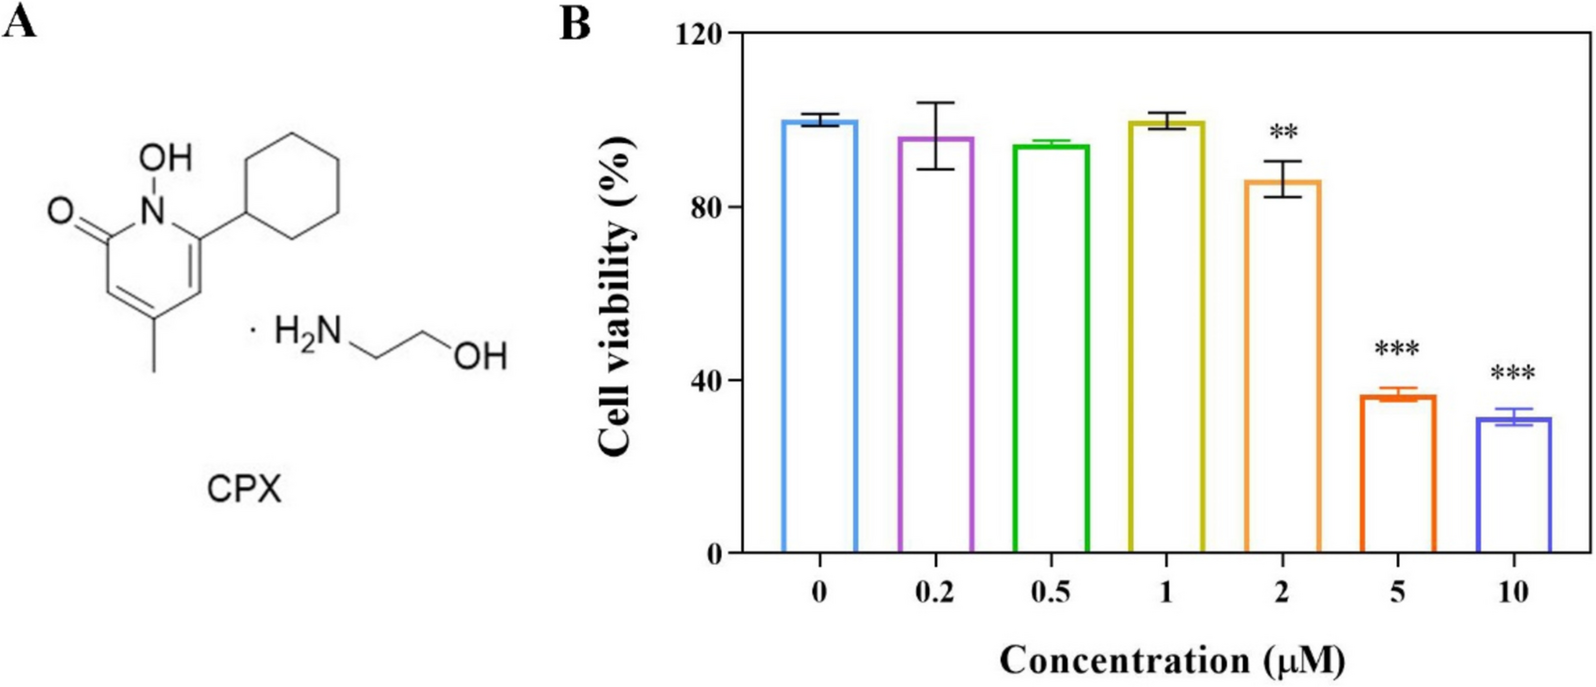
The underlying concept of the MTT test is the enzymatic conversion of tetrazolium salt into formazan, producing a blue-colored compound. The enzyme succinate dehydrogenase facilitates this conversion process. A total of 2 × 10⁶ PC-3 cells (human prostate cancer cell line) and Human primary prostate epithelial cell (HPrEpC) (Institute Pasteur Institute, Iran) were distributed over 96- and 24-well plates and incubated in a carbon dioxide (CO2) incubator for an entire night. The cells were treated with concentrations ranging from 12.5 to 200 µg/mL of a pure chemical of strains 56 and 60 for 24 h, after which they were exposed to a reagent at a concentration of 0.5 mg/ml. The culture medium was used as a negative control. The plates were incubated for 3 h in aluminum foil. ELISA readers measured absorbance at 570 nm as a standard. The dose-response curves for PC-3 and HPrEpC cell lines indicated the percentage of inhibition and the extract concentration required to inhibit cell growth by 50% (IC50) [46]:
$$\eqalign}\,}\,} \cr & \left[ }\,}\,}\,}\,}\,}\,}\,}\,}\,}\,}\,}} \right]} \cr}$$
Annexin-V/Propidium iodide apoptosis detection assay
Apoptosis rates in PC-3 cell populations treated with crude extracts of strains 56 and 60 were determined using the Apoptosis Detection Kit (APC)/annexin V (Mab Tag, Iran), following the instructions provided by the manufacturer. The cells were placed on 60 mm plates with a density of 2 × 10⁶ and were exposed to a dose of 50 µg/mL of the crud extract of Bacillus spp (strain 56 and 60) for 24 h. The cells were then collected using trypsinization for 3 min, then washed with PBS and finally suspended in the binding buffer included with the kit. The cells that did not receive any treatment were labeled as the untreated control. The cells were treated with APC/annexin V and PI at room temperature for 15 min in a darkroom prior to the addition of binding buffer. Following this, the cells underwent examination using a flow cytometer (BD FACS Calibur), and the inquiry results were calculated using BD Cell Quest Pro Ver.6.0 software [47].
Investigation of cell cycle arrest
The assessment of cell proliferation was conducted using propidium iodide (PI) staining. The DNA content is used to ascertain the phase of the cell cycle, since the amount of DNA present is closely correlated with the binding of PI to DNA. The cells were cultivated in complete media in 6-well plates at a density of 1 × 10⁶ cells per well. Following overnight incubation and three washes with PBS, the cells were exposed to a concentration of 50 µg/mL of the crude extract derived from Bacillus spp (strains 56 and 60) for a duration of 24 h in a complete medium. Subsequently, the cells were collected and preserved in 70% refrigerated ethanol for a duration of one night at a temperature of 4 °C. Afterwards, the cells were treated with 450 µL of PI solution (including RNase) in the absence of light for 20 min at room temperature. Finally, the cells were examined using flow cytometry. The experiments were replicated thrice [48].
Comet assay
The comet assay was conducted following the methods described in the relevant literature. The slides were submerged in a lysis solution containing 2.5 M NaCl, 100 mM EDTA, 10 mM Tris, 90 mM sodium sarcosinate, NaOH (pH = 10), 1% Triton X-100, and 10% DMSO. Subsequently, the slides were refrigerated at 4 °C for 2 h. DNA was unraveled for 30 min on horizontal slides in an electrophoresis chamber. Next, electrophoresis was performed at 25 V and 300 mA for 20 min. Post-electrophoresis, slides were washed thrice in a neutralizing buffer (400 mM Tris, HCl, pH 7.5). After treating the slides with ethidium bromide (10 µg/ml), a fluorescence microscopy apparatus (Motic, Germany) with a green filter magnified them 100 times [48].
Gene expression analysis of apoptotic and anti-apoptotic genes
The expression levels of apoptotic genes, including caspase 3, caspase 8, and Bax, and the anti-apoptotic gene Bcl-2 in PC-3-treated cancer cells were verified using Real time PCR. Initially, over 24 h, the cancer cells were treated with a crude extract derived from Bacillus spp, using varying doses of 50 µg/ml and 50 µg/ml. Subsequently, the whole RNA was extracted from both the control and treated cells, and the process of cDNA synthesis was carried out according to the guidelines provided by the manufacturer using a cDNA synthesis kit (Parstous, Iran). Following the cDNA production, the investigation of apoptotic gene expressions was conducted using RT-PCR analysis. The fold difference was normalized using the 2–ΔΔct method. The sequences of the primers used are listed in Table 2. The GAPDH gene was used as a reference gene [49].
Table 2 The qPCR primers designed by primer3plus toolAssessment of cell migration (scratch test)
PC-3 cells were inoculated onto 6-well plates and allowed to incubate for one night. Subsequently, a linear incision was created inside the cellular monolayer using a delicate scratch instrument or implement. Using caution to preserve consistency in the scratch tool or knife is essential, ensuring uniformity in scratch shape and breadth. Subsequently, following the creation of the scratch, an image was expeditiously taken using a cellular microscope to serve as the baseline time point (0 h). Each well received the growth media with Bacillus spp. Crud extract and the cells were incubated at 37 °C, 5% CO2 for 24 h. Cells treated with blank culture medium were considered as a control group. After incubation, the same region was imaged again using a cell microscope, and the scratch breadth was measured [49].
Statistical analysis
The data was subjected to statistical analysis using GraphPad Prism 5.0, and the results were presented as the mean ± standard deviation. The data underwent examination via the use of a one-way analysis of variance (ANOVA). To facilitate comparisons between group pairings, a T-test was used at a significance level (p-value) of 0.05.


Comments (0)