
Remember me


Consistent with previous EM reports [16], in adult mouse brain’s CA1 region of the hippocampus, the great majority of inhibitory synapses are on neuronal soma and dendritic shafts (Fig. 2A) while the great majority of excitatory synapses are on dendritic spines (asterisk in Fig. 2B). Aside from this difference in preferential location of the two types of synapses, the most conspicuous structural difference is that excitatory synapses have a prominent postsynaptic density (PSD, the edges of which are marked by two solid arrows in Fig. 2E), hence the two sides of the synaptic cleft appear “asymmetric” [16, 20]. In contrast, the inhibitory synapses lack a PSD, thus, appear “symmetric” with similar appearance in the pre- and postsynaptic compartments at the junctional area (ellipses in Fig. 2A -C and D). This difference in appearance of the two types of synapses are due to their different compositions in the postsynaptic scaffold proteins [12, 21].
Fig. 2
Representative images from stratum radiatum of the CA1 region of mouse hippocampus. Inhibitory synapses (enclosed in ellipses) are located on soma and dendritic shafts (A, B, C), while excitatory synapses (the presynaptic terminals of which are marked as “E”) are mostly on spines (asterisk in B, C) with a prominent postsynaptic density (PSD). Enlarged images of inhibitory (D) and excitatory (E) synapses showed similar width (~ 20 nm) in synaptic cleft, containing similar cleft material (small arrows in D & E point to synaptic cleft between uniformly apposed pre- and postsynaptic membranes). The size and shape of synaptic vesicles (SV) in inhibitory and excitatory synapses in A & B were similar (samples fixed with 2% glutaraldehyde and 2% paraformaldehyde), but SV size was smaller in inhibitory than in excitatory synapses in C- E (samples fixed with 3.5% acrolein followed by paraformaldehyde and glutaraldehyde). Scale bar = 100 nm
Another structural difference is that synaptic vesicles (SV) were smaller in the GABAergic inhibitory synapses (Fig. 2D; ~35 nm in diameter) than in the glutamatergic excitatory synapses (Fig. 2E; ~45 mm in diameter) in samples initially fixed with acrolein (Fig. 2C-E). However, when samples were fixed with glutaraldehyde mixed with paraformaldehyde (Fig. 2A-B), both inhibitory and excitatory SVs showed similar diameters of ~ 45 nm. The present observation is in line with a previous EM study showing different processing methods affected the size and shape of SVs containing different transmitters [22]. Thus, size and shape of SVs can only be used to identity inhibitory vs. excitatory synapses under certain specific fixation and processing conditions.
Notably, the two types of synapses showed similar structural features at the synaptic cleft with a uniform distance of ~ 20 nm between the pre-and postsynaptic membranes, spanned with similar-looking cleft material (small arrows in Fig. 2D & E).
In rat organotypic slice cultures and dissociated cell culturesOrganotypic hippocampal slice cultures retain the anatomical organization and synaptic connection of the intact brains. Thus, the great majority of inhibitory synapses were located on the somas of stratum pyramidale and on dendritic shafts in stratum radiatum (Fig. 3A, marked as “I”), while the great majority of excitatory synapses were on spines (Fig. 3A, marked as “E”). However, in 3 weeks old-dissociated hippocampal cell cultures, many excitatory synapses are found on dendritic shafts (Fig. 3B) as well as on spines. The in vitro samples yielded synapses with similar structural features as their counterparts in brain, in that the excitatory synapses displayed distinctive PSDs. Although inhibitory synapses lack a prominent PSD, their postsynaptic membrane specifically label for gephyrin, a GABAergic synaptic marker [2] (Fig. 3B).
Fig. 3
Examples of inhibitory synapses from hippocampal organotypic slice cultures (A) and dissociated cell cultures (B). In slice cultures, inhibitory synapses (the presynaptic terminal of which was marked as “I”) were typically located on dendritic shaft, while excitatory synapses (marked as “E”) were on spines, with a distinctive PSD. (B) In 3 weeks old-dissociated hippocampal cell cultures, an inhibitory (I) synapse was labeled by a gephyrin antibody, a GABAergic synaptic marker. The same dendrite also exhibited an excitatory synapse (E) with a distinctive PSD (the edges of which marked by two arrows). Scale bar = 100 nm
In the present study, all in vitro samples were fixed with 4% glutaraldehyde in 0.1 M cacodylate buffer for ultrastructural characterizations (Fig. 3A), and with 4% paraformaldehyde in PBS for pre-embedding immunogold labeling (Fig. 3B). Under these fixation and sample processing conditions, no conspicuous differences were detected between inhibitory and excitatory synapses in SV size, synaptic cleft width, or appearance of synaptic cleft materials.
Adherence junctions near inhibitory synapsesWe noticed that adherence junctions were more frequently encountered near inhibitory synapses (Fig. 4A, C) than near excitatory synapses (Fig. 4B, D). Quantification of occurrence frequencies of adherence junctions show a similar trend in all three experimental systems (Fig. 4E; Supplementary Material 1: Table S1).
Fig. 4
Adherence junctions (boxed area) were often seen adjacent to inhibitory synapses (A, C), and occasionally at excitatory synapses (B, D). All examples here were from 3 weeks old-dissociated cell cultures. The distance of the gap between the two membranes of the adherence junction was narrower than synaptic cleft in both type of synapses. Label for gephyrin (C), a marker for GABAergic inhibitory synapse, clearly delineate the postsynaptic membrane next to the adherence junction. Label for synaptophysin (B), a SV membrane protein [9], and label for Shank (D), a PSD scaffold protein [7], specifically labeled the pre-and postsynaptic side of excitatory synapses. Scale bar = 100 nm. (E) Occurrence frequency (%) of adherence junctions in inhibitory vs. excitatory synaptic profiles from three experimental systems, 2 experiments each (Supplementary Material 1: Table S1)
Adherence junctions (boxed in Fig. 4) are composed of two rigidly apposed membranes between the pre- and postsynaptic membranes, each with dense material on their cytoplasmic side of the membranes, and with some trans-gap filamentous material between the apposing membranes. The distance of this gap was narrower (~ 15 nm) than that of the synaptic cleft (~ 20 nm), and this difference is likely due to the different composition of molecules at adherence junctions [23] vs. at synaptic clefts [24].
Due to the lack of a prominent PSD in inhibitory synapses, the nearby adherence junctions with characteristic dense material typically stood out distinctively (boxed in Fig. 4A). The juxtaposed location of adherence junctions (boxed in Fig. 4C) at inhibitory synapses is further illustrated by label for gephyrin of the inhibitory postsynaptic membrane. In contrast, in excitatory synapses, even though the prominent PSD clearly delineates the border of the synaptic contact (arrows in Fig. 4B, D), the adjacent adherence junction (boxed in Fig. 4B, D) could sometimes be misidentified as part of the PSD unless the presynaptic side of the adherence junction was unequivocally caught in thin sections (Fig. 4B), or the PSD was specifically immunolabeled while the adherence junction was not (Fig. 4D).
Inhibitory synapses were formed early in developmentSimilar to excitatory synapses [13, 14], inhibitory synapses were formed as early as 4 DIV in dissociated cultures. Inhibitory synapses in these young cultures were identified with immunolabeling of gephyrin at the postsynaptic membrane (Fig. 5A), or piccolo (Fig. 5B) and bassoon (Fig. 5C) at the presynaptic active zone [13]. Adherence junctions were also present near inhibitory synapses at this young age (boxed in Fig. 5C).
Fig. 5
Inhibitory synapses in dissociated cultures at 4 (C) and 5 (A, B) days in culture. Label for gephyrin (A) marked the postsynaptic membrane, and label for piccolo (B) and bassoon (C) marked the presynaptic active zone. Adherence junction (box in C) was also present early in development. Scale bar = 100 nm
Structural changes of inhibitory synapses upon stimulationIn the present study, stimulation is carried out by a 5 min delay in perfusion fixation for brain tissues to cause an ischemia-like excitatory condition, and by depolarization with high K+ (90 mM for 2–3 min) in organotypic slice cultures and dissociated cell cultures, where high extracellular potassium concentration will generate action potentials in axons leading to synaptic vesicle release. This depolarization-induced SV release is expected in both the excitatory and inhibitory presynaptic terminals.
Structural changes at presynaptic terminalsDepletion of synaptic vesiclesSimilar to excitatory synapses [9], upon stimulation, there was conspicuous depletion of SVs in inhibitory synapses from brains (Fig. 6A vs. B), slice cultures (Fig. 6C vs. D) and 3wk-old dissociated cell cultures (Fig. 6E vs. F). In brains and organotypic slice cultures, sampling of inhibitory synapses was restricted to stratum pyramidale and proximal stratum radiatum, and SV numbers were counted from an area within 200 nm of the active zone [9]. There were no significant differences in the number of SV located within 66 nm of the active zone between control and stimulated samples, but significant decrease of SV in the area further away (67–200 nm) from the active zone. In two experiments each, SV numbers in this zone III in delayed fixed brains decreased to 67 and 78% of those in fast fixed brains (Fig. 6G); and to 49 and 65% of control values in slice cultures upon 2–3 min of depolarization with high K+ (Fig. 6H; Supplementary Material 1: Table S2).
Fig. 6
Inhibitory synapses under control vs. stimulated conditions sampled from stratum pyramidale and proximal stratum radiatum of the CA1 region of adult mouse hippocampus (A, fast perfusion; B, delayed perfusion; with initial acrolein fixation), organotypic slice cultures (C, control; D, depolarization with 90 mM K+ for 3 min), and from 3 weeks old-dissociation hippocampal cultures (E, control; F, depolarization with 90 mM K+ for 2 min). Upon stimulation, the presynaptic terminals showed SV depletion in all three experimental systems (left column vs. right column). (G, H) Bar graphs showing SV numbers upon stimulation as percent of control samples in zone I (0–33 nm), zone II (34–66 nm), and zone III (67–200 nm from presynaptic membrane) from presynaptic terminals sampled from perfusion-fixed brains (G) and slice cultures (H), 2 experiments each (Supplementary Material 1: Table S2). Clathrin-coated vesicles (circled in B) and spinules (arrow in D) were prevalent in stimulated brains (B) and slice cultures (D), respectively. (I, J) Bar graphs on number of clathrin-coated pits (CCP) and vesicles (CCV) in presynaptic terminals under resting and stimulated conditions sampled from perfusion-fixed brains (I) and slice cultures (J), 2 experiments each (Supplementary Material 1: Table S3). No structural changes were detected in the postsynaptic compartment of inhibitory synapses upon stimulation. Scale bar = 100 nm
Increase of clathrin-coated pits and vesiclesAs in the case of excitatory synapses [19], number of clathrin-coated pits (CCP) and vesicles (CCV) in inhibitory presynaptic terminals of delayed fixed brains increased to about 4.5 to 6.7-fold of those in fast fixed samples (Fig. 6I). Likewise, upon 2–3 min of depolarization with high K+, number of CCP and CCV increased to about 3-fold of control levels in slice cultures (Fig. 6J; Supplementary Material 1: Table S3). Interestingly, spinules were frequently seen in inhibitory axon terminals upon stimulation (arrow in Fig. 6D), as in the case of excitatory synaptic terminals, indicative of synaptic activity [10].
No structural changes detected in the postsynaptic compartment of inhibitory synapses upon stimulationNo change in length and curvature of postsynaptic membraneAs in the case for excitatory synapses [6], the length of the postsynaptic membrane of inhibitory synapses did not change upon stimulation (Supplementary Material 1: Table S4). The average length of postsynaptic membrane of inhibitory synapses in adult mouse hippocampal CA1 stratum pyramidale and proximal stratum radiatum region at ~ 230 nm is in line with the size of area from en face view of rat hippocampal GABAergic synapses at ~ 0.05 µm2 [25].
In contrast to excitatory synapses [6], there was no consistent change in the curvature of the postsynaptic membrane of inhibitory synapses (Supplementary Material 1: Table S4). The majority of inhibitory synapses had a relatively flat curvature (Fig. 6). The two sets of perfusion-fixed brains showed a slight decrease in curvature index, but the differences did not reach statistical significance. In organotypic slice cultures, one experiment showed a significant decrease, but the second experiment showed a slight increase. In dissociated, gephyrin-labeled cell cultures, one experiment showed a significant increase, but a second experiment showed a slight decrease (Supplementary Material 1: Table S4).
No change in gephyrin labeling densityLabeling density for gephyrin in dissociated cell cultures were measured as number of gold particles per µm of postsynaptic membrane. No significant differences were detected between control and high K+-treated samples (Supplementary Material 1: Table S5).
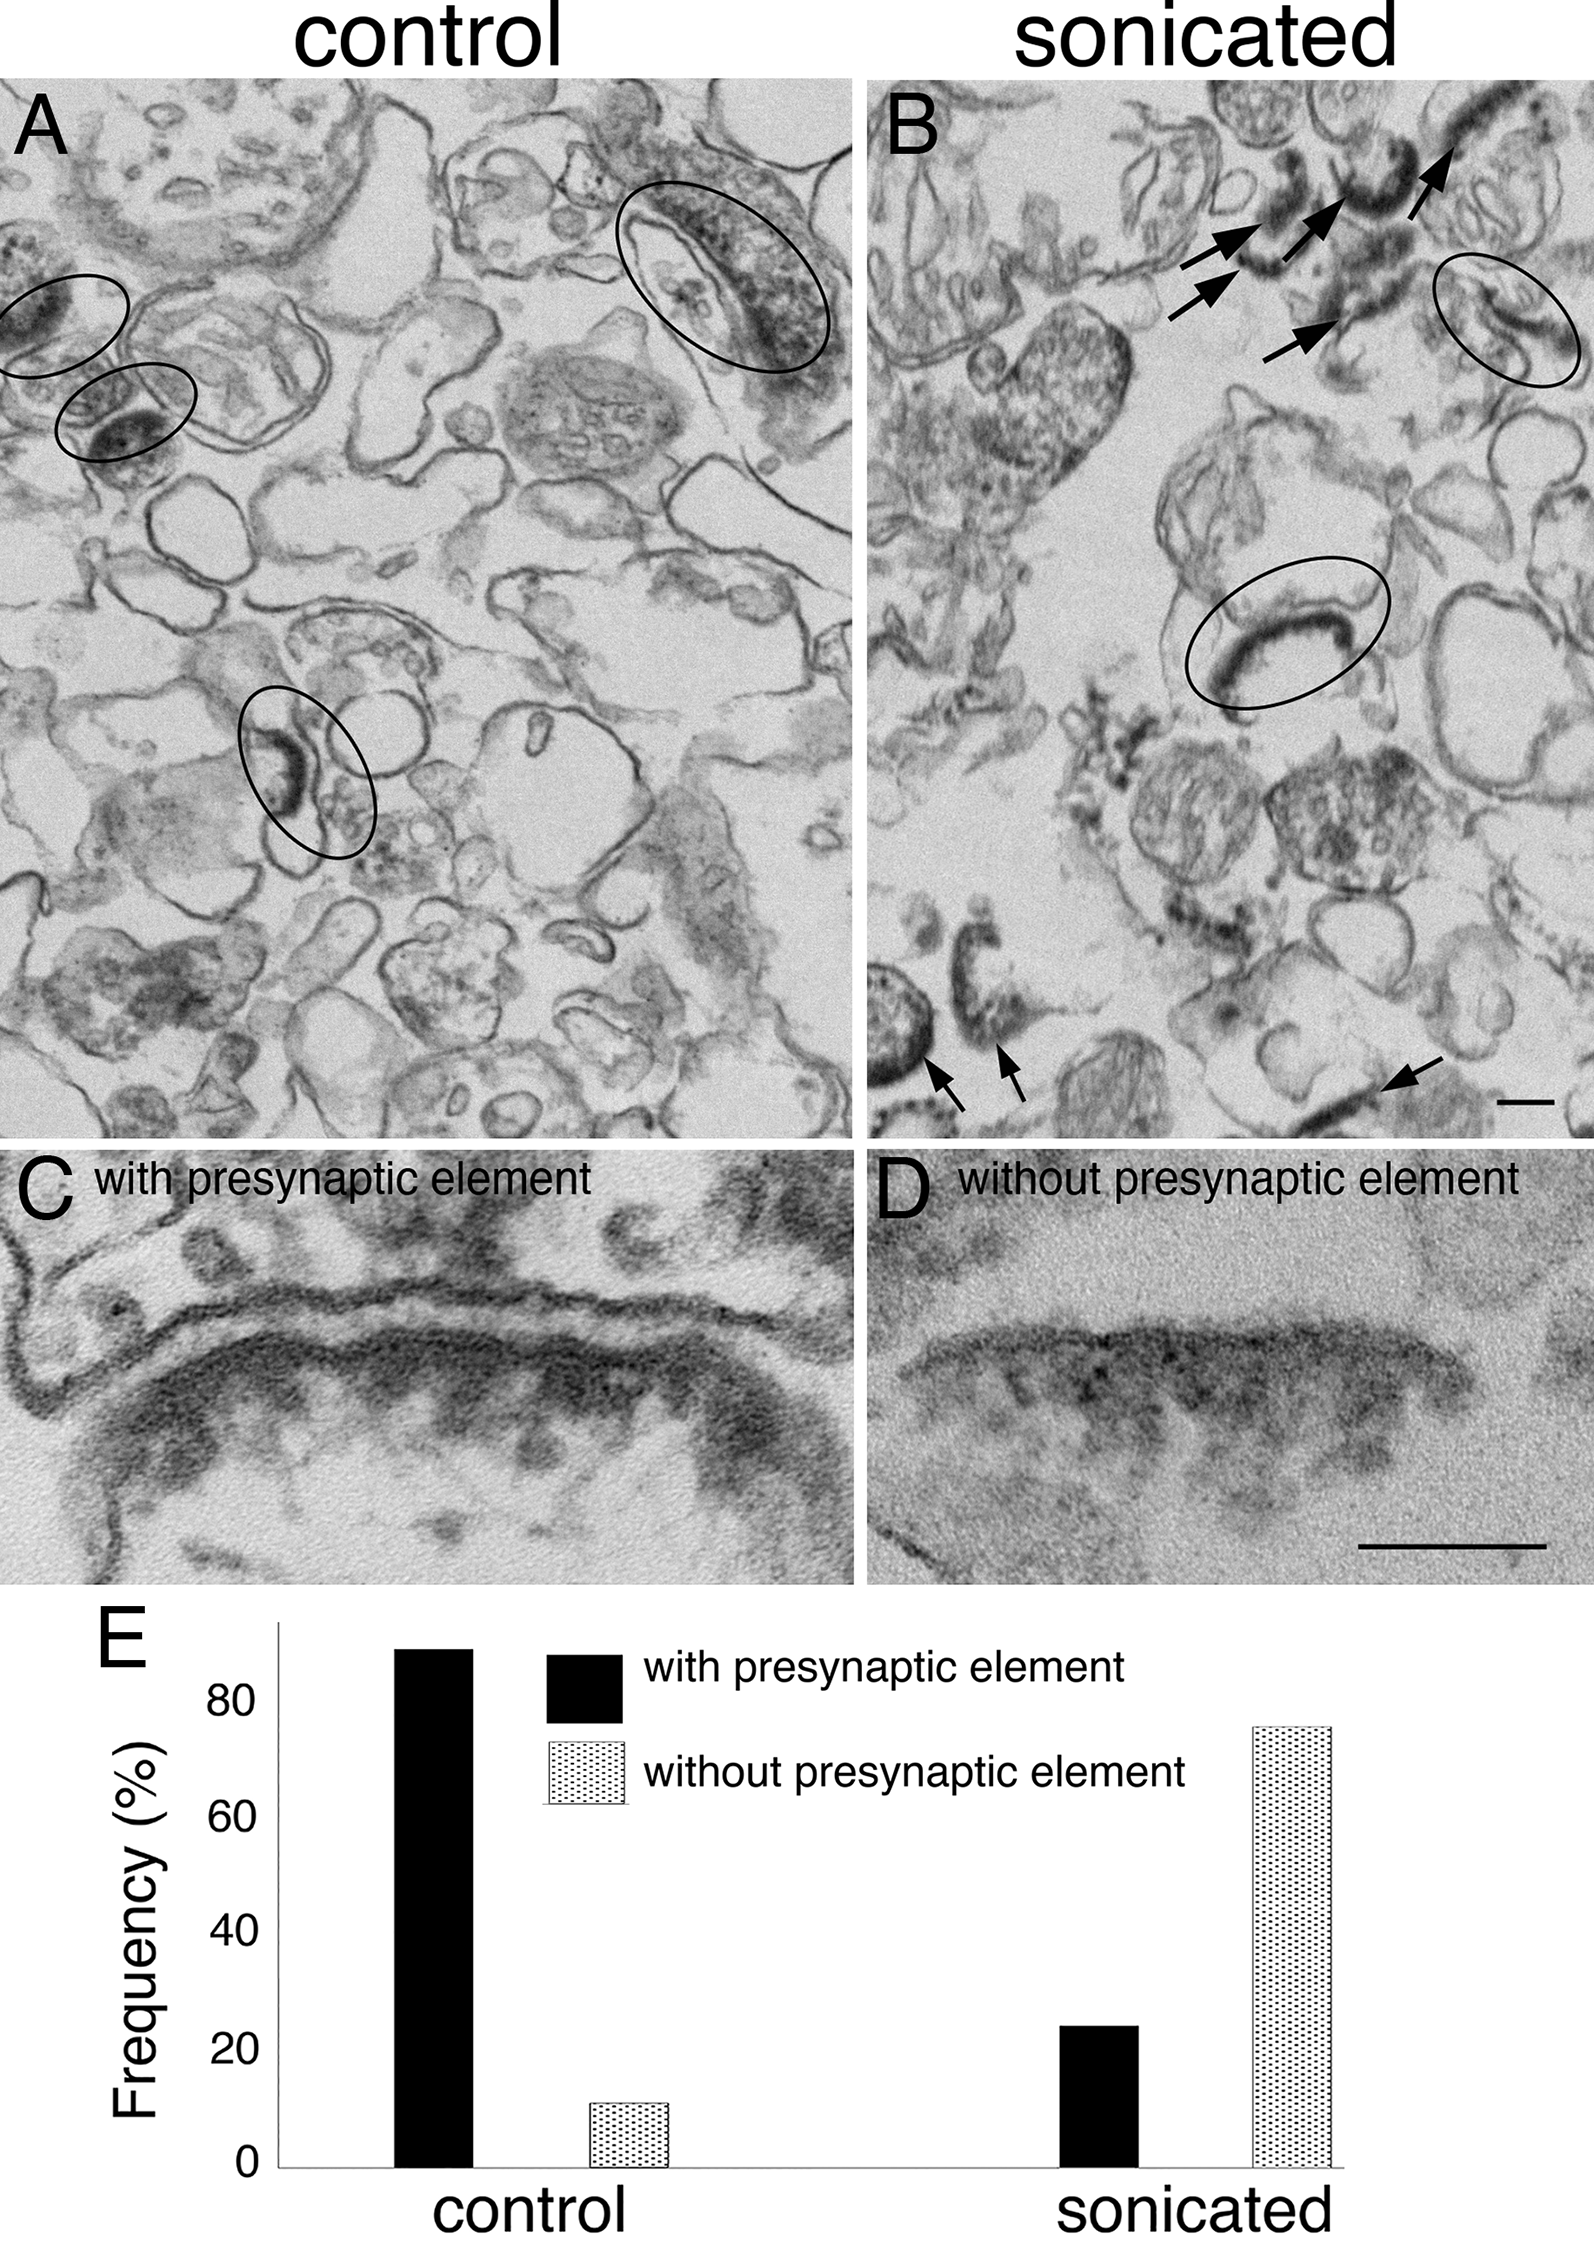
Few open clefts were detected in inhibitory synapses upon stimulationUnlike in excitatory synapses [11] where ~ 20–30% of synaptic cleft edges were open upon stimulation, very few open clefts were seen in inhibitory synapses. In perfusion-fixed brains, no open clefts were seen in inhibitory synapses sampled in stratum pyramidale and proximal stratum radiatum (Fig. 6A, B) formed by parvalbumin-positive interneurons. Sampling from distal region of stratum radiatum where many inhibitory synapses are formed by somatostatin-positive interneurons also yielded no open clefts. Thus, inhibitory synapses formed by these two types of interneurons do not form open clefts upon delayed perfusion fixation. Similarly, no open clefts were seen in inhibitory synapses from organotypic slice cultures (Fig. 6C, D), and from dissociated cultures (Fig. 6E, F) whether under resting or stimulated conditions.
Notably, images in Fig. 6 were sampled from acrolein- or glutaraldehyde-fixed materials, where inhibitory synapses may be overlooked due to the lack of a prominent postsynaptic membrane. In order to further verify that we did not miss any inhibitory synapses during sampling, we scored gephyrin-labeled inhibitory synapses for open clefts in 3 week-old dissociated cultures under different conditions (Supplementary Material 1: Table S6). Indeed, in contrast to excitatory synapses (Fig. 7B, D), the great majority of gephyrin-labeled inhibitory synapses did not have open cleft upon depolarization with high K+ (Fig. 7A, C), with only 1.5% (4 out of 261) cleft edges from 3 experiments showing open clefts. Similarly, 1.3% (3 out of 225) cleft edges under control conditions had open clefts. The finding that the stimulation-induced occurrence frequency of open clefts is higher in excitatory than in inhibitory synapses could have functional implications.
Fig. 7
Inhibitory (A, C) and excitatory (B, D) synapses from 3 weeks old-dissociated hippocampal cultures upon 2–3 min depolarization with high K+, or NMDA treatment (E). (A, C) Label for gephyrin underlie the postsynaptic membrane of GABAergic synapses and clearly delineates the edges of the synaptic cleft. Very few open clefts were present in inhibitory synapses upon depolarization, whereas the postsynaptic density (PSD, specifically labeled for homer in D; [7]) of excitatory synapses increased in thickness (B, D), and ~ 20% of the edges displayed open clefts (hollow arrows in B, D). (E) Activation of NMDA receptors (60 µM NMDA for 2 min) induced an increase in thickness of the PSD (the edges of which are marked with two solid arrows) and an open cleft (hollow arrow) in excitatory synapses (the presynaptic terminal marked as “E”). A nearby inhibitory synapse (marked as “I”) on the same dendritic shaft had normal cleft edges. Scale bar = 100 nm
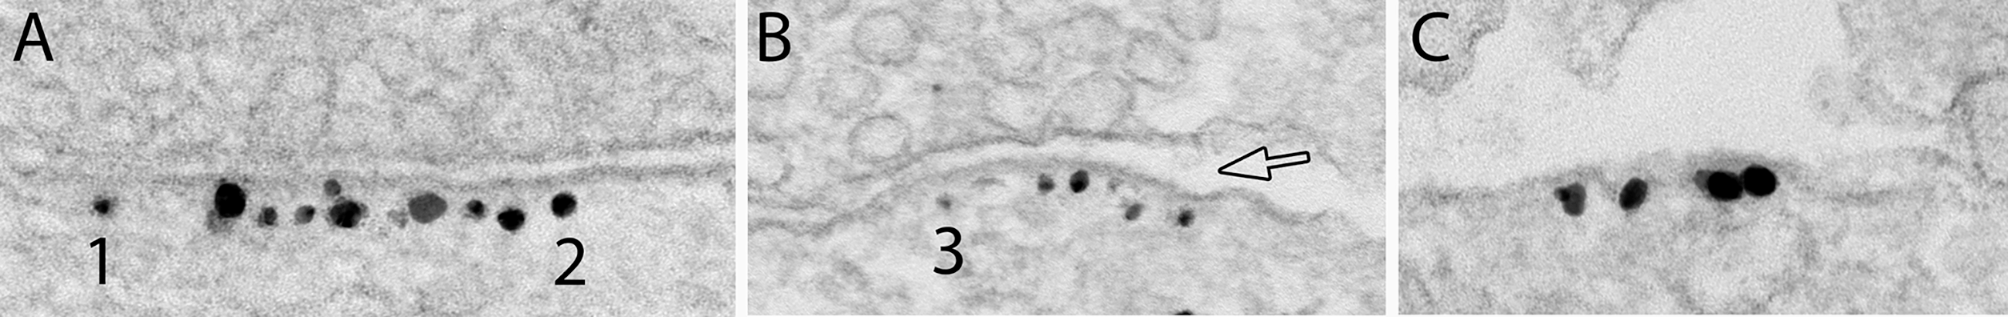
Calcium affects structural integrity of synaptic cleft of inhibitory synapsesTo test whether calcium affects the synaptic cleft integrity, 3 week-old dissociated cells were treated with a calcium chelator, EGTA (100 mM), for 5 min. In 3 experiments, about 82% (172 out of 209) of cleft edges from inhibitory synapses were normal (Fig. 8A) with the presynaptic membrane rigidly apposed to the gephyrin-labeled postsynaptic membrane with a uniform gap, while ~ 14–21% of inhibitory synaptic clefts were open (Fig. 8B, amp, C and F; Supplementary Material 1: Table S6) with the edges of the gephyrin-labeled patches of postsynaptic membrane exposed to the extracellular space separating from the presynaptic terminal (hollow arrows in Fig. 8B & C). Additionally, patches of gephyrin-labeled membranes were occasionally seen unopposed by presynaptic terminals (Fig. 8D, E), with 7, 4, and 2 unapposed patches in experiment 1, 2 and 3, respectively. Such unopposed gephyrin patches were only seen in EGTA-treated samples and not in control or high K+-treated samples. Thus, it appears that in some synapses, calcium-free conditions induced dissociation of trans-synaptic bridges between pre- and postsynaptic membranes, especially at the edges of the synaptic junction, and sometimes may proceed to complete separation of the junctional membranes.
Fig. 8
Synaptic clefts of Inhibitory synapses are disrupted under calcium-free conditions. Label for gephyrin, a GABAergic synapse marker, lined the cytoplasmic side of the inhibitory postsynaptic membrane. Images were from 3 week-old hippocampal dissociated cell cultures treated with 5 min of EGTA. (A) showed a synapse with normal clefts on both edges, while B & C showed open clefts (hollow arrows), and D & E showed unopposed patches of gephyrin-labeled membrane, sometimes with axon terminals nearby, but not close enough to be counted as a synaptic contact. Scale bar = 100 nm. (F) Bar graphs on occurrence frequency of open clefts in gephyrin-labeled inhibitory synapses under different conditions, 3 experiments (Supplementary Material 1: Table S6)
Comments (0)