Reagents and antibodies
Avermectin B1 (S4999) and dorsomorphin (S7840) were purchased from Selleck (Shanghai, China). Anti-LC3B (3868T), Caspase-9 (9502T), Atg7 (8558T), mTOR (2983 S), p-mTOR (5536 S), ULK1 (8054T), AMPK (5831T), and p-AMPK (2535T) antibodies were purchased from Cell Signaling Technology (CST, Shanghai, China). Anti-β-actin (HRP-60,008), Bax (50599-2-Ig), BAD (10435-1-AP), CDK4 (66950-1-Ig), CDK6 (14052-1-AP), CyclinD1 (60186-1-Ig), CyclinD2 (67048-1-Ig), Atg13 (66708-1-Ig), Atg14 (19491-1-AP) and Beclin1 (66665-1-Ig) antibodies were purchased from Proteintech (Wuhan, Hubei, China).
Cell lines and treatment
The three osteosarcoma cell lines (MNNG, MG63, U2OS) were obtained from the American Type Culture Collection (ATCC) (Manassas, VA, USA). The culture medium for the MNNG and MG63 cell lines was Dulbecco’s modified Eagle’s medium (DMEM), and the U2OS cell line was RPMI-1640 medium. Each medium contained 10% fetal bovine serum (FBS), penicillin (100 U/ml) and streptavidin (100 mg/ml). The cell culture environment was 37 °C in an incubator with 5% CO2.
Determination of IC50 of avermectin B1
Osteosarcoma cells (5000 cells/well) were plated into 96-well plates and incubated with various concentrations of Avermectin B1 (ranging from 0 to 40 mg/mL with a gradient of 5) for 48 h. Then, a Cell Counting Kit (CCK-8) was used to analyze the half-maximal inhibitory concentration (IC50) of avermectin B1.
Proliferation assay
OS cells were plated into 96-well plates (5000 cells/well) and incubated overnight for adherence. Next, the cells were treated with the IC50 of avermectin B1, and the cell proliferation assay was evaluated by CCK-8 assay for 5 days.
Clone formation assay
Cells in the logarithmic growth phase were treated with avermectin B1 for 48 h. Cells were digested with trypsin and plated into 6-well plates (1 × 10³ cells/well). After a 10-day incubation, the cells were fixed in methanol at room temperature and stained with 0.1% crystal violet for 30 min. Then, the number of colonies was counted.
Cell migration and invasion assay
Cells treated with IC25 and IC50 concentrations and control cells for 48 h were washed to remove the avermectin B1, and then seeded in the Transwell chambers (Corning) with the same cell density of 2 × 10⁵ cells/ml using new fresh serum-free medium. The number of viable cells was standardized using the Countess 3/3FL Automated Cell Counter (Invitrogen, USA). 0.2mL (empty penetration to assess cell migration) or 0.1mL (gel penetration) was added slowly and uniformly to the Transwell chambers. The lower chamber was filled with 800 µL of complete medium containing 10% fetal bovine serum. The 24-well plates containing Transwell chambers were incubated for 18–36 h. The time of removal of the chambers was adjusted according to the characteristics of the cells. The cells were fixed in methanol, stained with crystal violet and photographed under a microscope. Five cells were counted randomly in each chamber and the average value was taken. Three replicate wells were set up for each cell type to be tested.
Wound healing assay
OS cells were plated into a 6-well plate to achieve a density of 90%. Then, the cells were scraped/wounded using a yellow tip, washed 3 times with PBS, and photographed under the microscope for 0 h. After treatment with culture medium (1% FBS) containing different concentrations of avermectin B1, the cells were photographed at 18 h and 36 h to compare the migration capacity of each group of cells. Bioassays were replicated three times.
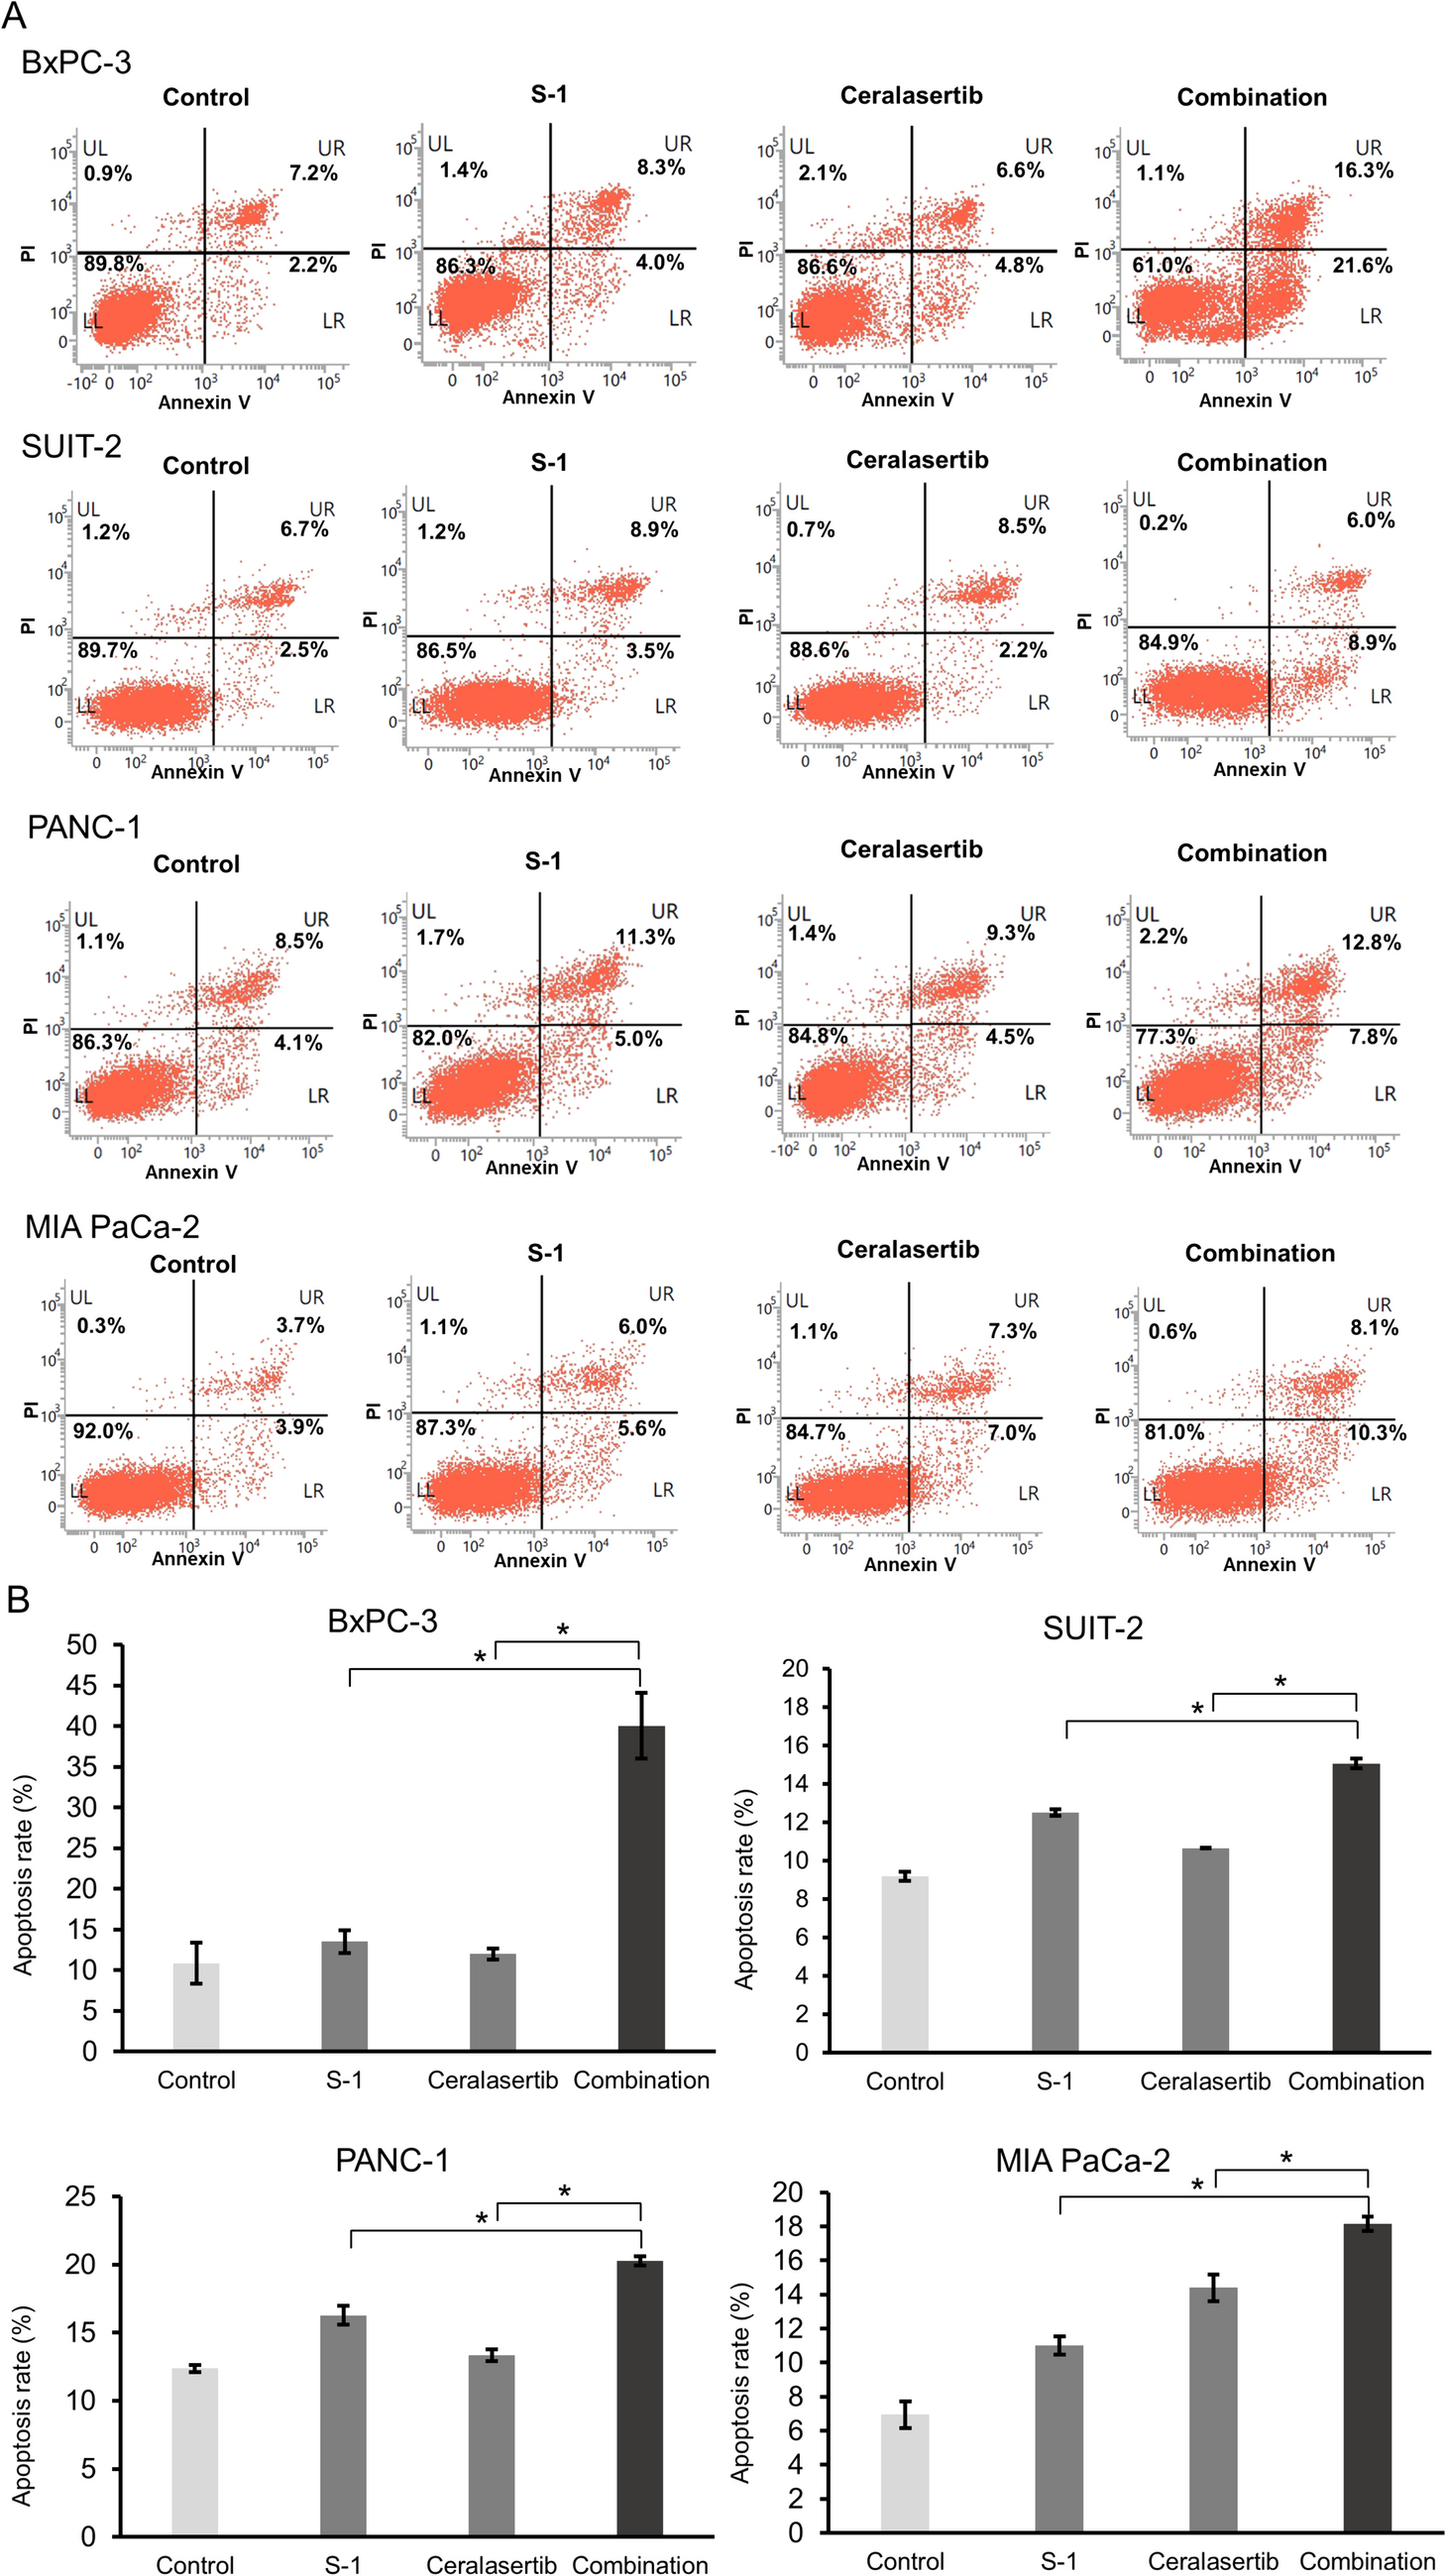
Flow cytometry assay
The cells were inoculated in six-well plates and treated with IC25 or IC50 drug concentrations of avermectin B1. After incubation for 48 h, the wells were digested with trypsin, and the cell suspension was centrifuged for 5 min at 1000 rpm for collection. Then, the cells were stained with Annexin V-FITC and propidium iodide according to the manufacturer’s guidelines. After staining, the cells were read on a flow cytometer (BD Biosciences, Franklin Lakes, NJ, USA). For the cell cycle assay, cells were treated as mentioned above, stained according to the manufacturer’s guidelines (Cell Cycle and Apoptosis Analysis Kit; Beyotime, China) and analyzed by flow cytometry.
Western blot
Cells were lysed in Tissue Protein Extraction Reagent (Thermo Fisher, Waltham, USA) with a cocktail of proteinase inhibitors and phosphatase inhibitors (Roche Applied Science, Indianapolis, USA) to extract the total intracellular proteins. The bicinchoninic acid (BCA) Protein Assay Kit (Thermo Fisher, Waltham, USA) was used to measure the protein concentration. Then, whole cell lysates were separated by 8%, 10% or 12% sodium dodecyl sulfate‒polyacrylamide gel electrophoresis (SDS‒PAGE) and transferred electrophoretically onto polyvinylidene difluoride (PVDF) blotting membranes. The blots were blocked with 5% skimmed milk for 1 h and then incubated with primary antibodies at 4 °C overnight, followed by different secondary antibodies for 1 h at room temperature. Finally. The bands were detected with an enhanced chemiluminescence (ECL) detection system using a multifunctional digital imager to obtain images.
mRFP-GFP-LC3 expressing cell generation and fluorescent LC3 puncta analysis
To perform image-based analysis for autophagy, cells were infected with the tandem GFP-RFP-LC3 adenovirus for 24 h according to the manufacturer’s instructions, then cells were treated and imaged for green fluorescent protein (GFP) and red fluorescent protein (RFP) by using Fluoview FV1000 microscope (Olympus, Tokyo, Japan).
Transmission electron microscopy (TEM)
Cells treated with avermectin B1 were fixed with 2.5% glutaraldehyde, dehydrated, and embedded, and ultrathin sections were prepared and stained with uranyl acetate and lead citrate. Electron micrographs of the ultrastructure of three osteosarcoma cells were taken using transmission electron microscopy. Three micrographs were captured at 6800x and 13000x magnification for each sample in a randomly selected area. The number of autophagic vacuoles (AVs) per unit area of each sample was counted and analyzed.
Xenograft mouse model
Female BALB/c nude mice (20 g, 8 weeks old) were used in vivo, and all animal experiments were performed according to the guidelines approved by the Shanghai Medical Experimental Animal Care Commission. Animals were assigned to experimental groups using simple randomization. MNNG cells (1 × 10⁶ cells/mouse) were injected subcutaneously into the right shoulder of the nude mice to establish a subcutaneous osteosarcoma graft model. The two groups of nude mice were injected intraperitoneally with 200 µL of 0.9% NaCl or 1 mg of avermectin B1 daily. The body weight and tumor volume of the mice were measured every three days. Thirty days after intraperitoneal injection, the mice were euthanized, and the tumor tissue was weighed and stored in 4% tissue fixative for further analysis. In addition, for the lung metastasis study, 2 × 10⁶ MNNG cells were injected into the tail vein of 16 mice according to the above grouping, and treatment was started 1 week later. The body weight of the mice was measured every three days. After 45 days, the mice were sacrificed, and the lung tissue was fixed in 4% tissue fixative. Immunohistochemical staining was performed on the fixed subcutaneous tumor tissue to observe the expression of the relevant proteins in the tumor tissue. The fixed lung tissue was paraffin embedded, sectioned, stained with hematoxylin-eosin (H&E) and immunohistochemically analyzed for histopathological evaluation. All mice were housed and monitored under SPF conditions.
Statistical analysis
Data were analyzed using SPSS (IBM SPSS Statistics 26.0) software. Student’s t test was used to compare the differences between the two groups. One-way ANOVA and post-hoc tests are used to analyze a series of three groups. A value of p < 0.05 was considered statistically significant. Graphs were generated using GraphPad Prism 8 software.


Comments (0)