Experimental animals and ethics statement
Pathogen-free inbred male Sprague–Dawley rats (220–250 g) were obtained from the Experimental Laboratory Animal Center of Guangxi Medical University (Nanning, China). The rats were housed at standard room temperature (21–22 °C) and humidity (60–65%). All animals were provided adequate access to food and water. All the experimental protocols and procedures were performed in compliance with the National Institutes of Health Guidelines on the Use of Laboratory Animals (NIH Publication No. 85–23, revised 1996) and were approved by the Institutional Animal Care and Use Committee (Application number: 201901010) of Guangxi Medical University (Nanning, China).
Rat model of MCT-induced PH and experimental groups
The PH rat model was established by a single intraperitoneal injection of MCT (60 mg/kg). MCT was sufficiently dissolved in 1 N HCl, 0.5 N NaOH was added to neutralize the solution to pH 7.4, and the solution was then diluted with distilled water. A total of 24 male rats were randomly assigned to four experimental groups (n = 6/group): (1) the saline + vehicle group (sham group), (2) the saline + XAV939 group (sham + XAV939 group), (3) the MCT + vehicle group (MCT group), and (4) the MCT + XAV939 group (MCT + XAV939 group). The dose of XAV939 (5 mg/kg/d) used in the study was based on a previous report [21]. After MCT administration, XAV939 in phosphate-buffered saline (PBS) was randomly injected intraperitoneally for 21 days.
Echocardiography
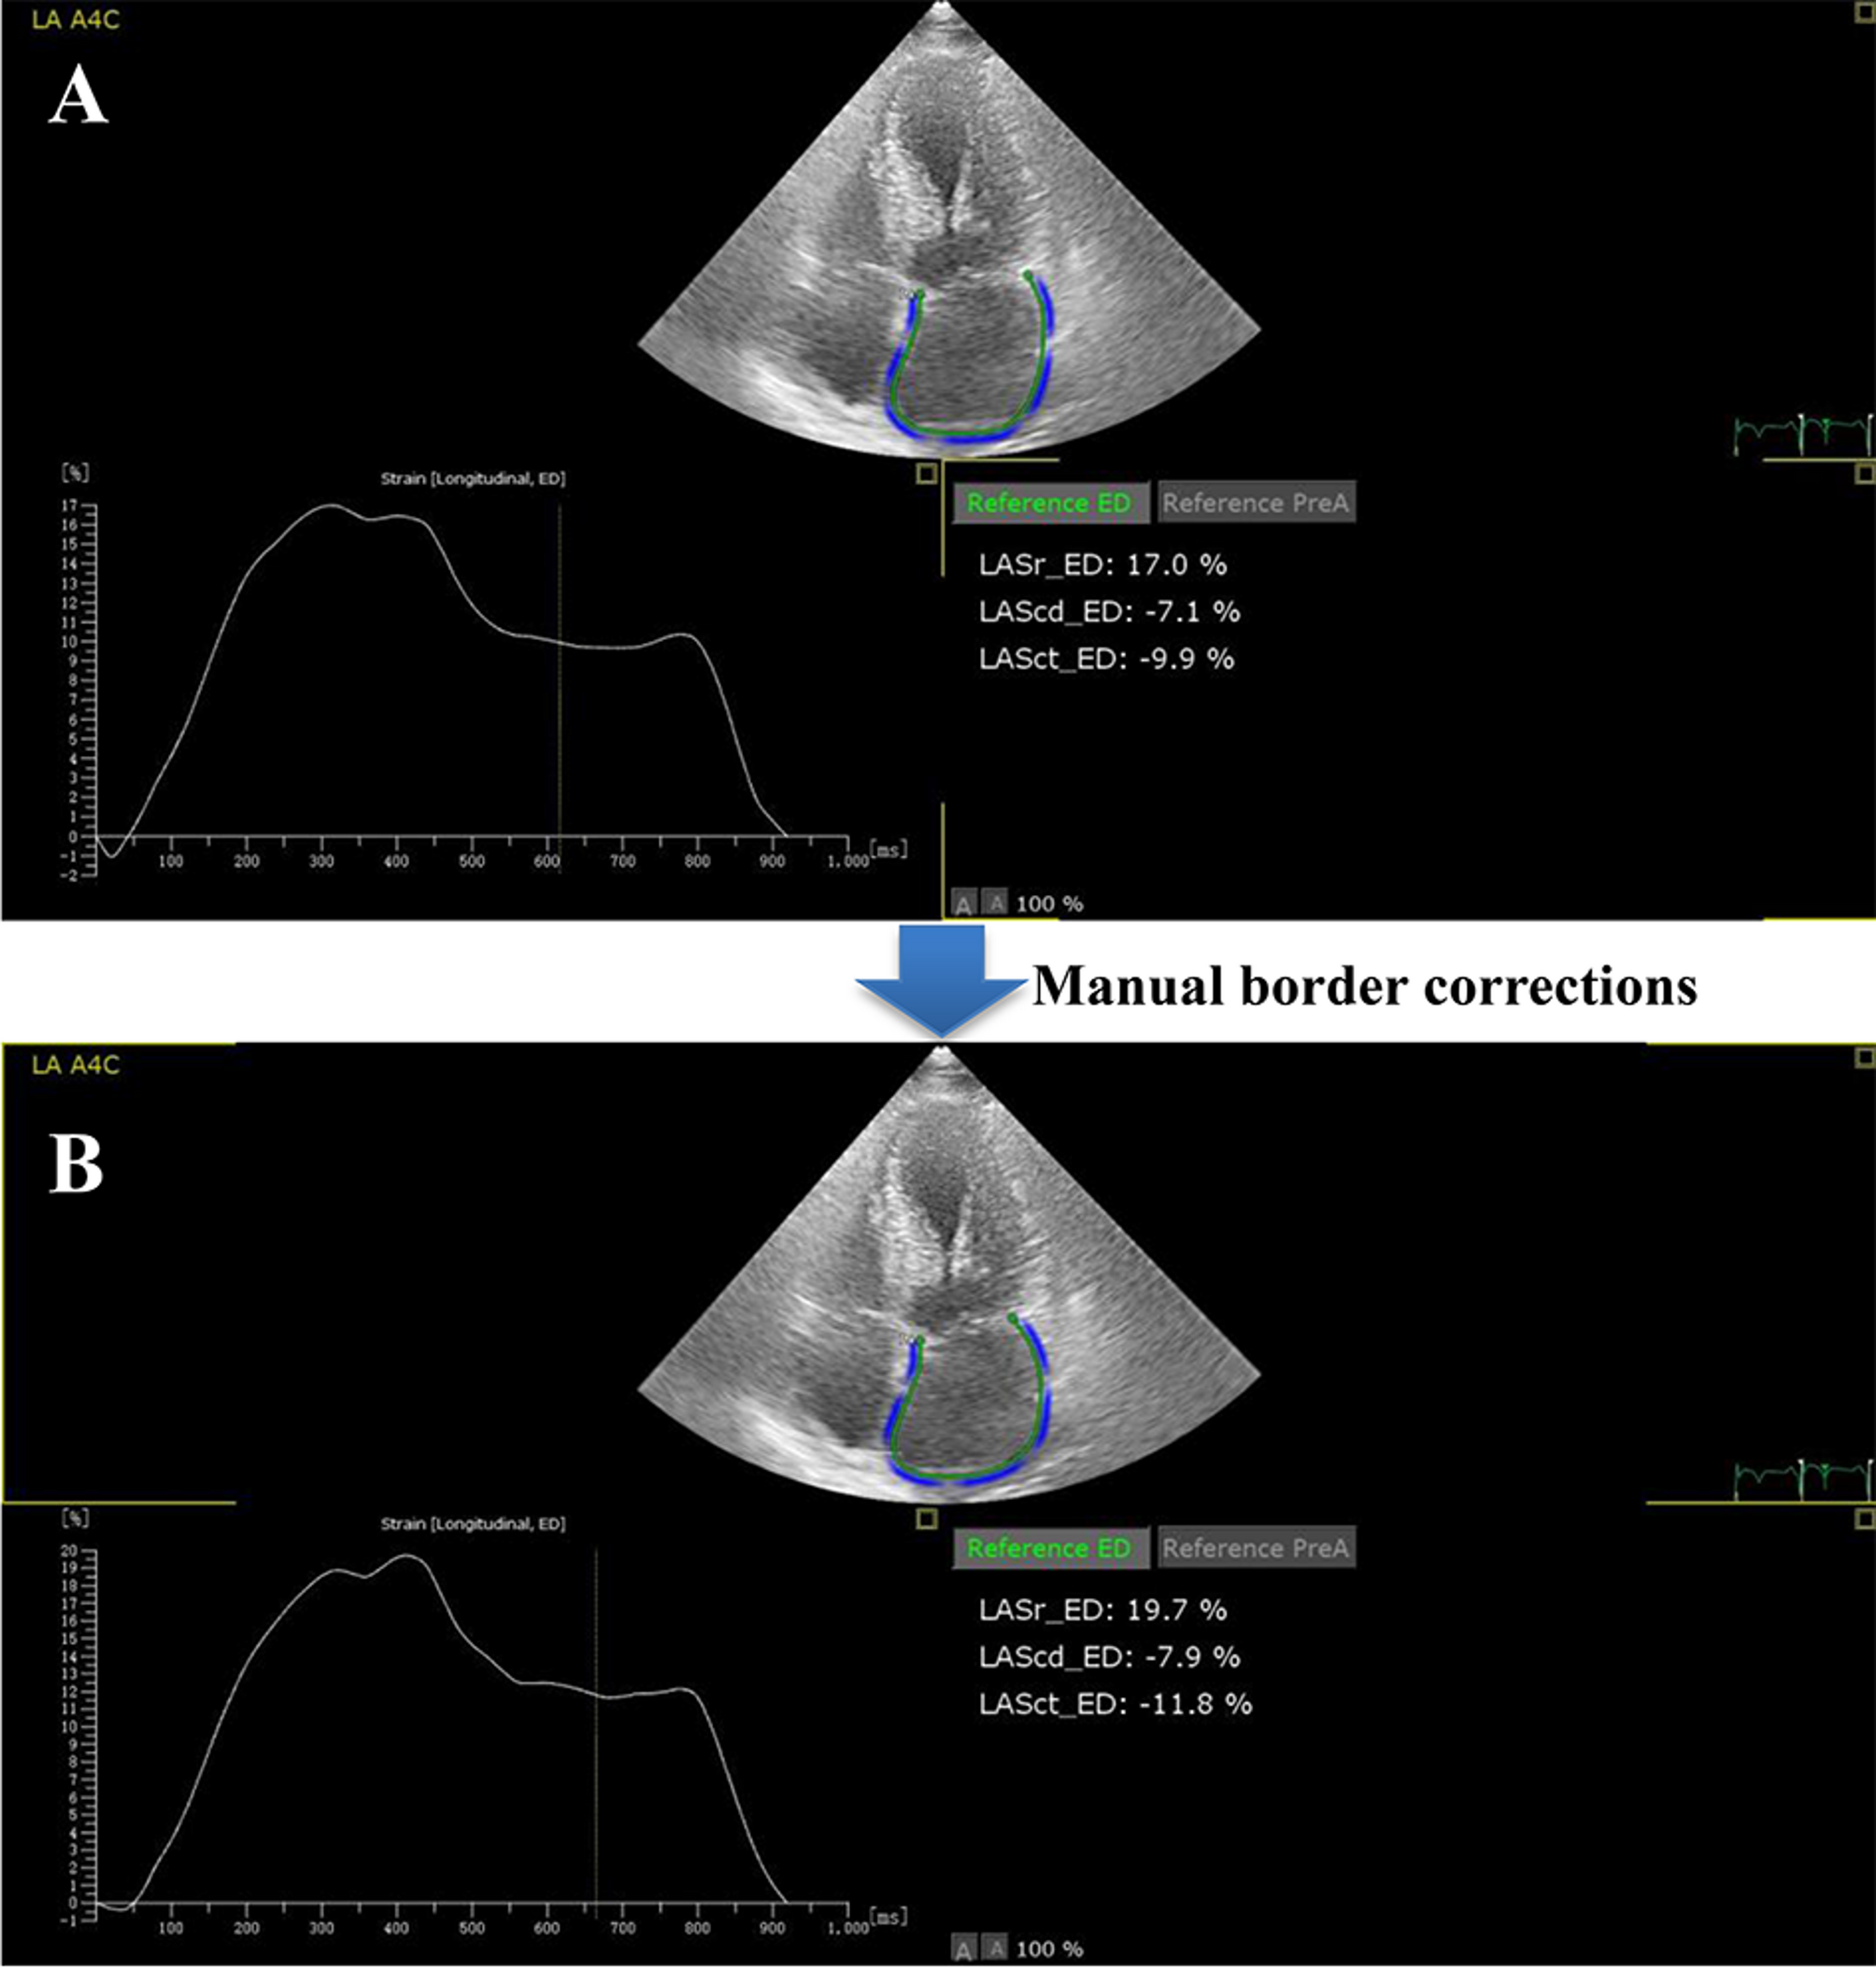
Twenty-eight days after MCT administration, echocardiography and haemodynamic evaluations were performed on all rats. The rats were anaesthetized with Nembutal. Echocardiography was performed using a Resona 7 system with an L20-5U transducer (Mindray M7, Shenzhen Mindray Biomedical Electronics Co. Ltd., China). The tricuspid annular plane systolic excursion (TAPSE), RV end diastolic dimension (RVEDD) and right ventricular ejection fraction (RVEF) were calculated by the following formulas: RVEF (%) = (RVEDV—RVESV)/RVEDV × 100%. The TAPSE was measured by M-mode echocardiography. The measurements were recorded from 10 consecutive beats and were used to normalize the beat-to-beat variations.
Haemodynamic measurements and tissue processing
The RVSP was measured by thoracotomy compression. Briefly, rats were anaesthetized and placed on a thermostatic heating pad at 37 °C, intubated and connected to a ventilator (tidal volume 5.0 ml, respiratory rate 80 breaths/min). The surgeon punctured the right heart immediately after opening the chest and then connected it to a pressure sensor. The data were collected by the cardiac pressure volume system ADV500 (Transonic, Beijing, China) through a computer. The animals were euthanized after the completion of RVSP data collection. Hearts from the rats were rapidly excised and weighed. The dry weights of the right ventricular (RV) free wall and the left ventricle plus septum (LV + S) were measured, and then the RV/LV + S ratio was calculated. Portions of the right ventricle and lung tissue from all experimental groups were fixed in 4% paraformaldehyde before being paraffin-embedded for histopathological examination. Some lungs were excised for ELISA, glycolysis-related index measurements and Western blotting (stored at -80 °C).
Histological analysis
Paraffin sections were made with lung tissue. First, the sections were stained with haematoxylin–eosin (HE). The medial wall thickness was determined in pulmonary arteries and arterioles with outer diameters of 50–100 μm. Occlusion was calculated by the following formula: (total area-lumen area)/total area × 100%. Then, the segments were incubated with α-smooth muscle actin (α-SMA, 1:150, BIOSS, Beijing, China) antibodies overnight at 4 °C, washed in PBS and incubated with HRP-labelled goat anti-mouse/rabbit IgG polymer for 30 min. After incubation with horseradish for 10 min and DAB staining for 3–5 min, the samples were completely rinsed with tap water, and haematoxylin and anti-blue were added, and the samples were dehydrated, clarified and sealed. Images were examined using an Olympus BX51 microscope. The thickness of the PA wall or smooth muscle layer was measured in cross-sectional images of the lung, and the remodelling of the pulmonary artery (PA) was quantified by morphometric analysis of distal small PAs (50–100 μm). Each lung slice had 10 random selections of eligible vessels. ImageJ software (NIH, Bethesda, MD) was used to measure the luminal area of arterioles.
Primary rat PASMC and pulmonary macrophage (PM) isolation
Rat PASMCs obtained from the medial smooth muscle layer of pulmonary arteries were isolated as described previously [22]. Briefly, rat pulmonary artery samples were cut longitudinally with ophthalmic scissors, and the inner and outer membranes were removed by gentle scraping 2 to 3 times with a blade and rinsing with PBS. The PA was cut into 1 mm3 pieces and placed in the bottom of a T-25 culture flask. The flask was incubated at 37 °C with 5% CO2 for 3–4 h, and then 3 mL of Dulbecco's modified eagle medium (DMEM) containing 20% foetal bovine serum(FBS) was added to the flask. After 5–7 days of culture, a small number of cells grew from the edge of the tissue block. Once the cells reached approximately 70% confluence, PASMCs with good growth were harvested from the second through sixth passages and used for subsequent experiments. Anti-α-SMA immunohistochemical staining was used to identify PASMCs.
Primary rat PMs were collected by bronchoalveolar lavage as described previously [23]. Briefly, the lungs of rats were harvested for multiple lavages with PBS, and the rat alveolar lavage fluid was recovered. After centrifugation (1000 rpm for 5 min), the red blood cells were removed, and the cells were lysed for 5 min. Subsequently, the PMs were isolated and cultured in Iscove's modified Dulbecco's medium (IMDM) supplemented with 20% FBS. Anti-CD68 immunohistochemical staining was used to identify PMs 3 days later.
Bone marrow-derived macrophage (BMDM) isolation and culture
As previously described, rats weighing between 150–180 g were anaesthetized via intraperitoneal injection of 3% Nembutal. The entire femur was rapidly excised under aseptic conditions, and the adherent periosteum and muscle tissues were meticulously removed before transferring the bone to a sterile ultraclean workstation. The femur was then cleansed with PBS supplemented with 1% penicillin–streptomycin, after which both metaphyseal ends were amputated. The bone marrow cavity was subsequently flushed alternately with IMDM from each end, and the resulting rinse fluid was collected. After filtration through a 70 µm cell sieve, the suspension was centrifuged at 1000 rpm for 10 min. The supernatant was discarded, and an appropriate volume of red blood cell lysis buffer was added to the pellet. The cells were resuspended and allowed to stand for 5–10 min before undergoing a second centrifugation. Again, the supernatant was discarded.
For routine culture, the cells were resuspended in complete IMDM containing 10% FBS, 100 U/mL penicillin, 100 µg/mL streptomycin, and 20 ng/mL macrophage colony-stimulating factor (M-CSF). The culture medium was refreshed every three days. The macrophages were induced to mature on days 6 to 7, after which they were utilized for subsequent experimental procedures.
Cell treatments
On the 6th day of BMDM culture, interventions were conducted. The β-catenin agonist lithium chloride (LiCl) and the selective glycolytic activator d-fructose 1,6-bisphosphate trisodium salt octahydrate (FBP) served as negative controls for the in vitro therapeutic efficacy of XAV939. The BMDMs were divided into five groups: the control group (diluent), LPS group, LPS + XAV939 (10 mM, Selleck, USA) group, LPS + LiCl (10 mM, Selleck, USA) group, and LPS + XAV939 + FBP (4 mM, Alladin, Shanghai, China) group. After the cells were pretreated with XAV939 and LiCl for 48 h, the cells were stimulated with LPS (100 ng/ml) for 6 h. In the LPS+XAV939+FBP group, FBP was added 24h before lsp treatment. After treatment, the BMDMs were collected for Western blot analysis, and the supernatants were collected for ELISA. To study the effect of inflammatory cytokines secreted by BMDMs on PASMCs, the supernatants from these BMDM cultures were used to treat PASMCs for 24 h. Subsequently, CCK-8, scratch, EdU, and Transwell assays were performed on PASMCs to assess the effects of the supernatants on PASMC proliferation, migration, and invasion.
Second, to verify that glycolysis in macrophages promotes the activation of the NLRP3 inflammasome, we used 2-deoxy-D-glucose (2-DG, a competitive inhibitor of glucose metabolism) and FBP. The BMDMs were divided into a control group (diluent), an LPS group, an LPS + 2-DG (4 mM, MCE) group, an LPS + FBP (4 mM, Alladin, Shanghai, China) group. Following a 6-h administration of LPS (100 ng/ml), 2-DG and FBP were administered.
Cell Counting Kit-8 (CCK-8) assay
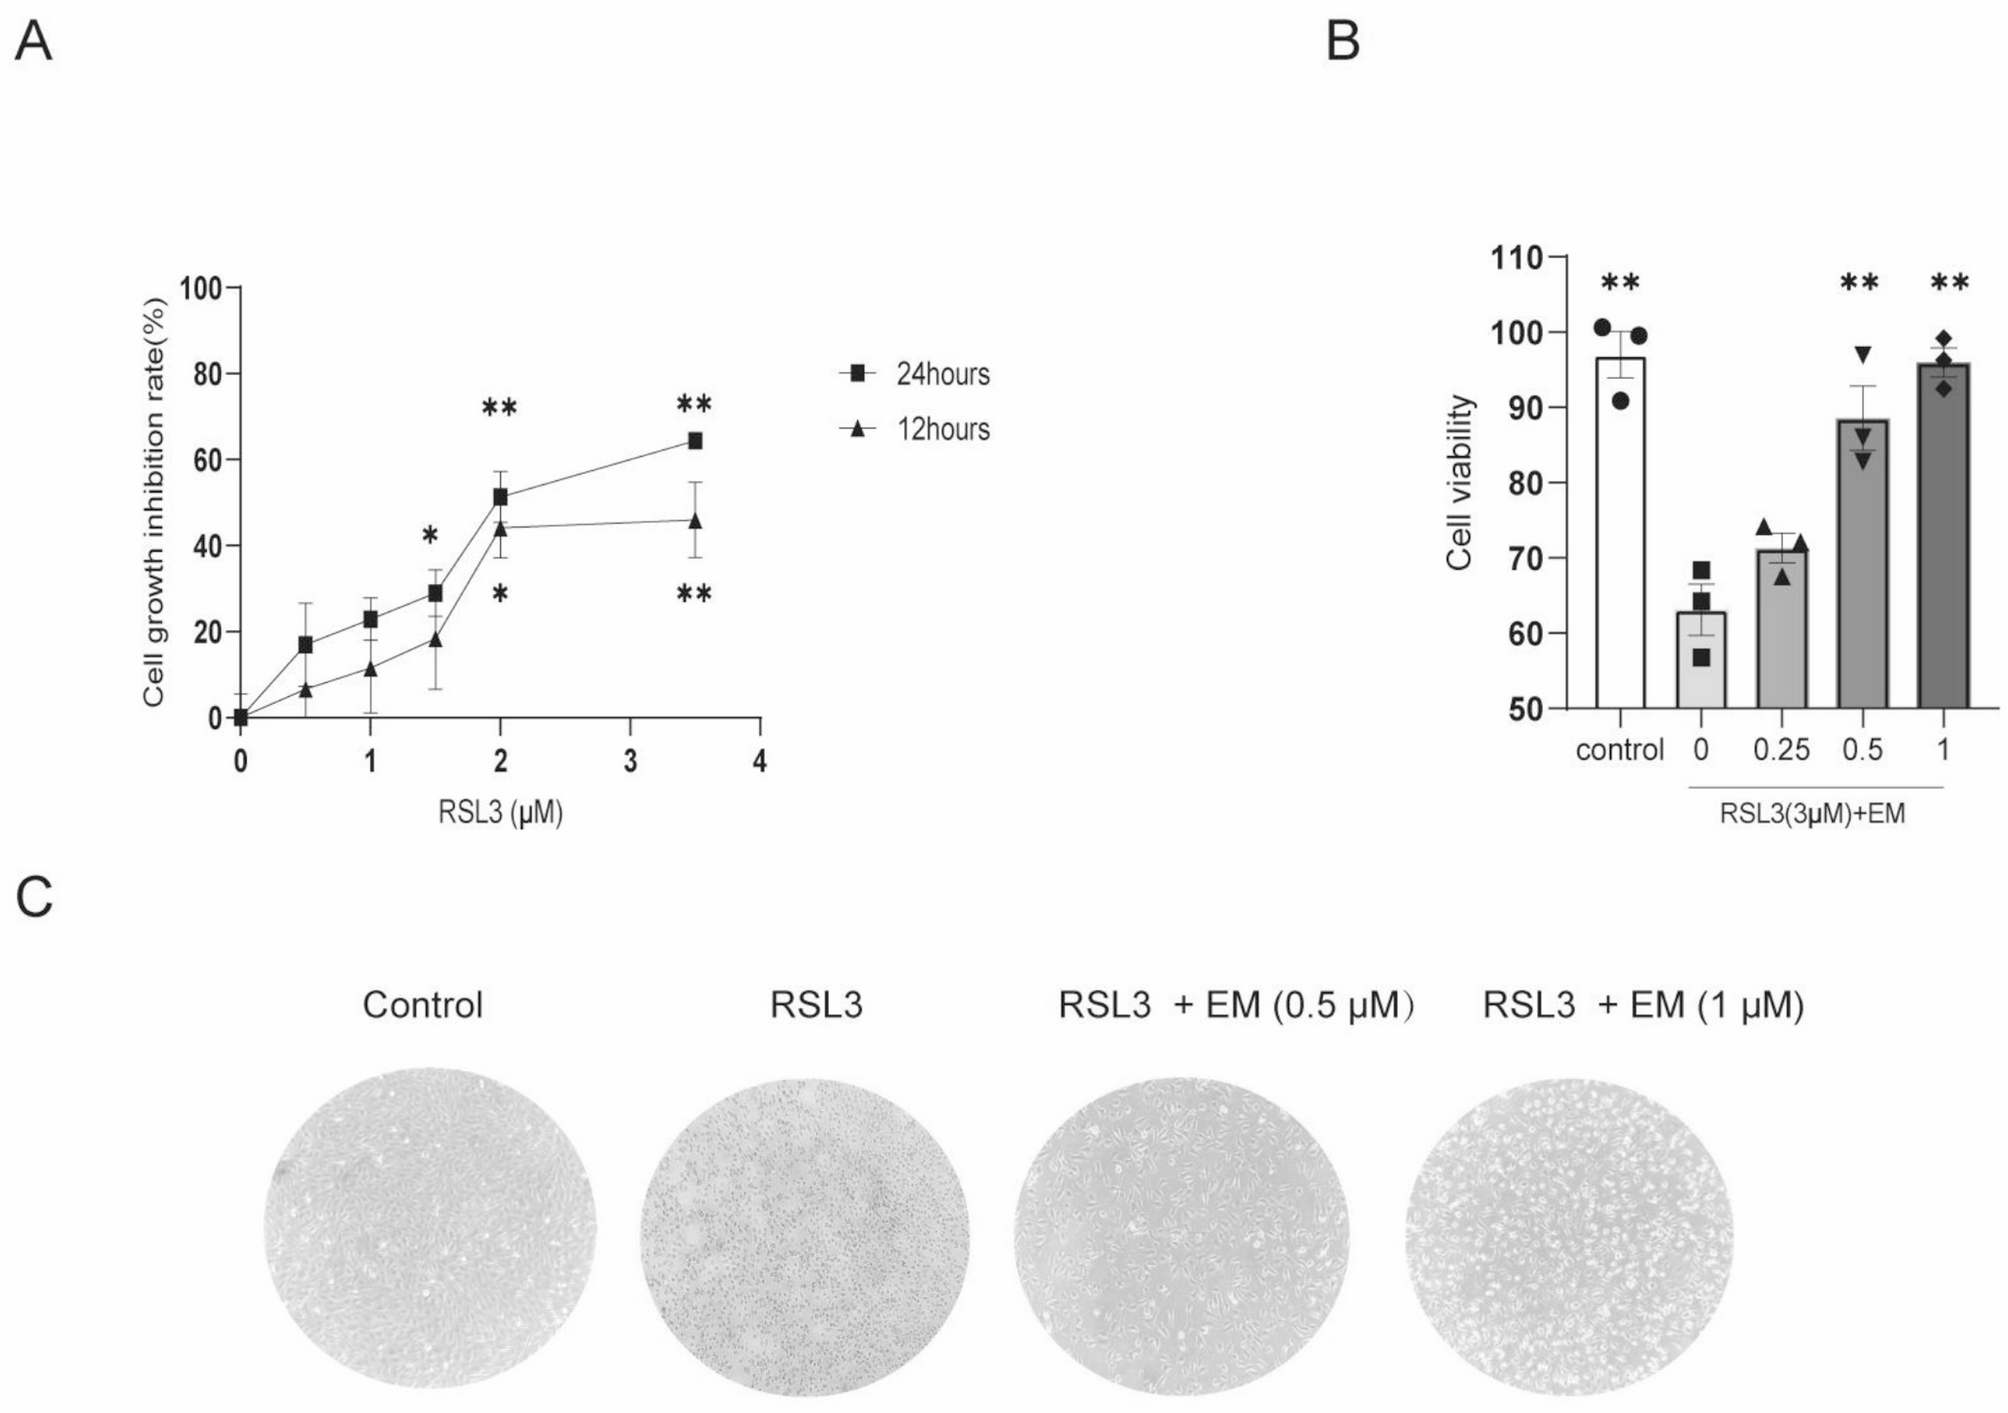
A CCK-8 assay kit (Dojindo Laboratory, Kumamoto, Japan) was used to determine PASMC viability according to the manufacturer’s instructions. Briefly, cells were plated at a density of 2.0 × 10³ cells/well in 96-well plates. After the corresponding treatment, cell proliferation was assessed with a CCK-8 kit according to the manufacturer’s instructions. The number of cells was determined relative to that of the control cells in triplicate experiments.
PFK and LDH activities and content of glucose and LA determination
PFK and LDH activities and glucose and LA levels were determined by commercially available colorimetric assay kits (Solarbio, Beijing, China) according to the manufacturer's instructions.
ELISA
Cell culture supernatants and rat lung tissue homogenates were analysed after centrifugation. The levels of TNF-α, IL-6, IL-1β and IL-18 were measured using commercially available ELISA kits (Jiang Lai creatures, Shanghai, China) according to the manufacturer’s instructions.
Western blot analysis
Tissue and cellular proteins were extracted using RIPA lysis buffer (Solarbio, Beijing, China) supplemented with protease and phosphatase inhibitors (Beyotime, Shanghai, China). The concentrations of the extracted proteins were measured using a BCA Protein Assay Kit (Beyotime, Shanghai, China). Equal amounts of protein were separated by 10% SDS–polyacrylamide gel electrophoresis and transferred onto nitrocellulose membranes. The membranes were probed with antibodies against β-catenin (1:1000, Proteintech, Wuhan, China), HK2, PKM2 (1:4000, Proteintech, Wuhan, China), ASC, pro-caspase-1, caspase-1, NLRP3 (1:1000; all Cell Signaling Technology, USA), β-actin (1:2500, Proteintech, Wuhan, China). After blocking with 5% (w/v) dry milk for 1 h, antibodies were added and incubated overnight at 4 °C. After the membranes were washed, they were incubated with horseradish peroxidase-conjugated secondary antibodies (1:5000; ZSGB-Bio, Beijing, China) for 2 h. PVDF was immersed in sensitized ECL and then exposed to X-rays via a gel imaging system (UVP, Upland, CA) to develop the protein bands. ImageJ software (National Institutes of Health, Bethesda, MD) was used to quantify the density of the bands, which were normalized to β-actin levels.
5-Ethynyl-2'-deoxyuridine (EdU) cell proliferation assay
PASMCs were cocultured with BMDM supernatants from each group for 24 h. PASMC proliferation was detected by an EdU incorporation assay. PASMCs were stained with the BeyoClick™ EdU Apollo488 In Vitro Imaging Kit (Beyotime, Shanghai, China) according to the manufacturer’s instructions. Nuclei were stained with Hoechst.
Cell migration
Cell migration was determined by a scratch wound assay and transwell assay. For the wound assay, PASMCs were cultured in six-well plates in starvation medium and wounded with a sterile pipette tip to generate a cell-free gap of 1 mm width, and the wound location in the culture dish was marked as previously described. The cells were photographed to record the wound width at 0 h. Afterwards, the cells were treated as previously described. Twenty-four hours later, photographs were taken again at the marked wound location for migration measurement. For the transwell assay, PASMCs (1 × 10⁵) were seeded into the upper chamber at 8 μm/well (1 × 10⁵ cells/well) in serum-free medium. Then, BMDM supernatants from each group were inoculated into the lower chamber. The cells were cultured at 37 °C and 5% CO2 for 24 h. The migrated cells were fixed with 4% paraformaldehyde at room temperature for 30 min and stained with crystal violet dye (Biyuntian, Shanghai, China) for 20 min. Images were captured for quantification.
Statistical analysis
GraphPad 9.0 software was used for all the statistical analyses and bar chart production. The data are expressed as the mean ± standard deviation (SD). Comparisons between two groups (with a normal distribution) were performed by unpaired Student’s t tests. One-way analysis of variance (ANOVA), followed by the Newman–Keuls multiple comparison test for normally distributed data, was used for comparisons among multiple groups. Statistical significance was characterized as ns P ≥ 0.05, *P < 0.05, **P < 0.01, ***P < 0.001, and ****P < 0.0001 (two-tailed).


Comments (0)