Quantifying radioactivity concentrations in small animal organs or tumors is standard in preclinical imaging and relies on parameters such as the SUVmean or SUVmax. However, the variability and reproducibility of these parameters among different observers within a single institution or across multiple centers remain poorly understood. Currently, each imaging lab and often each observer within the same institution applies different workflows, experiences, and judgments to analyze and segment PET images. These variations encompass factors such as the position, size, and shape of VOIs; PET image display settings; and postprocessing methods, potentially compromising comparability across observers and centers. Despite the prevalence of preclinical [18F]FDG-PET/CT studies, no multicenter consensus exists on a reproducible image analysis method. This study represents the first comprehensive multicenter [18F]FDG-PET/(CT) investigation into the impact of image analysis methods on results and the comparability of a standardized analysis approach. Our findings underscore the significant influence of image analysis methods on [18F]FDG-PET/(CT) study outcomes, particularly regarding SUVmean discrepancies attributed to regional position and size, corroborating similar observations from prior studies [15].
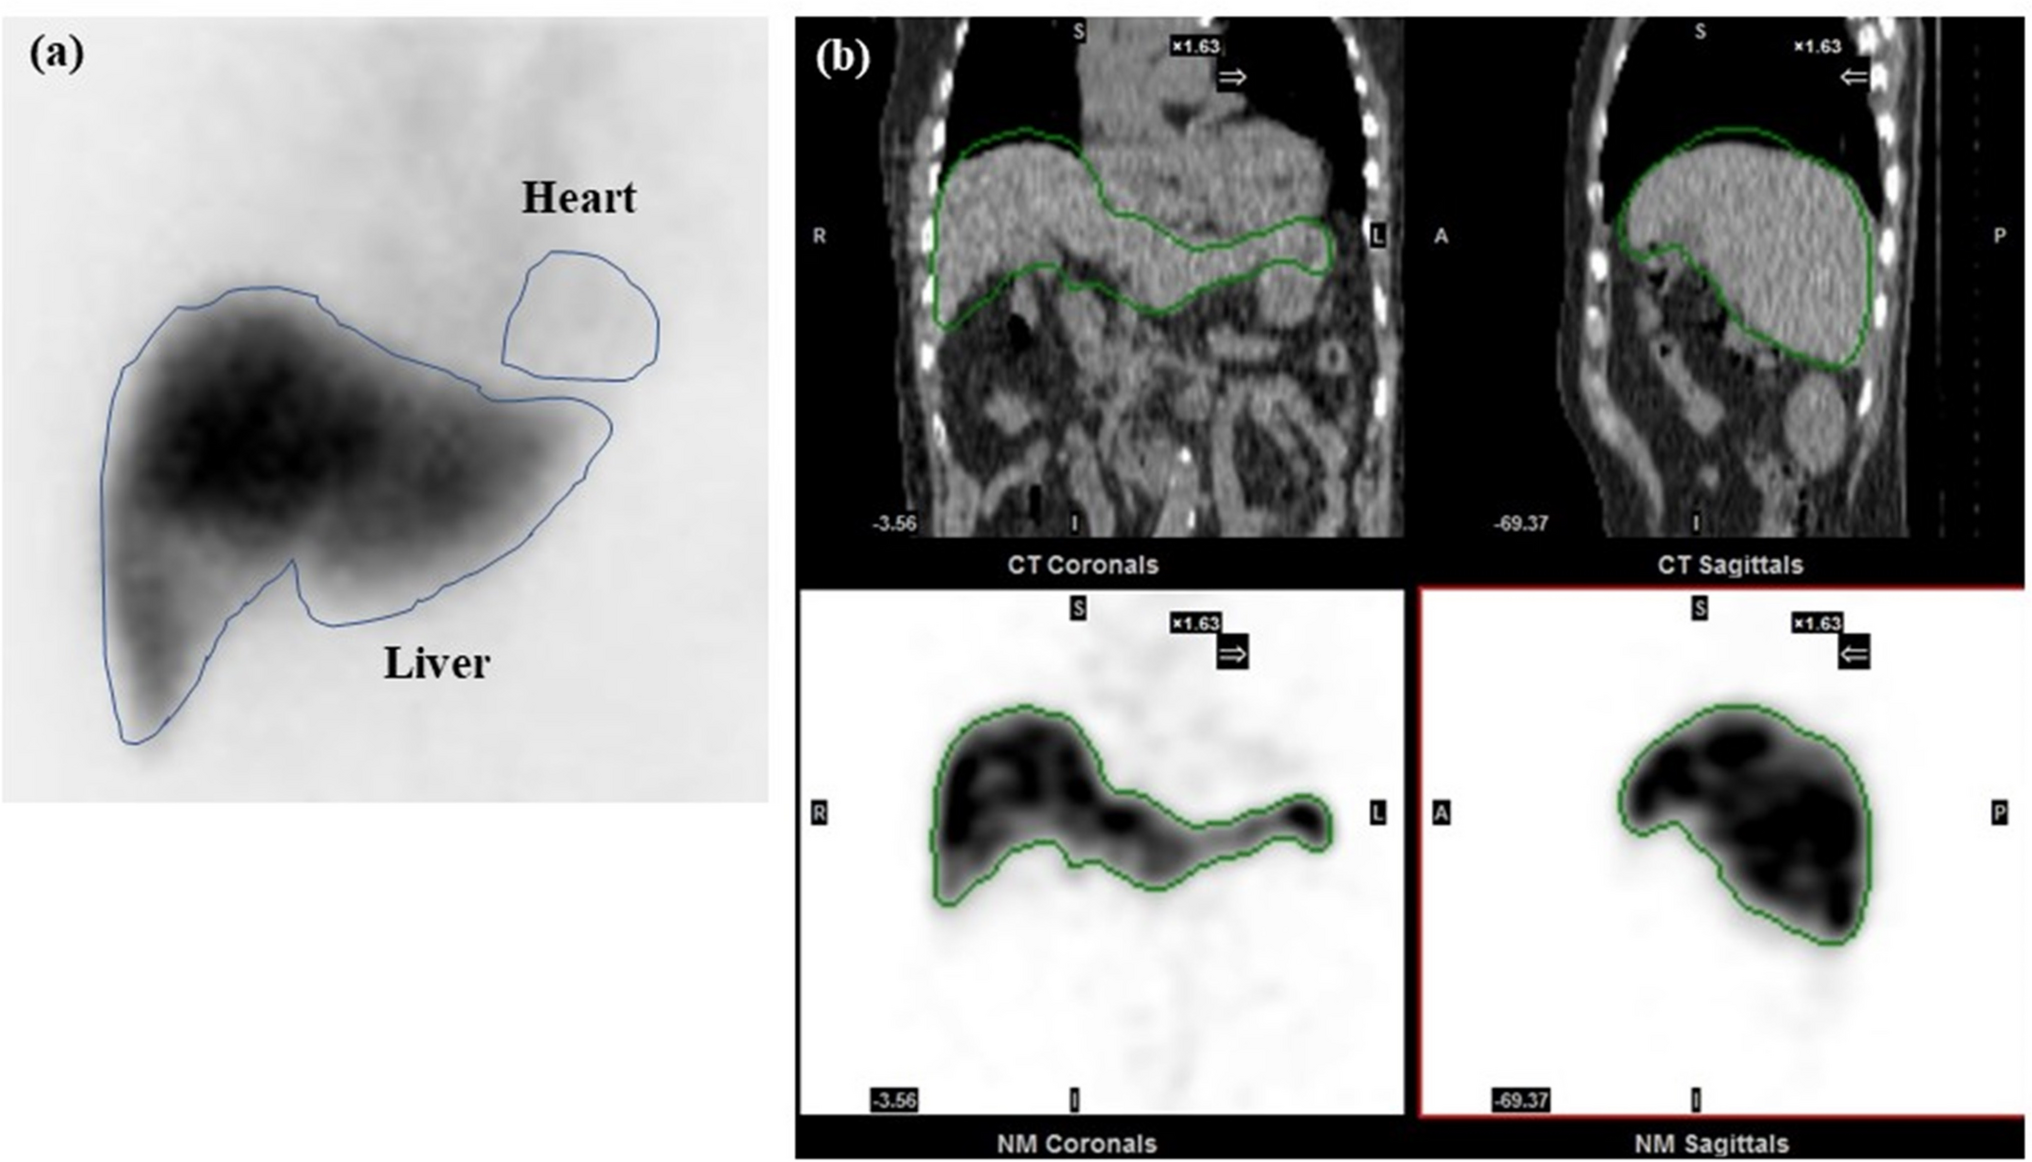
Our first observation was that not all observers performed post-processing to re-orient the images according to the “standard” configuration in preclinical imaging (head first, prone). Some analyzed the images in the orientation provided by the scanner, which was for the PET/CT study in feet first, prone. Thus, an agreement on the orientation of images to be used (also with regard to future automatic segmentation applications) is therefore the first step towards standardized image analysis. Without standardization, variations in VOI sizes were observed between beginners and experts for multiple organs. These differences influenced SUVmean (e.g., heart) and SUVmax (e.g., liver in PET/CT) analyses, suggesting that VOI size impacts uptake. However, for certain organs (e.g., the liver in PET-only and the brain in PET/CT), despite significant differences in VOI size, SUV analysis was unaffected by homogeneous [18F]FDG uptake.
Introducing anatomical references in part 2 reduced variability in heart and muscle regions but had no effect on liver or brain regions. However, overall reliability and comparability did not improve universally. Comparing parts 1 and 2 is challenging due to the different image sets analyzed. However, this design showcases variability between studies (e.g., small vs. large tumors with necrotic areas), mitigating potential biases from part 1 to part 2.
Based on the results from these two studies, the participants in this study reached a consensus on the standardized VOI delineation method utilized in part 3.
Standardization improved the consistency and shape of SUVmean TACs in the liver, brain, and kidney, while nearly identical SUVmax TACs were obtained in the liver, heart, tumor, brain, kidneys, and urinary bladder. Reduced interobserver variability poststandardization was evidenced by reduced deviation and improved ICCs across organs, except for muscle and urinary bladder regions. Muscle VOIs are small and prone to spill over from adjacent bone regions, making muscle-fat differentiation challenging despite the use of anatomical information from CT scans. Intensive training and visual aids are recommended for comparability improvement. For maximum-fill bladder VOIs, inconsistent time frame choices hindered comparisons between parts 2 and 3. Nevertheless, considering its importance in dosimetric studies, assessing bladder necessity and employing frame-by-frame analysis for volumetric changes are advised.
Furthermore, the significant differences between beginners and experts found by the normalized difference analysis in the heart, kidneys, and tumor diminished after standardization (Fig. 3(b) and 3(c)). We concluded that the use of a standardized approach reduced the interobserver variability in the SUV analysis. In addition, we propose to create a VOI template for each preclinical PET/CT and PET/MR study that includes a standardized VOI positioning and size as well as detailed information on the segmentation method. For multicenter studies, we recommend reaching a consensus on the use of single analysis software for evaluating and providing VOI template files. For single-center studies, a VOI template from the first animal analyzed will ensure reproducibility for the remaining animals and help train new personnel.
In general, the SUVmax revealed a lower interobserver variability than the SUVmean in our study. However, as the SUVmax represents only a single voxel within a region, the SUVmean might be a more stable marker for underlying tissue uptake. Therefore, both measures can be valuable in multicenter studies.
Despite its strengths, our study has several limitations. First, mid-level observers were not included, potentially biasing the results, as experience levels were subjectively categorized as beginners or experts. Additionally, the varied backgrounds of the participating observers (e.g., physics, chemistry, biology, etc.) may have influenced interpretation. Secondly, validation using gamma-counter data was not available. Third, the use of different image analysis software led to the use of various segmentation tools, hindering detailed discrepancy identification within segmented VOIs. Finally, the standardized protocol lacked optimization, notably omitting a VOI template for precise location visualization. Addressing these limitations in future studies could enhance the accuracy and reproducibility of the findings.
It has to be noted that depending on the specific tracer used, standardized image analysis protocols need to be re-defined to address tracer-specific factors that might impact the reproducibility of image analysis. This also applies for the acquisition of the imaging data, for which standardized protocols – depending on the used tracer – can also significantly enhance reproducibility [16].
The 12 observers in this study represent 8 different preclinical imaging facilities in Europe and all observers were asked to use their default image analysis method and software tool to analyze the provided PET(/CT) data. Only 1 observer analyzed the data using an automated segmentation tool. Automatic organ segmentation has been an active field of research for decades [17,18,19,20,21,22], and current research in this field includes the development of artificial intelligence (AI)-assisted solutions [23]. Nevertheless, manual delineation will still be the standard method for image analysis until these tools are applicable to a broader community with sufficient training databases and a variety of VOI templates. The variety of chosen software tools and methods utilized in this study encompasses, in our opinion, the most used methods in image analysis in preclinical PET imaging. However, the transition to AI-guided automatic segmentation will certainly be a strong focus within the next decade and thus will potentially improve the comparability and reliability of preclinical multicenter image analysis.

Comments (0)