
Remember me


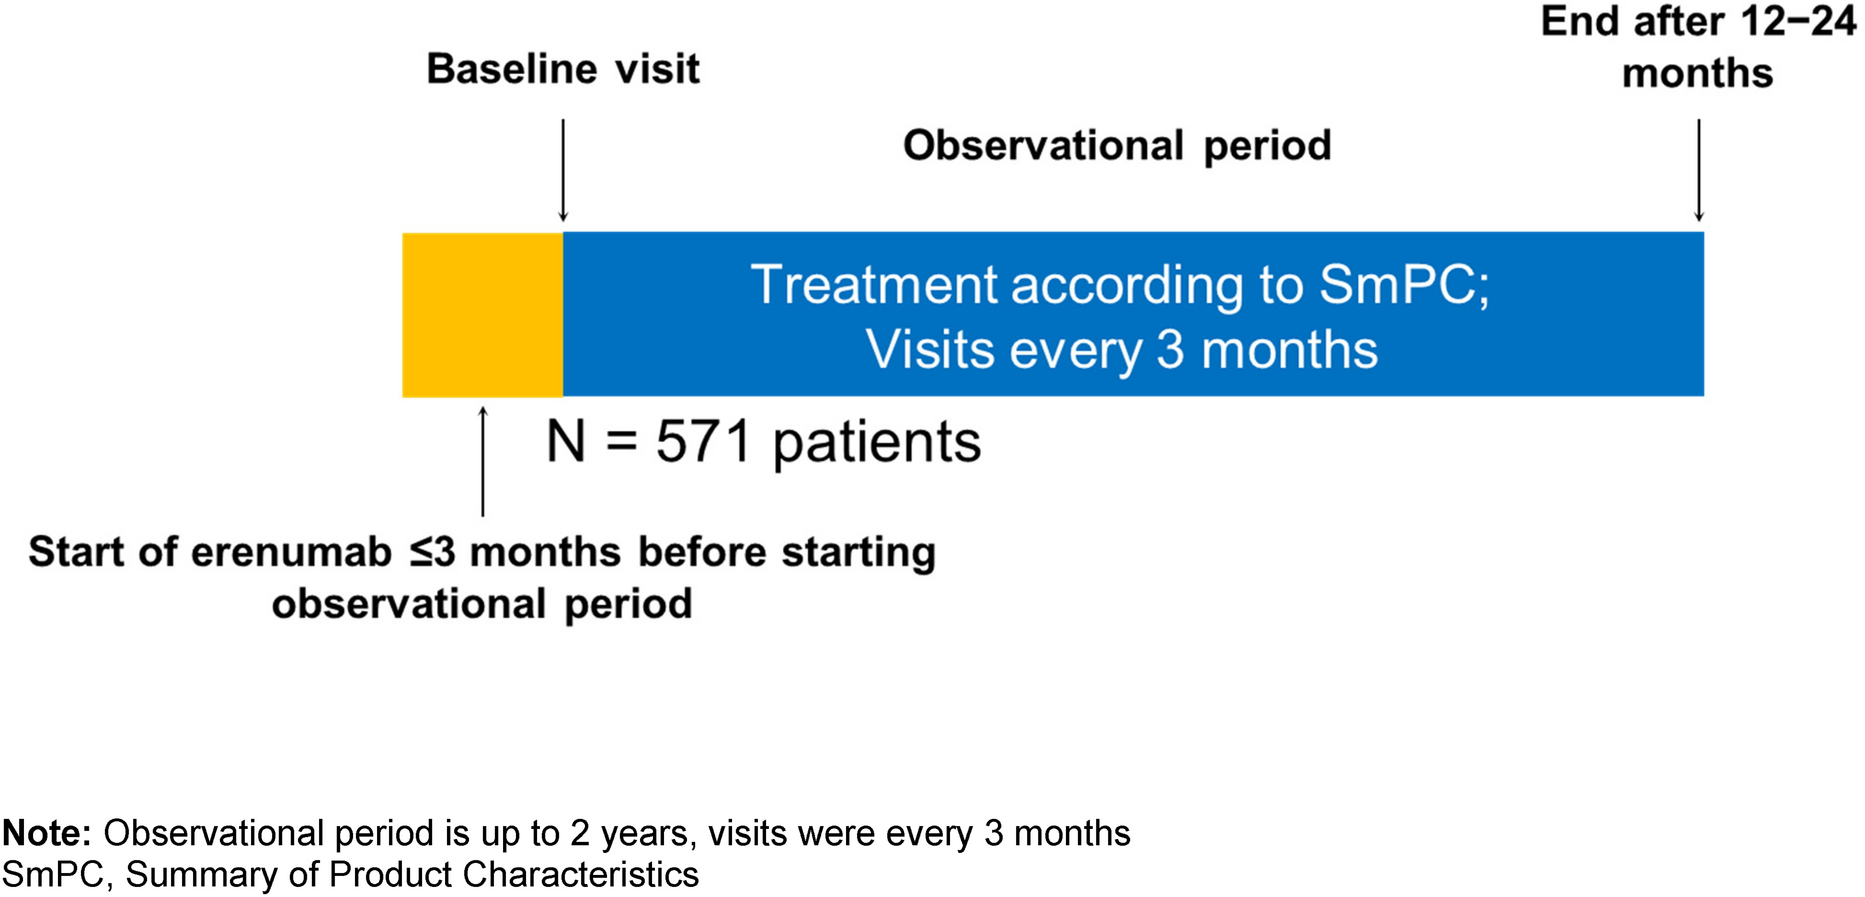
During the period from July 2019 to February 2023, a total of 148 new SCS patients at 13 centers were permanently implanted with the CL-SCS system based on the standard inclusion criteria for neuromodulation. The patients selected for the Evoke system represent the first use of this system worldwide following European marketing authorization.
The COVID-19 pandemic led to significant restrictions in the usual follow-up examinations (standard of care); 45 patients were unable to participate in the 3-month examination, 57 patients were unable to participate in the 6-month examination, and 63 patients were unable to participate in the 12-month examination. If a follow-up examination was not performed or the patient results were not recorded due to time constraints, this was not considered a protocol deviation. No assumptions were made about missing data.
Baseline characteristics and demographics for all patients are presented in Table 1. A total of 121 patients had a diagnosis of chronic intractable neuropathic pain in the trunk and/or limbs due to persistent spinal pain syndrome after surgery (PSPS) type 2 [23]. Ten patients had a diagnosis of chronic intractable neuropathic pain of the trunk and/or limbs due to complex regional pain syndrome (CRPS). Seventeen patients had another diagnosis, including polyneuropathy, mononeuropathy, post-amputation pain, peripheral plexopathy, and nonsurgical back pain, among others.
Table 1 Patients, demographics, and baseline characteristicsDifference in sex: There were a greater number of female patients (n = 86) than male patients (n = 62) permanently implanted.
The number of patients in the different conditions included in the final analyses of the experimental outcomes is shown in Table 2. The three distinct conditions scrutinized encompass all patients, stimulation-naïve patients, and conversion patients. Stimulation-naïve patients include all individuals except those who had previously undergone implantation with an SCS device, whereas conversion patients are defined as individuals who had previously received treatment with at least one alternative SCS or dorsal root ganglion stimulator.
Table 2 Number of patients in different conditions included in the final analysis of the experimental outcomesPain Relief Outcomes: All PatientsMean (± SEM) baseline (n = 148) overall pain scores (VNRS) were 8.2 ± 0.1. At 3 months (n = 103), average VNRS overall pain scores decreased to 2.6 ± 0.2, at 6 months (n = 91) to 2.7 ± 0.3, and at 12 months (n = 85) to 2.6 ± 0.2 (Fig. 1A). Analysis using the Kruskal–Wallis test revealed a significant change throughout all visits (Kruskal–Wallis test: H = 258.0, p < 0.0001, n = 427). Post hoc analyses (Dunn’s multiple comparisons test) demonstrated a significant improvement at all time points compared to baseline (baseline to 3 months: p < 0.0001; baseline to 6 months: p < 0.0001; baseline to 12 months: p < 0.0001). In addition, a twofold clinically meaningful change (minimum clinically important difference [MCID]; 2.0 [13]) at all follow-ups could be observed.
Fig. 1
Patient-reported outcomes. A Mean (± SEM) baseline (n = 148) pain scores (VNRS) were 8.2 ± 0.1. After 12 months (n = 85), scores decreased to 2.6 ± 0.2. B Responder and high-responder rates. Vertical axis indicates responder/high-responder rates in %. Patients who showed exceptional pain relief were defined as high-responders (≥ 80.0%) and patients who responded with ≥ 50.0% pain relief were defined as responders. At 12 months, 76% of patients were responders and 41% high-responders. C Individual patient percentage change from baseline in overall pain scores at 12 months
Patients who showed exceptional pain relief were defined as high-responders (≥ 80.0%) and patients who responded with ≥ 50.0% pain relief were defined as responders. At 3 months the responder rate was 77% (n = 79 out of 103 patients), (≥ 50.0% pain relief), and the high-responder rate was 40% (n = 41 out of 103 patients), (≥ 80.0% pain relief). At 6 months, 81% (n = 74 out of 91 patients) of patients were responders, and 39% (n = 35 out of 91) of patients were high-responders. At 12 months, 77% (n = 65 out of 85) of patients were responders, and 41% (n = 35 out of 85) of patients were high-responders.
Sub-analysis of CRPS patients showed that mean (± SEM) baseline (n = 10) overall pain scores (VNRS) were 8.3 ± 0.4. At 3 months (n = 7), average VNRS overall pain scores decreased to 2.9 ± 1.3, at 6 months (n = 7) to 1.3 ± 0.5, and at 12 months (n = 7) to 2.3 ± 1.0.
Sub-analysis of PSPS patients showed that mean (± SEM) baseline (n = 121) overall pain scores (VNRS) were 8.2 ± 0.1. At 3 months (n = 88), average VNRS overall pain scores decreased to 2.4 ± 0.2, at 6 months (n = 75) to 2.8 ± 0.3, and at 12 months (n = 73) to 2.6 ± 0.3.
Pain Relief Outcomes: Stimulation-Naïve PatientsA sub-analysis was performed for stimulation-naïve patients (stimulation-naïve patients include all individuals except those who had previously undergone implantation with an SCS device; Table 2) for better comparison to the patient populations of the AVALON and EVOKE studies. Mean (± SEM) baseline (n = 135) overall pain scores (VNRS) were 8.2 ± 0.1. At 3 months (n = 93), average VNRS overall pain scores decreased to 2.3 ± 0.2, at 6 months (n = 82) to 2.5 ± 0.3, and at 12 months (n = 76) to 2.5 ± 0.3. Analysis using the Kruskal–Wallis test revealed a significant change throughout all visits (Kruskal–Wallis test: H = 244.4, p < 0.0001, n = 386). Post hoc analyses (Dunn’s multiple comparisons test) demonstrated a significant improvement at all time points compared to baseline (baseline to 3 months: p < 0.0001; baseline to 6 months: p < 0.0001; baseline to 12 months: p < 0.0001). In addition, a twofold clinically meaningful change (minimum clinically important difference [MCID]; 2.0 [13]) was observed at all follow-ups.
At 3 months, 81% (n = 75 out of 93 patients) were responders (≥ 50.0% pain relief) and 43% (n = 40 out of 93 patients) were high-responders (≥ 80.0% pain relief). At 6 months, 84% (n = 69 out of 82 patients) of patients were responders and 45% (n = 34 out of 82) of patients were high-responders. At 12 months, 80% (n = 61 out of 76) of patients were responders, and 45% (n = 34 out of 76) of patients were high-responders.
Percentage pain relief observed at 3 months and 12 months in this real-world cohort was 71% (n = 93) and 70% (n = 85), respectively. These outcomes were consistent with those reported for both the AVALON study [71% (n = 45); 74% (n = 43) pain relief at 3 and 12 months, respectively, post-implantation] and the EVOKE study [78% (n = 58); 77% (n = 55) pain relief at 3 and 12 months, respectively, post-implantation] (Fig. 2). The Mann–Whitney test results revealed no difference between the real-word data and the AVALON and the EVOKE for reported pain relief (%) at 3 months and 12 months.
Fig. 2
Patient-reported outcomes—stimulation-naïve patients. A Mean (± SEM) baseline (n = 135) overall pain scores (VNRS) in stimulation-naïve patients were 8.2 ± 0.1. After 12 months, (n = 76) pain scores decreased to 2.5 ± 0.3. B Responder and high-responder rates. At 12 months, 80% (n = 61 out of 76) of patients were responders, and 45% (n = 34 out of 76) of patients were high-responders. C Individual patient percentage change from baseline in overall pain scores at 12 months. D Comparison of overall pain relief (%) to the AVALON and EVOKE studies. No significant differences at 3 and 12 months between the real-world data release (RWE; 71.3%; 69.6%) and the AVALON (71.2%; 73.6%) and EVOKE (78.1%; 76.7%) studies
Conversion PatientsSub-analysis of conversion patients revealed that mean (± SEM) overall pain scores (VNRS) for salvage/conversion patients were 7.9 ± 0.3 at baseline (n = 13) (Fig. 3). At 3 months (n = 10), average VNRS overall pain scores decreased to 4.9 ± 0.9, at 6 months (n = 9) to 4.3 ± 1.1, and at 12 months (n = 9) to 3.8 ± 0.5. Analysis using the Kruskal–Wallis test revealed a significant change throughout all visits (Kruskal–Wallis test: H = 15.84, p < 0.0012, n = 41). Post hoc analyses (Dunn’s multiple comparisons test) demonstrated a significant improvement at all time points compared to baseline (baseline to 3 months: p < 0.0255; baseline to 6 months: p < 0.0085; baseline to 12 months: p < 0.0013). Mean (± SEM) baseline (n = 134) overall pain scores (VNRS) without salvage/conversion patients were 8.2 ± 0.1. At 3 months (n = 93), average VNRS scores decreased to 2.3 ± 0.2, at 6 months (n = 82) to 2.5 ± 0.3, and at 12 months (n = 76) to 2.5 ± 0.3.
Fig. 3
Overview of prior neuromodulation experience and VNRS scores. A Sub-analysis of conversion patients (n = 13). Certain patients demonstrated prior use of multiple SCS devices. B Mean (± SEM) baseline (n = 13) overall pain scores (VNRS) for salvage/conversion patients were 7.9 ± 0.3. After 12 months (n = 9) pain scores decreased to 3.8 ± 0.5
Patient-Reported Outcomes: All PatientsPatient satisfaction data were collected during standard-of-care follow-up visits (Fig. 4A). At the 3-month visits, 94% (n = 90 out of 96) of the patients reported being very satisfied (58%, n = 56 out of 96) or satisfied (35%, n = 34 out of 96) with their therapy; 5% (n = 5 out of 96) of the patients reported being unsatisfied, and 1% (n = 1 out of 96) of the patients reported being very unsatisfied with the therapy. At 6 months, 93% (n = 83 out of 89) of the patients reported being very satisfied (57%, n = 51 out of 89) or satisfied (36%, n = 32 out of 89) with their therapy; 6% (n = 5 out of 89) of the patients reported being unsatisfied, and 1% (n = 1 out of 89) of the patients reported being very unsatisfied with the therapy. At 12 months, 92% (n = 78 out of 85) of the patients were very satisfied (60%, n = 51 out of 85) or satisfied (32%, n = 27 out of 85) with the ECAP-controlled CL-SCS therapy, whereas 5% (n = 4 out of 85) of the patients were unsatisfied and 4% (n = 3 out of 85) very unsatisfied.
Fig. 4
Patient-reported outcomes—patient satisfaction and sensation awareness to stimulation. A Subjects rated their satisfaction with the stimulator using a four-point scale (with options ranging from “very unsatisfied” to “very satisfied”) at the 3-month, 6-month, and 12-month follow-ups. At the 3-month follow-up (n = 96), more than 95% of the patients were very satisfied or satisfied with the therapy, which only improved at the 12-month follow-up (n = 85), where the percentage of very satisfied patients increased even more. B Subjects rated their sensation awareness of the stimulator using a five-point scale (with options ranging from “never aware of stimulation sensation” to “always aware of stimulation sensation”) at the 3-month, 6-month, and 12-month follow-ups. More than 60% of all patients (n = 95) at the 3-month follow-up were either always aware or usually aware of the stimulation sensation. This amount stayed more or less the same at the 6-month and 12-month follow-up visits
Additionally, stimulation awareness was collected (Fig. 4B). At the 3-month visits, 42% (n = 40 out of 95) of the patients reported always being aware of the stimulation sensation; 23% (n = 22 out of 95) of the patients reported usually being aware of the stimulation sensation; 21% (n = 20 out of 95) of the patients reported sometimes being aware of the stimulation sensation; 12% (n = 11 out of 95) of the patients reported being rarely aware of the stimulation sensation; and 2% (n = 2 out of 95) of the patients reported never being aware of the stimulation sensation. At the 6-month visits, 25% (n = 22 out of 89) of the patients reported the always being aware of the stimulation sensation; 34% (n = 30 out of 89) of the patients reported usually being aware of the stimulation sensation; 30% (n = 27 out of 89) of the patients reported sometimes being aware of the stimulation sensation; 10% (n = 9 out of 89) of the patients reported being rarely aware of the stimulation sensation; and 1% (n = 1 out of 89) of the patients reported never being aware of the stimulation sensation. At the 12-month visits, 32% (n = 27 out of 84) of the patients reported always being aware of the stimulation sensation; 26% (n = 22 out of 84) of the patients reported usually being aware of the stimulation sensation; 26% (n = 22 out of 84) of the patients reported sometimes being aware of the stimulation sensation; 11% (n = 9 out of 84) of the patients reported being rarely aware of the stimulation sensation; and 5% (n = 4 out of 84) of the patients reported never being aware of the stimulation sensation.
Patient-Reported Outcomes: Stimulation-Naïve PatientsA sub-analysis was performed for stimulation-naïve patients. At the 3-month visits, 95% (n = 83 out of 87) of the patients reported being very satisfied (63%, n = 55 out of 87) or satisfied (32%, n = 28 out of 87) with their therapy; 3% (n = 3 out of 87) of the patients reported being unsatisfied and 1% (n = 1 out of 87) of the patients reported being very unsatisfied with the therapy. At 6 months, 95% (n = 76 out of 80) of the patients reported being very satisfied (60%, n = 48 out of 80) or satisfied (35%, n = 28 out of 80) with their therapy; 5% (n = 4 out of 80) of the patients reported being unsatisfied and 0% of the patients reported being very unsatisfied with the therapy. At 12 months, 92% (n = 70 out of 76) of the patients were very satisfied (63%, n = 48 out of 76) or satisfied (29%, n = 22 out of 76) with the ECAP-controlled CL-SCS therapy; 4% (n = 3 out of 76) of the patients reported being unsatisfied and 4% (n = 3 out of 76) of the patients reported being very unsatisfied with the therapy.
Additionally, stimulation awareness data were collected. At the 3-month visits, 43% (n = 37 out of 86) of the patients reported always being aware of the stimulation sensation; 21% (n = 18 out of 86) of the patients reported usually being aware of the stimulation sensation; 21% (n = 18 out of 86) of the patients reported sometimes being aware of the stimulation sensation; 13% (n = 11 out of 86) of the patients reported rarely being aware of the stimulation sensation; and 2% (n = 2 out of 86) of the patients reported never being aware of the stimulation sensation. At the 6-month visits, 26% (n = 21 out of 80) of the patients reported always being aware of the stimulation sensation; 35% (n = 28 out of 80) of the patients reported usually being aware of the stimulation sensation; 29% (n = 23 out of 80) of the patients reported sometimes being aware of the stimulation sensation; 9% (n = 7 out of 80) of the patients reported rarely being aware of the stimulation sensation; and 1% (n = 1 out of 80) of the patients reported never being aware of the stimulation sensation. At the 12-month visits, 31% (n = 23 out of 75) of the patients reported always being aware of the stimulation sensation; 27% (n = 23 out of 75) of the patients reported usually being aware of the stimulation sensation; 28% (n = 21 out of 75) of the patients reported sometimes being aware of the stimulation sensation; 9% (n = 7 out of 75) of the patients reported rarely being aware of the stimulation sensation; and 5% (n = 4 out of 75) of the patients reported never being aware of the stimulation sensation.
Recording and Characterizing ECAPsECAPs were successfully recorded across all patients, displaying the system’s capability to capture ECAPs at a specified frequency (e.g., 30 Hz = 30 times per second) and dynamically adjust to the real-time neurophysiological variations encountered by each patient throughout the day. In total, approximately 210 billion ECAPS were recorded from 85 patients during the 12-month period. As an example, 865,236,385 (0.86 billion) ECAPs were recorded from one particular patient during the course of 1 year.
Electrophysiological data, device parameters, and usage were analyzed to gain a better understanding of the prescribed therapy. Data for 1 week prior to the patient’s 3-month, 6-month, and 12-month visits were used for this analysis. Median values across the study cohort at 3 months, 6 months, and 12 months are shown for the in-clinic perception, comfort, and maximum. Out-of-clinic activation is summarized here by the mode ECAP amplitude [3, 12], with the estimated artefact removed [21]. If the activation plot was not analyzable due to technical issues or was not captured, the values were not taken into consideration. Therefore, not all patients have activation plot data presented here.
At 3 months, patients (n = 112) used their device 96% (median) of the time. The median stimulation frequency was 30 Hz and median pulse width was 320 µs (n = 89). Patients used their patient controller to adjust stimulation or program 1.1 (median) per day and charged their device 2.0 times (median) in the week prior to the visit (Fig. 5B). At 6 months, patients (n = 109) used their device 97% (median) of the time. The median stimulation frequency was 30 Hz and median pulse width was 300 µs (n = 79). Patients used their patient controller to adjust stimulation or program 0.7 (median) times per day. At 12 months, the patients (n = 98) used their device 97% (median) of the time and charged their device 2.0 times (median) per week. The median stimulation frequency was 30 Hz and median pulse width was 330 µs (n = 67). Patients used their patient controller to adjust stimulation or program once (median) every 3 days, i.e., 0.4 adjustments per day and charged their device 2.0 times (median) per week.
Fig. 5
In-clinic and out-of-clinic spinal cord activation. A Median (IQR: Q1–Q3) data at 12 months (n = 52) revealed the ECAP threshold to be 2.7 µV (− 3.2 to 7.8). Median data at 12 months (n = 52) revealed the ECAP amplitude at perception threshold to be 6.0 µV (2.0–14.0). The ECAP amplitude at the maximum discomfort level was 55.0 µV (38.0–82.5) at 12 months. The mode ECAP amplitude target, the patients’ actual activation outside the clinic, was at every time point greater than the median ECAP threshold at each visit interval at 12.0 µV (0.0–28–6) at 12 months.*If the activation plot was not analyzable due to technical issues or was not captured, the values were not taken into consideration. Therefore, not all patients have activation plot data presented here. B Patients used their patient controller to adjust stimulation or program once (median) every 3 days, i.e., 0.4 adjustments per day
As part of standard procedure, activation plots were obtained for all patients during each follow-up visit (Fig. 5A). These plots were consistently gathered with the patient seated. They were generated incrementally to illustrate the correlation between current amplitude (mA) and the corresponding neural response (ECAP amplitude in µV). The individual sensitivity to stimulation (µV/mA) is described by the linear slope of the activation plot beyond the knee seen at threshold; at 3 months, patient sensitivity was 26.4 µV/mA, at 6 months 24.1 µV/mA, and at 12 months 30.5 µV/mA [8, 24].
Median (IQR: Q1–Q3) data at 3 months (n = 73), 6 months (n = 65), and 12 months (n = 52) revealed the ECAP threshold to be 2.7 µV (− 3.2 to 7.8) using 5.3 mA (3.8–6.3) at 3 months, 2.4 µV (− 6.6 to 7.6) using 5.4 mA (4.0–7.0) at 6 months, and 1.0 µV (− 3.7 to 7.2) using 5.6 mA (4.3–7.0) at 12 months. Median data at 3 months (n = 73), 6 months (n = 65), and 12 months (n = 52) revealed the ECAP amplitude at perception threshold to be 6.0 µV (2.0 – 14.0) using 5.0 mA (3.3–6.8) at 3 months, 6.0 µV (0–13.0) using 5.1 mA (3.1–7.0) at 6 months, and 8.5 µV (1.0–18.25) using 5.2 mA (3.7–6.6) at 12 months. The ECAP amplitude at the maximum discomfort level was 49.0 µV (29.5–72.5) using 7.2 mA (5.0–9.9) at 3 months (n = 71), 50.0 µV (35.0–73.0) using 7.5 mA (5.3–9.2) at 6 months (n = 65), and 55.0 µV (38.0–82.5) using 7.0 mA (5.1–9.8) at 12 months. The mode ECAP amplitude target, the patients’ actual activation outside the clinic, was at every time point greater than the median ECAP threshold at each visit interval: 14.6 µV (2.9–28.6) at 3 months (n = 74), 18.1 µV (6.1–28.2) at 6 months (n = 68), and 12.0 µV (0.0–28.6) at 12 months (n = 57). Patients were stimulating above their ECAP threshold 94% of the time at 3 months, 99% of the time at 6 months, and 99% of the time at 12 months.
Neural MetricsFurther investigation was undertaken to objectively characterize the physiological parameters of SCS therapy in this cohort using the metrics percent time above ECAP threshold (%), dose ratio, and dose accuracy (µV), using previously described methods [21, 22]. Results showed that a median of 90% (40.7–99.2) (data from n = 236 patients) of stimuli were above the ECAP threshold, with a dose ratio of 1.3 (1.1–1.4) (data from n = 230 patients) and dose accuracy of 4.4 µV (0.0–7.1) (data from n = 254 patients). Thus, across all three metrics, the majority of patients had objective therapy metrics corresponding to the highest levels of pain relief in previously reported studies (usage over threshold > 80%, dose ratio > 1.2, and error < 10 µV) [21, 22].
In order to gain deeper insights into the relationships among the three objective neural metrics, rank correlations were computed between each pair of metrics. The associations between metrics and the distributions of metric values are illustrated in Fig. 6. Spearman’s r2 value for the correlation between dose ratio and percentage of time above ECAP threshold is 0.9 (p < 0.0001), between dose ratio and dose accuracy is 0.5 (p < 0.001), and between percentage of time above ECAP threshold and dose accuracy is 0.4 (p < 0.0001).
Fig. 6
Neural metrics analysis. Scatterplots with associated distribution plots of usage over threshold, dose ratio, and dose accuracy
Comments (0)