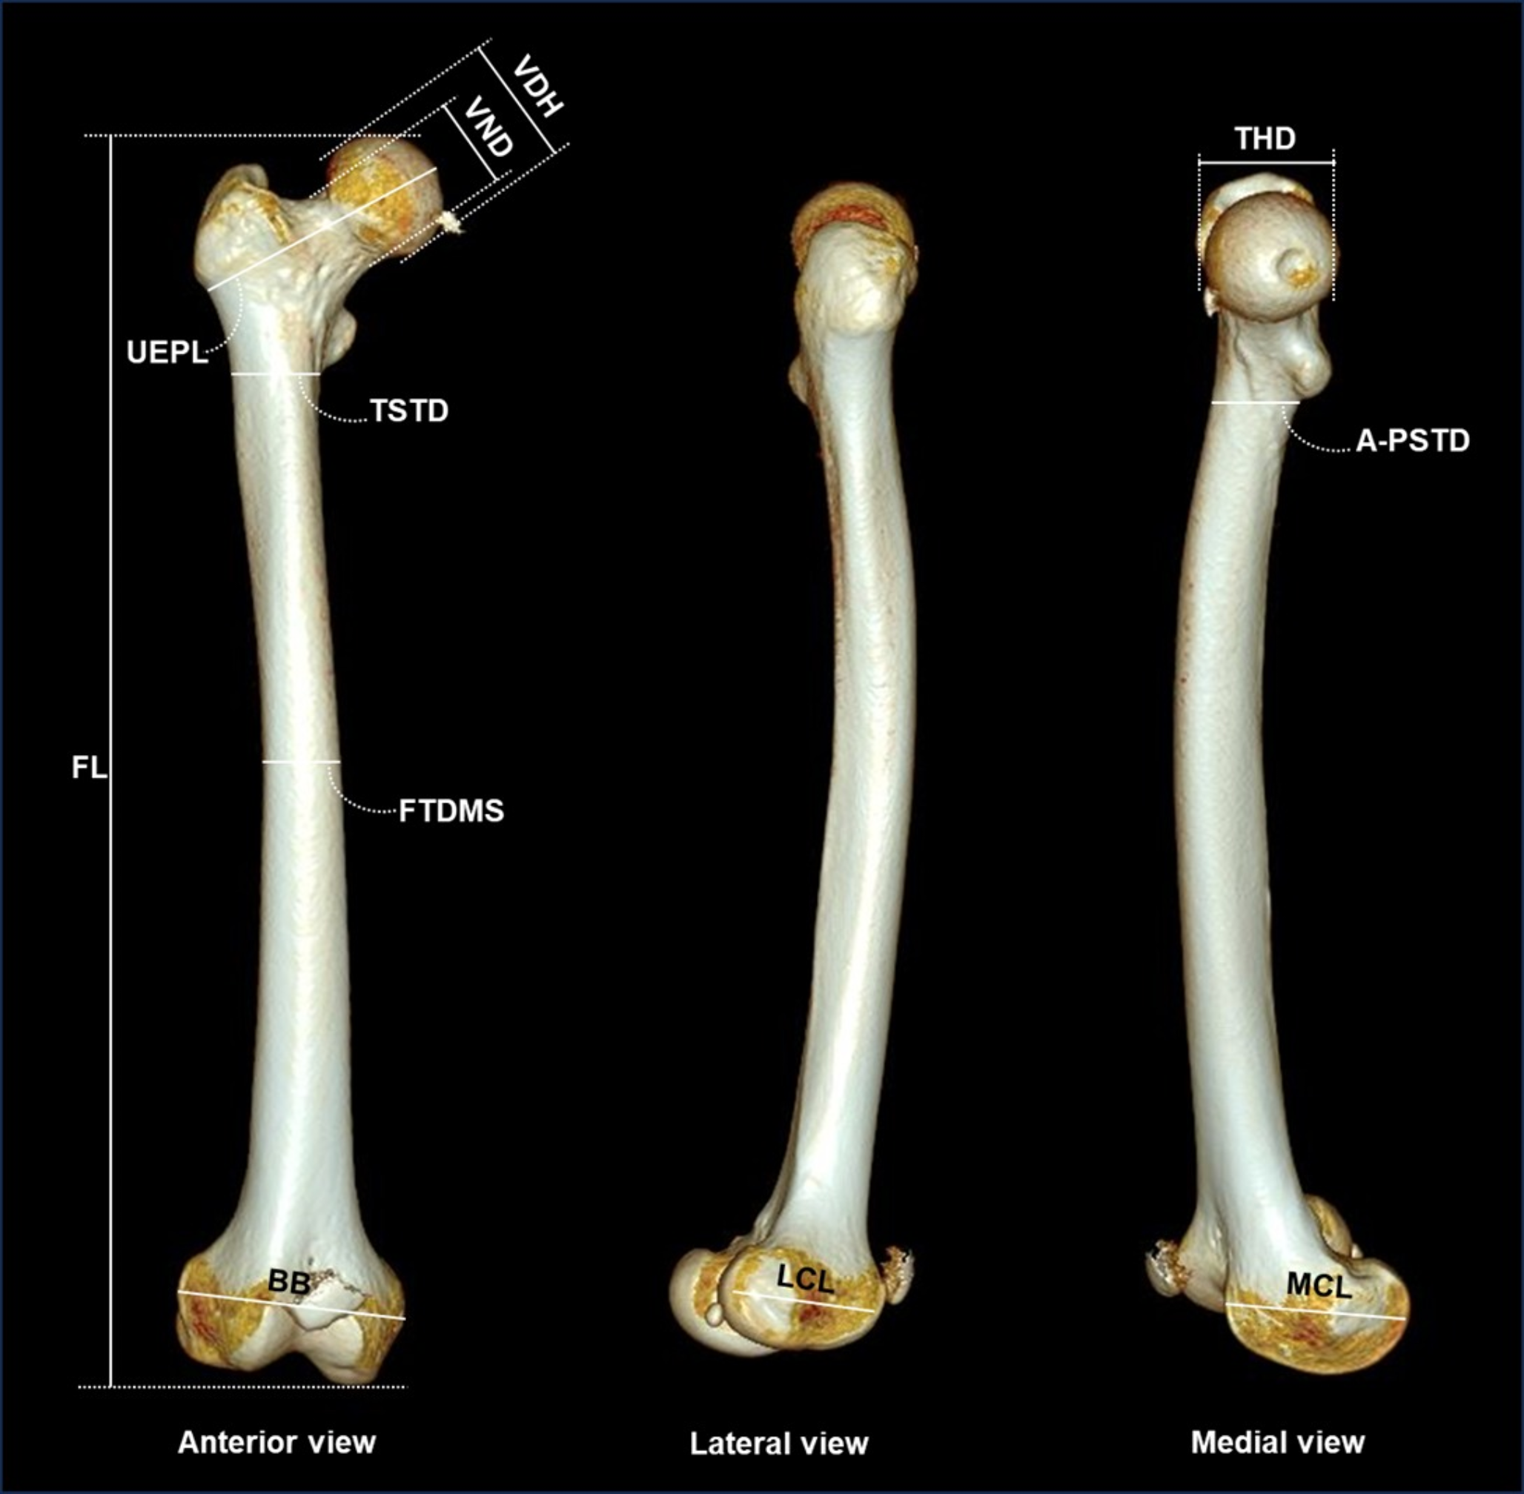
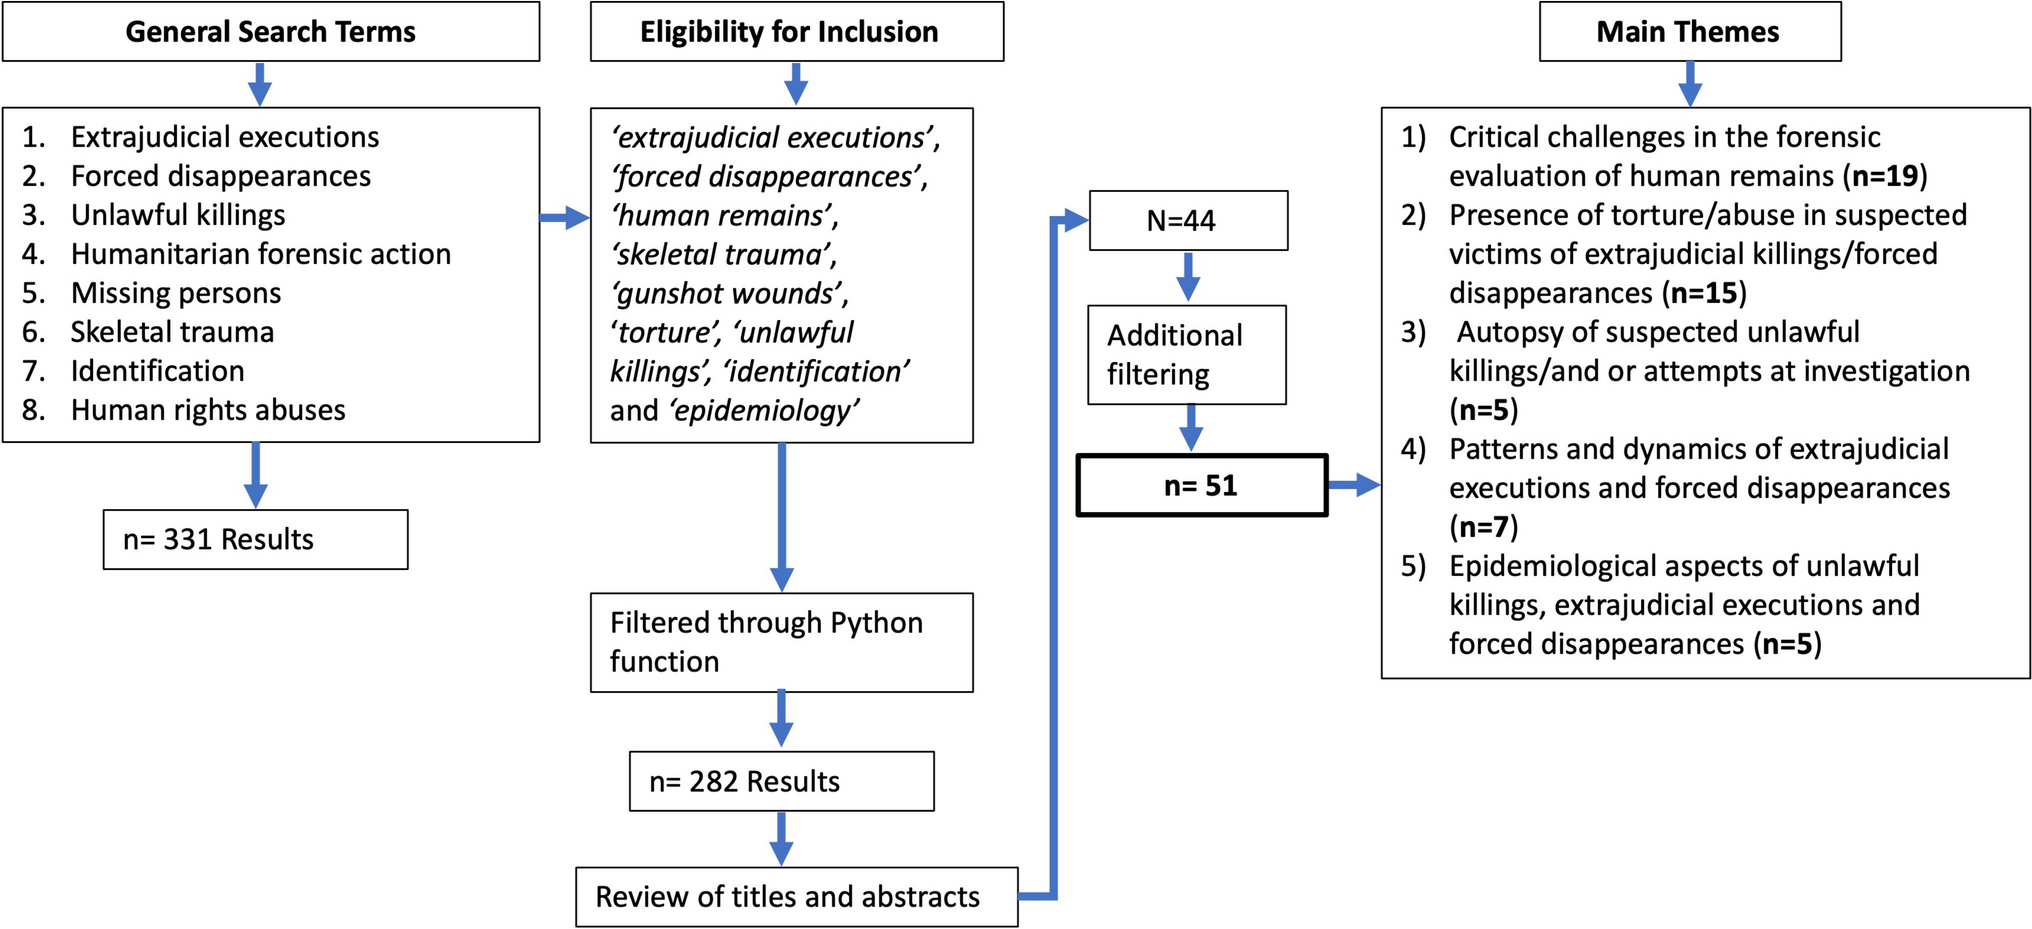
In the present study, the intra- and inter-observer errors were small and can be acceptable; the femoral measurement using CT images was thus considered to be precise and reproducible.
Previous studies suggested that femoral neck width increased with age probably due to endocortical resorption from maintaining resistance to loaded stress [22, 36, 37]. However, in this study, there were no significant age differences between the populations in both sexes.
The results of this study demonstrated that significant differences between the Japanese and Western Australian populations in various measurement values. Previous studies [38, 39] reported significant variances in femoral measurements between South African groups (Black, White, and mixed-ancestry). Several studies demonstrated that Asian groups had shorter femoral neck dimensions and thicker cortical bone than other groups [22, 40, 41]. Attia et al. [15] also reported that The Egyptian had shorter femoral necks on average than individuals in other populations studied. Conversely, Chin et al. [40] suggested that premenopausal Polynesian females had longer femoral necks than European and other ethnic groups. The latter data combined clearly suggest that there may be considerable differences in femoral measurements between different populations.
Colman et al. [25] reported the high VIF values of femoral head measurements in a Dutch population, indicating high levels of multicollinearity. The results of this study also demonstrated some measurements with VIF values more than 6. Thus, there is a need to explore femoral bone measurements with less multicollinearity in the future.
In the present study, the classification accuracy of Japanese and Western Australian individuals to their respective population groups was approximately 80% using RFM and SVM, respectively. Similarly, Attia et al. [15] reported that using RFM and the linear variables based on femoral measurements in Egyptian, Indian, and Greek populations, the overall accuracy reached 83% and 72% for females and males, respectively. Thus, although phenotypic differences between populations are known to be most pronounced in the skull [42], the comprehensive information presented in this study may be particularly useful for forensic investigations where the skull is damaged and unavailable. L’Abbé et al. [43] reported that data on the cranium tend to misclassify individuals according to sex. On the other hand, sexual size dimorphism appears to be more evident in the postcranial skeleton [44], and previous studies have found postcranial elements to be useful in facilitating more accurate sex estimates than the skull [11, 45,46,47]. Thus, the use of a multifactorial approach provides potential to combine probability and likelihood, to enhance identification efforts, and to achieve greater reliability that is necessary in a forensic context.
The present study demonstrated that performing sex-specific analyses of population affinity improves classification accuracy by reducing group overlap and more effectively separating groups; Attia et al. [15] reported a similar finding. Sex accounts for most of the variation between groups, and population affinity for most of the remaining [48], therefore, when the effect of population-specific sexual dimorphism is removed, the model only has to assess morphological differences associated with population variances.
Previous studies have found that higher classification accuracy was generally achieved with female, compared to male, sex-specific models [15]. Using linear discriminant analysis, Holliday and Falsetti [49] achieved 100% accurate population affinity classification in females, versus 87% of the male training sample for discriminating African-American from European-American skeletons using postcranial measurements. Liebenberg et al. [44] reported higher classification accuracy for South African Black females (70%) relative to males (67%), and for colored females (80%) compared to males (73%). However, in the present study, there was no considerable differences in the correct classification rates between the female- and male-specific models. Similarly, Liebenberg et al. [44] revealed that both females and males were classified equally (93%) among South African whites.
The two-way models applied in the present study demonstrate that correct classification rates were higher for Western Australian individuals except for the male model using SVM. However, regarding the four-way models, the Western Australian female and Japanese male individuals had the lower correct classification rates compared with the Western Australian male and Japanese female samples. These results indicate that the proximal femur of Western Australian female and Japanese male are similar in size, larger than those of Japanese females, and smaller than those of Western Australian males. Therefore, it is suggested that accurate sex determination is quite important for population affinity estimation between Japanese and Western Australians.
In the present study, the UEL was the most accurate variable for discriminating between the two population groups. Christensen et al. [14] also reported that the UEL showed significant differences among all groups (Europeans, Africans, and Asians) and may therefore potentially be used to reliably assess population affinity in unidentified human remains in a forensic context.
In the present study, machine learning methods were used for population affinity classification. Over the last decade, machine learning algorithms have provided new insight into human variation. In addition, they have outperformed traditional classification methods in anthropological research [31, 50]. Recently, researchers have used RFM in both morphoscopic and morphometric approaches to population affinity estimation [31, 32]. RFM can tackle classification and regression tasks in a supervised learning framework, and in terms of unsupervised learning, it can be used for data clustering, missing value imputation, and novelty and outlier detection [30]. The most important advantage of RFM is that it transforms low-bias and high-variance models into low-bias and low-variance models, by training multiple decision trees simultaneously because low variance is the most valuable feature for anthropological applications [51]. In addition, one of the most interesting features is that it does not require cross-validation to obtain unbiased estimates of model performance [30]. Moreover, RFM provides more accurate models than linear discriminant analysis in population affinity estimation (multi-group classification) based on the femoral measurements [15]. However, the classical algorithms have the advantage of being able to create estimation formulae. Therefore, regarding population affinity estimation using the measurements of this study, it is necessary to conduct a comparative study between machine learning algorithms and major classical algorithms in the future. In addition, Attia et al. [15] also reported that classification accuracy varied depending on the type and number of variables used, available skeletal elements, and the specific populations studied. Thus, further investigation of the feasibility of population affinity estimation based on other bones, and/or in other populations, would provide useful information for professional practice.
Previous studies [52,53,54] demonstrated that the SVM was more effective than RFM in population affinity assessment. Similarly, in the present study, probably due to the relatively small amount of data, SVM showed higher rates of correct classification than RFM. However, no study has used SVM for population affinity estimation based on femoral measurements. Further studies regarding other machine learning methods for population affinity assessment are required to explore this in more detail.
There were several studies on population affinity estimation which have analyzed the femoral data obtained from physical specimens and dual-energy x-ray absorptiometry [2, 14]. Conversely, aside from the work we present here, only one previous study [15] has investigated the feasibility of multiple femoral measurements acquired in CT images to estimate population affinity. CT imaging can reduce the time-consuming and tedious nature of skeletal maceration or the need for physical storage space [55,56,57]. In addition, CT data is easier to share among institutions in different countries than the physical specimen, which facilitates collection of multi-population data and a deeper understanding of the diversity of femoral morphology.
It is important to acknowledge that the present study had some limitations. First, both PMCT and CT data from surviving patients were used. Although the measurements of human bones are not expected to change dramatically after death, those differences were not assessed in this study. Second, data were collected from two different facilities using 16- and 64-row detector CT systems and under different conditions for reconstructed images. However, it has been empirically demonstrated that variations in the type of CT scanner used, slice thickness, and exposure levels have no significant effect on the acquisition of linear measurement data [56]. Thus, data from a large number of hospitals and departments can be used without concern regarding the accuracy of the virtual models generated. Third, estimating population affinity from the proximal femur alone requires consideration of differences in physical activity, environmental adaptations, genetic origins, and diet [22, 58,59,60,61]. However, information on those details was not available in the present study. Finally, estimation formulas are not derived when using machine learning algorithms as in this study; the use of the method in this study at other institutions is limited. In the future, it will be necessary to conduct further comprehensive research and develop software for population affinity estimation which can be applied to forensic investigation.


Comments (0)