
記住我
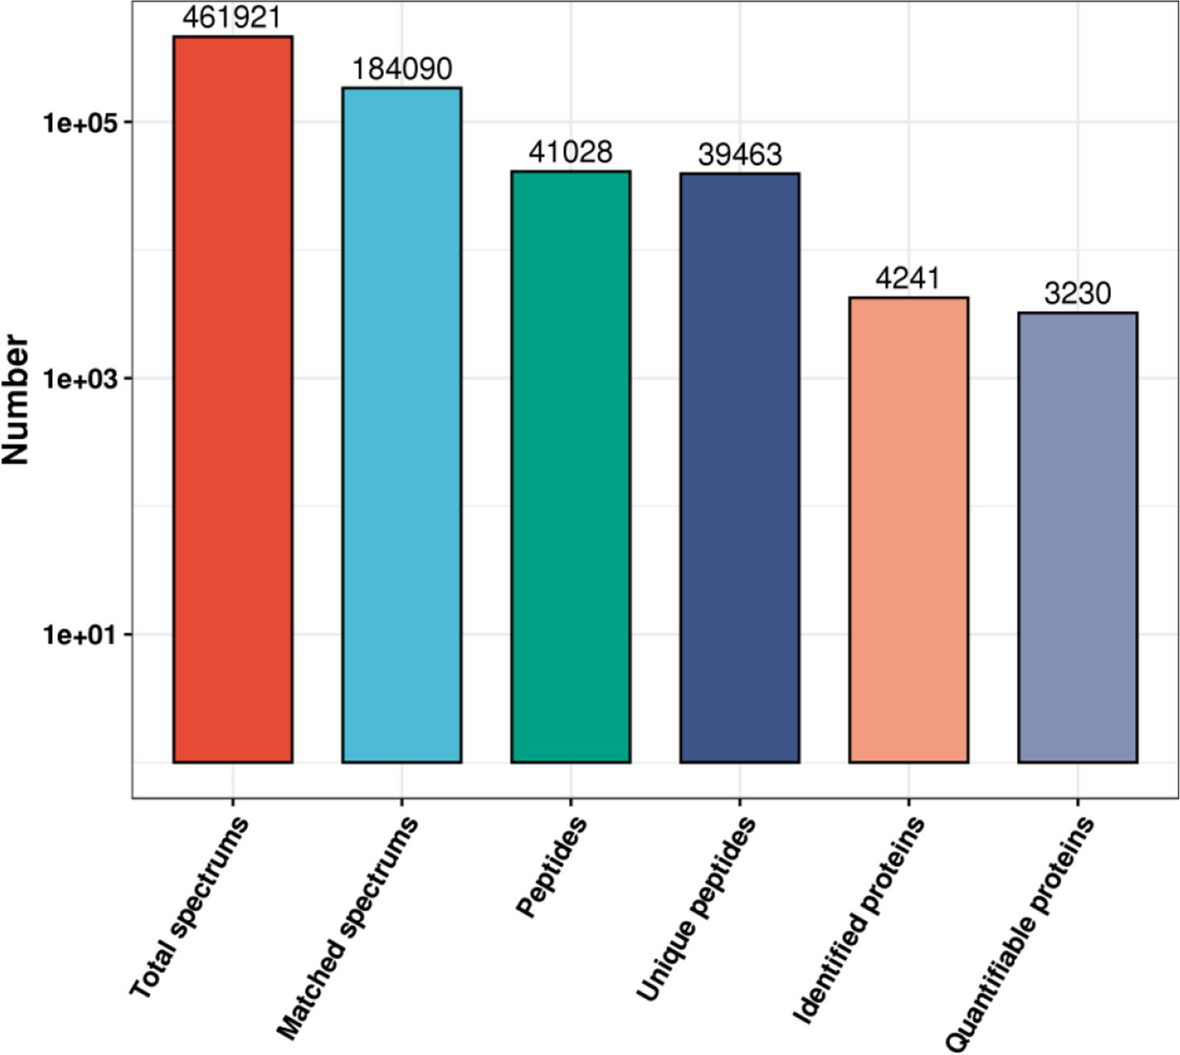


In total, 461,921 spectrograms were obtained using MS. The number of available spectrograms were 184,090, and 39.9% of them were effectively utilized. A total of 41,028 peptides were identified through spectrogram analysis, of which 39,463 were specific peptide segments. A total of 4,241 proteins were identified, of which 3,230 were quantifiable (Fig. 1). The MS/MS result data file was shown in Supplementary Table 1.
Fig. 1
Overview of the mass spectrometry results. Bar plot summarizing the detected peptides and proteins in the normal group and the MENK group
Quality control of dataAfter conducting the database search, a series of quality control evaluations were needed to ensure that the results met the required standards. These evaluations included the distribution of peptide length, peptide number, protein coverage, and protein molecular weight (Fig. 2).
Fig. 2
Peptide distribution. A Peptide length distribution. Most peptides were distributed in the range of 7–20 amino acids. B Peptide number distribution. C Protein coverage distribution. D Protein molecular weight distribution
DEP analysesCompared with the control group, 208 DEPs were identified in the MENK group (Fold change > 1.5): 96 proteins had upregulated expression and 112 proteins had downregulated expression (Fig. 3). The differentially expressed protein summary in Table 2.
Fig. 3
Identification of DEPs between the control group and the MENK group. A The total number of upregulated and downregulated DEPs. The significant thresholds for the upregulated differentially expressed proteins (DEPs) were set at a fold change (FC) > 1.50 and a p-value (P) < 0.05. FC < 0.67 and P < 0.05 were set as the significant thresholds for the downregulated DEPs. B Volcano plot of the identified DEPs between the control group and the MENK group. The red dots represent upregulated DEPs, the green dots represent downregulated DEPs, and the gray dots represent unchanged proteins. C Differential protein heatmap
Table 2 Differentially expressed protein summaryEnrichment analyses of DEPsGO and KEGG databases were used to ascertain whether DEPs had significant enrichment in specific functional categories. DEPs functional enrichment analysis was conducted in Fig. 4. The enriched KEGG pathways were shown in Fig. 5. Upregulated proteins were detected with proteasome (mmu03050) and nicotinate and nicotinamide metabolism (mmu00760) (Fig. 5A). Downregulated proteins were associated with ferroptosis (mmu04216), necroptosis (mmu04217), mineral absorption (mmu04978), and central carbon metabolism in cancer (mmu05230) (Fig. 5B).
Fig. 4
GO analysis for the identified DEPs. The DEPs were annotated into three categories based on GO terms, including biological processes, cellular components, and molecular functions. A GO enrichment analysis of the upregulated DEPs. B GO enrichment analysis of the downregulated DEPs
Fig. 5
KEGG pathway enrichment analysis of DEPs. Bubble diagrams displaying KEGG pathways for significantly enriched upregulated (A) and downregulated (B) DEPs. The size of the bubbles describes the number of DEPs in the pathway
Hierarchical clustering analysisAccording to the degree of fold change, DEPs were categorized into four groups: “severely downregulated” (Q1), “mildly downregulated” (Q2), “mildly upregulated” (Q3), and “severely upregulated” (Q4) (Fig. 6A).
Fig. 6
Hierarchical cluster analysis for the DEPs. A The significant thresholds for the DEPs were a fold change > 1.50 or < 0.67 and P < 0.05. The DEPs were divided into four groups, Q1 to Q4, based on the degree of FC. Q1 (FC ≤ 0.5, severely downregulated), Q2 (0.5 < FC ≤ 0.667, mildly downregulated), Q3 (1.5 < FC ≤ 2.0, mildly upregulated), and Q4 (FC > 2.0, severely upregulated). B The Q categories for KEGG pathways. C The Q categories for protein domains. D The Q categories for biological processes. E The Q categories for cellular components. F The Q categories for molecular function. The red color indicated a stronger enrichment. The blue color indicated weaker enrichment
DEPs with significantly downregulated expression were enriched for the pathways related to “ferroptosis”, “necroptosis”, “mineral absorption”, and “central carbon metabolism in cancer” (Fig. 6B, Supplementary Table 2). In the clustering analysis of the protein domain, some DEPs with significantly downregulated expression were enriched for “Ferritin-like domain” and “2Fe-2S iron-sulfur cluster binding domain” (Fig. 6C, Supplementary Table 3). In the clustering analysis using the GO database, DEPs with significantly upregulated expression were enriched for biological processes such as “regulation of response to oxidative stress” and “nucleobase-containing compound catabolic process”. On the other hand, downregulated expression included processes like “regulation of secretion”, “sequestering of metal ion”, and “intracellular sequestering of iron ion” (Fig. 6D, Supplementary Table 4). The main cellular components were enriched for “lysosome” and “ficolin-1-rich granule lumen” (Fig. 6E). The main molecular functions were enriched for “iron ion binding”, “peptide binding”, and “oxidoreductase activity” (Fig. 6F).
KEGG pathway in ironThe KEGG pathway obtained from the enrichment analysis above was visualized as a web page. We have identified two main pathways in ferroptosis and iron metabolism that contain down-regulated genes, HMOX1 and Ferritin (FTH and FTL) (Fig. 7).
Fig. 7
KEGG enrichment pathway. A Pathway of mineral absorption. B Pathway of ferroptosis. Downregulated proteins were highlighted in green
Analyses of protein-protein-interaction networksIn order to clearly demonstrate the interaction relationships between proteins, we screened the top 50 proteins with the closest interactions and constructed the protein interaction network (Fig. 8A). HMOX1 and Ferritin (FTH) were screened in the PPI network shown in Fig. 8B. HMOX1 was found to be connected with GAPDH (upregulated), while FTH was found to be related to Cst3 (upregulated) and Pgm1 (downregulated).
Fig. 8
PPI network. A Differential expression of proteins. Circles represented differentially expressed proteins, with different colors indicating the direction of protein expression (green for downregulated proteins, red for upregulated proteins). The darker the color, the greater the difference in fold size. B Correlation between HMOX, FTH, and their surrounding proteins
HMOX1 and Ferritin GO screeningTo determine the function of MENK in influencing macrophages through HMOX1 and Ferritin, we conducted a GO enrichment analysis by docking HMOX1 and Ferritin (FTH and FTL). The results were listed in Supplementary Table 5 (HMOX1), Supplementary Table 6 (FTH), Supplementary Table 7 (FTL), and the common GO list (Supplementary Table 8). HMOX1 and Ferritin were enriched in the immune system process and iron ion homeostasis in BP enrichment. HMOX1 was found to be enriched in membrane rafts, caveolae, membrane regions, membrane microdomains, and membranes in the cellular component (CC). We explored how it works in the cytoplasm and the surrounding membrane. MF included phospholipase D activity, phospholipase activity, phosphoric diester hydrolase activity, and lipase activity. FTH and FTL were found to be enriched, suggesting that they may act in the lysosome and extracellular region.
Molecular dockingBased on the hub genes in iron-related proteins, crystal structures of HMOX1, NADPH, FTH, and FTL proteins were downloaded from the PDB database. These structures were then improved using PyMOL. Subsequently, molecular docking of the target proteins to the related ingredients was performed using AutoDock. Finally, the PyMOL software was used to calculate the length of hydrogen bonds, enhance the images, and export them. Except for FTL and FTH, HMOX1 and NADPH successfully docked with MENK (Fig. 9). The affinity score was used to calculate the binding ability. And it is generally believed that, affinity <-7 kcal/mol indicates stronger binding activity, -7 kcal/mol suggests moderate binding activity, and affinit > -4 kcal/mol indicates weak binding activity [31]. After calculation, it was found that HMOX1 (-7.0) exhibited stronger binding activity with MENK, while NADPH (-5.78) showed moderate binding activity with it. Finally, the associations of HMOX1 and NADPH with MENK were shown using PyMOL software. The length of hydrogen bonds was calculated. We found two hydrogen bonds between HMOX1 and MENK, and four hydrogen bonds between NADPH and MENK. The hydrogen bonds were represented as yellow dotted lines in the diagrams. In HMOX1, MENK combined with histidine (position 56 in the amino acid sequence) and glutamine (position 102 in the amino acid sequence). In NADPH, MENK combined with the arginine (position at 427 in the amino acid sequence). These results showed that MENK had binding activity with HMOX1 and NADPH, which may be the targets of MENK’s action.
Fig. 9
Molecular docking of MENK. A MENK-HMOX1. B MENK-NADPH
MENK downregulated HMOX1 and FTHThe results of proteomics analysis showed that MENK could downregulated the factors related to ferroptosis, HMOX1 and FTH. Therefore, we measured the levels of HMOX1 and FTH in RAW264.7 cells at 72 h after MENK intervention in macrophages. As shown in Fig. 10A-C, the mRNA levels and protein expression of HMOX1 and FTH decreased to varying degrees after MENK intervention in cells (P < 0.001, P < 0.05). Further, localization of HMOX1 and FTH by immunofluorescence showed that both intracellular HMOX1 and FTH expressions decreased after MENK intervention (Fig. 10D).
Fig. 10
MENK downregulated HMOX1 and FTH. A The gene levels of HMOX1 and FTH were quantified at 72 h by qPCR in RAW264.7 cells. B and C The protein expressions of HMOX1 and FTH were detected at 72 h by Western blot in RAW264.7 cells. The results were presented as fold increase over the control group. D The localization and expression of HMOX1 and FTH protein in RAW264.7 cells at 72 h. Data represent the mean ± SD of three independent experiments. ★P < 0.05, ★★★P < 0.001 versus the control group
留言 (0)