Patients and clinical samples
This study included 11 patients with metastatic UM treated with the PKC inhibitor IDE196, alone or in combination with the human double minute 2 (HDM2) inhibitor HDM201 at Westmead Hospital, Sydney, Australia, as part of an experimental dose-escalation phase I clinical trial (NCT02601378) between November 2016 to August 2018 [7]. Patient demographics, performance status, UM mutation status, pre-treatment LDH levels (units/litre; U/L), treatment and biopsy details are provided in Supplementary Table S1. Investigator-determined objective responses were assessed radiologically with computed tomography (CT) scans at two monthly intervals using Response Evaluation Criteria in Solid Tumours (RECIST) 1.1 criteria. Responders were defined as patients who had partial response (PR) or stable disease (SD) for ≥6 months. Non-responders were defined as patients who had SD < 6 months or progressive disease. Clinical progression was defined by primary clinician’s assessment of disease progression in patients without re-staging imaging and were classified as progressive disease. Written consent was obtained from all patients under approved Human Research Ethics Committee protocols from Royal Prince Alfred Hospital (Protocol X15-0454 and HREC/11/RPAH/444). Fresh tumour biopsies were collected pre-treatment (PRE; median 7 days prior to treatment initiation), and early during treatment (EDT; median 26 days, range 12–29 days after treatment initiation; Supplementary Table S1) for RNA sequencing. Core biopsy samples were reviewed for tumour cell content and suitability for RNA sequencing by independent anatomical pathologists.
RNA isolation, sequencing and analysis
Total RNA was isolated from fresh frozen core tissue sections using the AllPrep DNA/RNA/miRNA Universal kit (Qiagen, Hilden, Germany). cDNA synthesis and library construction were performed using the TruSeq RNA Library Prep Kit (Illumina) and paired-end 150 bp sequencing, with each sample yielding 40–50 million reads. Sequencing was performed on the Illumina HiSeq 2500 or NovaSeq S4 platforms at the Australian Genome Research Facility.
RNA data processing was performed as described previously [9]. Absolute signature enrichment scores using filtered (counts ≥3 in at least two samples) FPKM values were determined using ssGSEA [10] (version 10.1.0) provided by GenePattern (https://cloud.genepattern.org/) with the Hallmark gene sets plus the YAP_UP geneset from the C6 oncogenic signature gene sets (Molecular Signature Database version 2023.1) and MAPK signatures derived from [11, 12]. The correlation between ssGSEA enrichment scores was calculated using the Pearson correlation coefficient in the nearest neighbour algorithm with 1000 permutations within the Morpheus web-based tool (https://software.broadinstitute.org/morpheus/).
Cell culture and molecular inhibitors
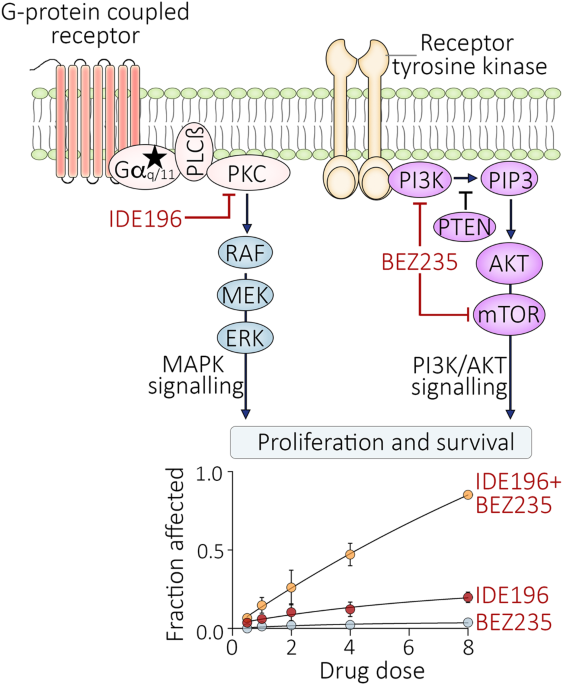
UM cell line sources were previously described [8]. UM cell lines were authenticated by STR profiling using the StemElite ID system from Promega, and all cells tested negative for mycoplasma (MycoAlert Mycoplasma Detection Kit, Lonza, Basel). All cell lines were maintained in Roswell Park Memorial Institute-1640 media (Gibco, Thermo Fisher Scientific, Waltham, MA, USA) supplemented with 10% or 20% foetal bovine serum (FBS; Sigma-Aldrich, Germany), 20 mM HEPES (Sigma-Aldrich), and 4 mM l-glutamine (Sigma-Aldrich) at 37 °C in 5% CO2. UM cells were treated with indicated concentrations of the PKC inhibitor IDE196 (Chemgood, VA, USA, C-1368), the MEK inhibitor trametinib (SelleckChem, S2673), and the PI3K/mTOR inhibitor BEZ235 (SelleckChem, S1009), all prepared in dimethyl sulfoxide (DMSO; Sigma-Aldrich). Effective drug concentrations were selected based on viability assays performed on a panel of uveal melanoma cell lines (Supplementary Fig. S1) and a review of relevant literature [8, 13,14,15,16].
Lentiviral transduction
Lentiviral constructs encoding AKT1E17K and MEK1E203K in the plenti6.3/T0/V5-DEST vector (Thermo Fisher Scientific, MA, USA) were prepared in HEK293T cells, as previously described [17]. An empty vector was used as a control. Plasmid constructs were mixed with polybrene (Sigma-Aldrich) at 8 µg/mL and added to UM cell lines. Transduced cells were selected using Blasticidin (Gibco) at 4 µg/mL for 2–3 weeks before experiments were performed.
Crystal violet clonogenic assay
UM cell lines OMM1.3 and Mel270 were seeded in duplicates in six-well plates (Costar, NY, USA) at 0.8–4.0 × 10⁴ cells per well and allowed to adhere overnight before treatment with 0.05% DMSO (control), 1 µM and 5 µM of IDE196. Colony formation was monitored over a 7 to 14-day period and drug media changed twice a week. Once control-treated cells neared 100% confluency, cells were washed with 1× phosphate buffer saline (PBS; Gibco), fixed with ice-cold 100% methanol, and stained with 0.1% crystal violet (Sigma-Aldrich) solution prepared in MilliQ water. The plates were imaged on ChemiDoc MP imaging system (Bio-Rad, CA, USA), and colony areas were quantified in ImageJ version 1.53a software [18] using the colony area plug-in [19]. Four biological replicates were performed per cell line.
Flow cytometry cell cycle and apoptosis assay
UM cells were seeded in six-well plates (Costar) at 1 × 10⁵ cells per well and treated the next day with DMSO (control; final concentrations 0.04–0.08%), 10 nM Trametinib, 2 µM BEZ235, or 5 µM IDE196 for 72 h. For synergy studies, UM cells were treated with increasing doses of IDE196 (0, 0.5, 1, 2, 4 and 8 µM) and BEZ235 (0, 0.125, 0.25, 0.5, 1 and 2 µM) at a fixed 4:1 ratio for 72 h. Floating and adhered cells were collected after treatment and stained with propidium iodide, as previously described [20] and acquired on the BD LSR Fortessa X20 flow cytometer (BD Biosciences). Cell cycle and sub-G1 (cell death) analyses were performed using BD FACSDiva Software version 8.0.2 (BD Biosciences, NJ, USA) and ModFIT LT 5.0 (Verity Software House, ME, USA) to quantify DNA contents. The percentage of S-phase inhibition was calculated as [(percentage of S-phase in the control-treated cells – percentage of S-phase in drug-treated cells)/(percentage of S-phase in the control-treated cells) × 100]. Change in % sub-G1 was calculated relative to the control-treated cells (% sub-G1 in drug-treated cells – % sub-G1 in control-treated cells). Data were derived from three to four independent biological replicates.
Apoptosis in lentivirally transduced OMM1.3 and Mel270 cells was measured using Annexin V staining. Transduced and treated cells were fixed with 4% paraformaldehyde using the BD Cytofix fixation buffer (BD Biosciences), stained with PE/Dazzle 594 Annexin V (BioLegend, CA, USA) 72 h after treatment, in accordance with the suppliers’ instructions, and acquired on the BD LSR Fortessa X20 flow cytometer (BD Biosciences). Annexin V positivity was quantified using the FlowJo software v8 (BD Biosciences).
Drug synergy analysis
Synergy analyses were based on sub-G1 data derived from the cell cycle analysis. The fraction affected values were calculated as an average sub-G1 fraction of drug-treated cells – average sub-G1 from control-treated cells, from three to four independent experiments per cell line. Synergistic activity was assessed using the Chou-Talalay method [21] and determined from CalcuSyn version 2.11 (ComboSyn Inc., Paramus, NJ, USA).
Western blot analysis
UM cells were seeded in T75 flasks (Falcon, NY, USA) at 1.0 × 10⁶ cells per flask and treated the next day with DMSO (control), Trametinib, BEZ235, IDE196, or IDE196 ± BEZ235 for 24 h at the indicated concentrations. Cells were pelleted and lysed with RIPA lysis buffer supplemented with complete protease inhibitor cocktail (Roche, Basel, Switzerland) and PhosSTOP (Sigma-Aldrich). Protein lysates (20 µg) were loaded onto 8–10% resolving SDS-PAGE and transferred to Immobilon-FL (Sigma-Aldrich) PVDF membranes. Membranes were incubated at 4 °C overnight in primary antibodies diluted in Intercept Blocking Buffer (TBS) (Li-Cor, Lincoln, NE, USA) or Odyssey Blocking Buffer (Li-Cor) with Tween 20 (0.05%), as follows: total MARCKS (1:1000, 2C2, WH0004082M6, Sigma-Aldrich), phosphorylated MARCKS (pMARCKS; Ser152/156, 1:1000, 2741 S, Cell Signaling Technology, Danvers, MA, USA), DUSP6 (1:250 or 1:1000, EPR129Y, ab76310, Abcam, Cambridge, UK), total AKT (1:1000, 40D4, 2920S, Cell Signaling Technology), phosphorylated AKT (pAKT; Ser473, 1:100, D9E, 4060S, Cell Signaling Technology), pAKT (Ser473, 1:500, 736E11, 3787, Cell Signaling Technology), total ribosomal S6 (1:500, 54D2, 2317 S, Cell Signaling Technology), phosphorylated ribosomal S6 (pS6; Ser235/236, 1:1000, 2F9, 4856S, Cell Signaling Technology), total YAP (1:500, 1A12, 12395S, Cell Signaling Technology), phosphorylated YAP (pYAP; Ser127, 1:2000, 4911, Cell Signaling Technology), total ERK (1:2 000, 137F5, 4695S, Cell Signaling Technology), phosphorylated ERK (pERK; Tyr204, 1:250, E-4, SC-7383, Santa Cruz, Dallas, TX, USA), and MEK1/2 (1:500, L38C12, 4694S, Cell Signaling Technology). Membranes were washed with tris-buffered saline with 0.05% Tween 20 (TTBS) and incubated for one hour in secondary antibodies IRDye® 800CW Rabbit anti-Mouse, IRDye® 800CW Mouse anti-Rabbit, IRDye® 680LT Rabbit anti-Mouse or IRDye® 680LT Mouse anti-Rabbit (all at 1:20,000, Li-Cor), diluted 1:1 in Intercept Blocking Buffer (Li-Cor) or Odyssey Blocking Buffer (Li-Cor) with TTBS. Bands were imaged using the Odyssey imaging system. DUSP6 signals were normalised using REVERT total protein stain (Li-Cor), and phosphorylated proteins were normalised against their respective total proteins. Normalised protein data were log2 transformed, and independent experiments were averaged. Data were derived from three to four independent biological replicates.
Statistical analysis
All statistical analyses were performed using the GraphPad Prism 9.4 software (GraphPad, CA, USA) and statistical significance between groups was determined using one-way ANOVA with the Geisser–Greenhouse correction and Tukey’s or Sidak’s multiple comparison test, with individual variances computed for each comparison. Data was derived from at least three biological replicates, unless otherwise noted, and shown as mean ± SD. The D’Agostino and Pearson and Shapiro–Wilk test (suitable for smaller sample sizes) was used to assess data normality.


Comments (0)