
記住我
This study is an interventional case–control study investigating individuals with type 1 diabetes and healthy individuals. The study was approved by the Regional Committee on Health Research Ethics in the Capital Region of Denmark (H-19031592) and registered at ClinicalTrials.gov (NCT05095259). The study was conducted in accordance with the Declaration of Helsinki.
Study participantsA total of 27 male and female (self-reported) participants aged 18–70 years were included in this study. Eighteen participants with type 1 diabetes were recruited from the outpatient clinics at Nordsjællands Hospital, Hillerød, Denmark, and the Steno Diabetes Center Copenhagen, Copenhagen, Denmark, and nine healthy participants were recruited through local advertising and advertisement on social media. The diagnosis of type 1 diabetes was clinical and supported by low C-peptide concentration (<20 pmol/l) or absent C-peptide. Our study aimed to include individuals with type 1 diabetes who have varying expected daily exposure to hypoglycaemia. Participants who were already using a real-time CGM were allowed to continue using it during the study. The main exclusion criteria were use of β-blocking or β-activating agents, medical history of cardiovascular diseases, renal impairment or pregnancy at the onset of the study and during participation in the study. No participants were excluded based on sex and our study sample was selected to represent patients with frequent exposure to hypoglycaemia. Written informed consent was obtained. Participants were compensated for loss of work hours incurred through participation in the study.
Study protocolThe experiment was divided into one screening day and one trial day, at least 7 days apart. The investigation was performed at the Endocrine Research Unit at Nordsjællands Hospital, Hillerød, Denmark. The experiment was explained to the potential participants on the screening day, and inclusion and exclusion criteria were assessed. After obtaining written consent, participants underwent a clinical examination, and screening blood samples were drawn. For the participants with type 1 diabetes, CGMs were used a week before the study day to determine their hypoglycaemic exposure. The first four participants were equipped with a blinded iPro2 with Enlite sensor (Medtronic MiniMed, USA). However, because Medtronic cancelled support for its product, the last 14 participants with type 1 diabetes wore an unblinded Freestyle Libre 2 (Abbott Laboratories, USA). Before the experimental day, participants avoided alcohol intake, caffeine consumption and smoking for at least 24 h. Strenuous physical activity was avoided for 48 h, and participants fasted for at least 7 h prior to the experiment. As exposure to hypoglycaemia was an essential cofactor in the analyses, no measures were taken to avoid hypoglycaemia in participants with type 1 diabetes before the study day. On the experimental day, participants underwent a hyperinsulinaemic–euglycaemic clamp with stepwise adrenaline infusion.
Hyperinsulinaemic–euglycaemic clampInsulin was infused at a constant rate of 0.75 mU insulin kg−1 min−1 (Actrapid, Novo Nordisk, Denmark). The plasma glucose (PG) target of 4.0–6.0 mmol/l was maintained by a variable 10% glucose infusion. All participants were held under the hyperinsulinaemic–euglycaemic clamp for 1 h before administering adrenaline.
Adrenaline administrationInfusions of adrenaline (Adrenalin ‘SAD’, Amgros, Denmark) were given intravenously continuously throughout the experiment. Adrenaline dissolved in isotonic saline (154 mmol/l NaCl) was administrated at stepwise increasing infusion rates (10, 25 and 50 ng adrenaline kg−1 min−1), with every step lasting for 20 min. In cases where participants did not achieve euglycaemic targets at the end of a period, the adrenaline infusion rate was increased only after PG levels returned to euglycaemia (4.0–6.0 mmol/l).
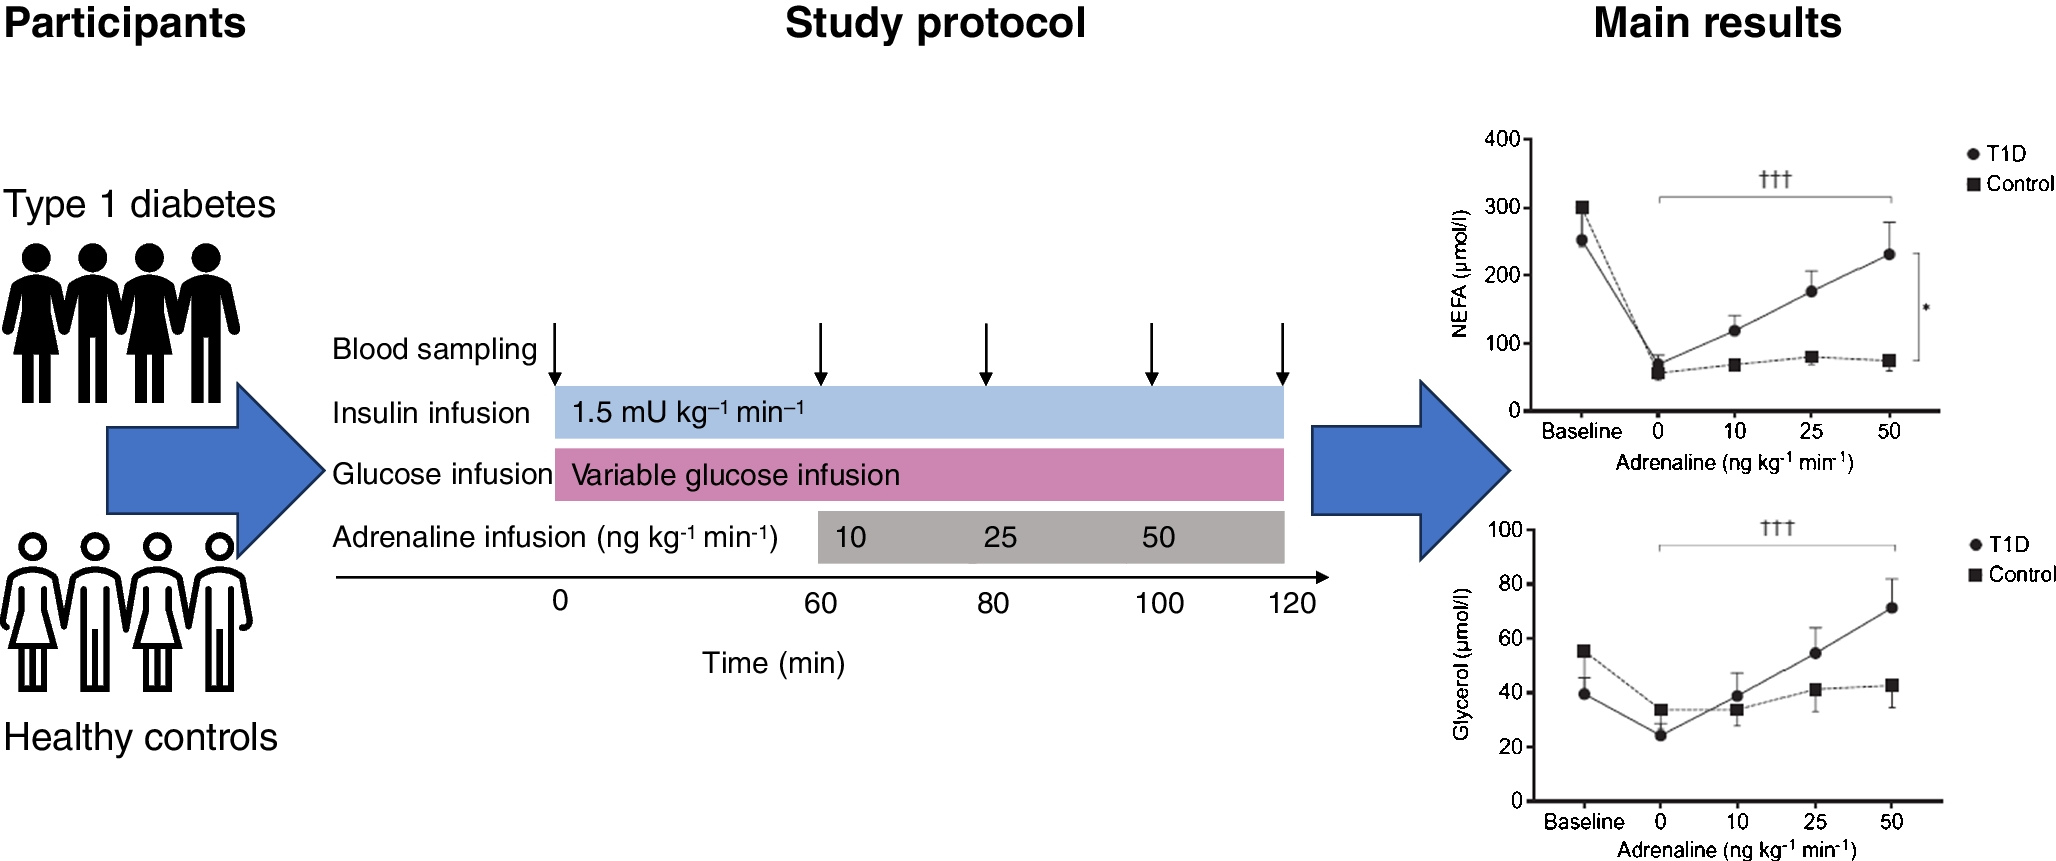
Biochemical analysisDuring the first hour of the clamp, PG was analysed every 10 min using a YSI 2300 analyser (YSI/Xylem, USA). During the adrenaline infusions, PG was measured every 5 min. Plasma samples for analysis of insulin, glucagon, adrenaline, noradrenaline (norepinephrine), NEFAs and glycerol were acquired before the clamp (baseline), 1 h from the start of the clamp (0 ng kg−1 min−1) and 20 min after each step of the stepwise adrenaline infusion (10–50 ng kg−1 min−1) (Fig. 1). All plasma samples were mixed with EDTA and placed in a dry ice box at first, and then stored in a −80°C freezer. ELISA kits were used to analyse insulin (catalogue no. 80-INSHU-E01.1, ALPCO, USA) and glucagon (catalogue no. 10-1271-01, Mercodia, Sweden); these kits use antibodies to determine the insulin and glucagon concentration using a colorimetric endpoint read spectrophotometrically by a SpectraMax iD3 (Molecular Devices, USA). Adrenaline and noradrenaline were quantified using a 2-CAT Plasma ELISAHigh Sensitive kit (Labor Diagnostika Nord, Germany), which extracts, acylates and enzymatically converts adrenaline and noradrenaline. Glycerol (Randox, UK) and NEFAs (NEFA C kit, Wako Chemicals, Germany) were used to perform an enzymatic transformation of the metabolites, which were measured using a COBAS autoanalyser (Roche, Switzerland). All analyses were performed according to the manufacturers’ instructions.
Fig. 1
Experimental design. All participants underwent a hyperinsulinaemic–euglycaemic clamp. Blood samples were taken before the clamp (baseline, time 0), 1 h after the start of the clamp (0 ng kg−1 min−1) and three times during the stepwise adrenaline infusion (10–50 ng kg−1 min−1). Blood samples for untargeted metabolomics profiling were taken before the initiation of the hyperinsulinaemic–euglycaemic clamp (baseline), 1 h after the start of the clamp and 20 min after the last infusion
Untargeted metabolomics profilingPlasma samples for metabolomics were acquired at baseline, 1 h from the start of the clamp and 20 min after the last infusion (50 ng adrenaline kg−1 min−1) using containers containing heparin. Plasma samples (30 μl) were mixed with 400 μl methanol, 10 μl internal standard mixture succinic acid-d4, glutamic acid-d5, valine-d8 and heptadecanoic acid-d33, Sigma Aldrich, USA), and incubated on ice for 30 min. Samples were then centrifuged (10,000 g, 3 min, 4°C), and 180 μl of the filtered extracts were evaporated to dryness and derivatised. A detailed description of the process has been presented previously [13]. A 7250 GC/Q-TOF instrument (Agilent, USA) equipped with a Gerstel MPS autosampler (Gerstel, Germany) was used to analyse the samples. Features from the quantitative ion peak areas of the data were matched against mass spectral libraries (in-house library, Fiehn library [14], GOLM DB [15], GNPS [16], HMDB [17] and MassBank Japan [18]).
CGM data assessmentsCGM data were analysed in accordance with current consensus guidelines from 2017 and 2019 [19, 20]. Hypoglycaemia episodes were defined as those persisting for a minimum of 15 min, and were categorised into two levels. Level 1 was defined as glucose levels below 3.9 mmol/l (<70 mg/dl), and level 2 was defined as glucose levels below 3.0 mmol/l (<54 mg/dl). We used two distinct variables of hypoglycaemia exposure: one based on the time below range (TBR) and the other based on the number of hypoglycaemic episodes per week (HEPW).
Endpoints and assessmentsPrimary endpoints were the incremental area under the PG curve (iAUC) as a measurement of glucose production, and plasma levels of NEFAs and glycerol as a measure of lipolysis before and after each step of adrenaline infusion. A secondary endpoint was the untargeted metabolomics profiling of the blood samples taken at baseline, 1 h from the start of the clamp and at the end of the adrenaline infusion.
Statistical analysisEndpoints were statistically assessed using linear mixed-effect models. Repeated measurements of PG iAUC, NEFA and glycerol were analysed from the start of the clamp until the end of the trial (0–50 ng kg−1 min−1). Data from untargeted metabolomics profiling were analysed at baseline, 0 and 50 ng kg−1 min−1 (Fig. 1). The p values for the results from the metabolomics data were adjusted for multiple testing and false discovery rate using the Benjamini–Hochberg method (pBH) [21].
When analysing PG iAUC, NEFA and glycerol, between-group assessments (type 1 diabetes vs healthy participants) were modelled using intervention, group and group–interaction as fixed effects and participant ID as a random effect and intercept with intervention. As we had not obtained multiple measurements for each participant, the statistical analysis was performed similarly for metabolomics data but without random intercept with intervention. The same models were used to analyse the intervention within both groups. Lastly, TBR and HEPW were used as variables in the model to explore the association with the endpoints. The statistical analyses were performed using SPSS Statistics (IBM, USA) and R software [22].
留言 (0)