
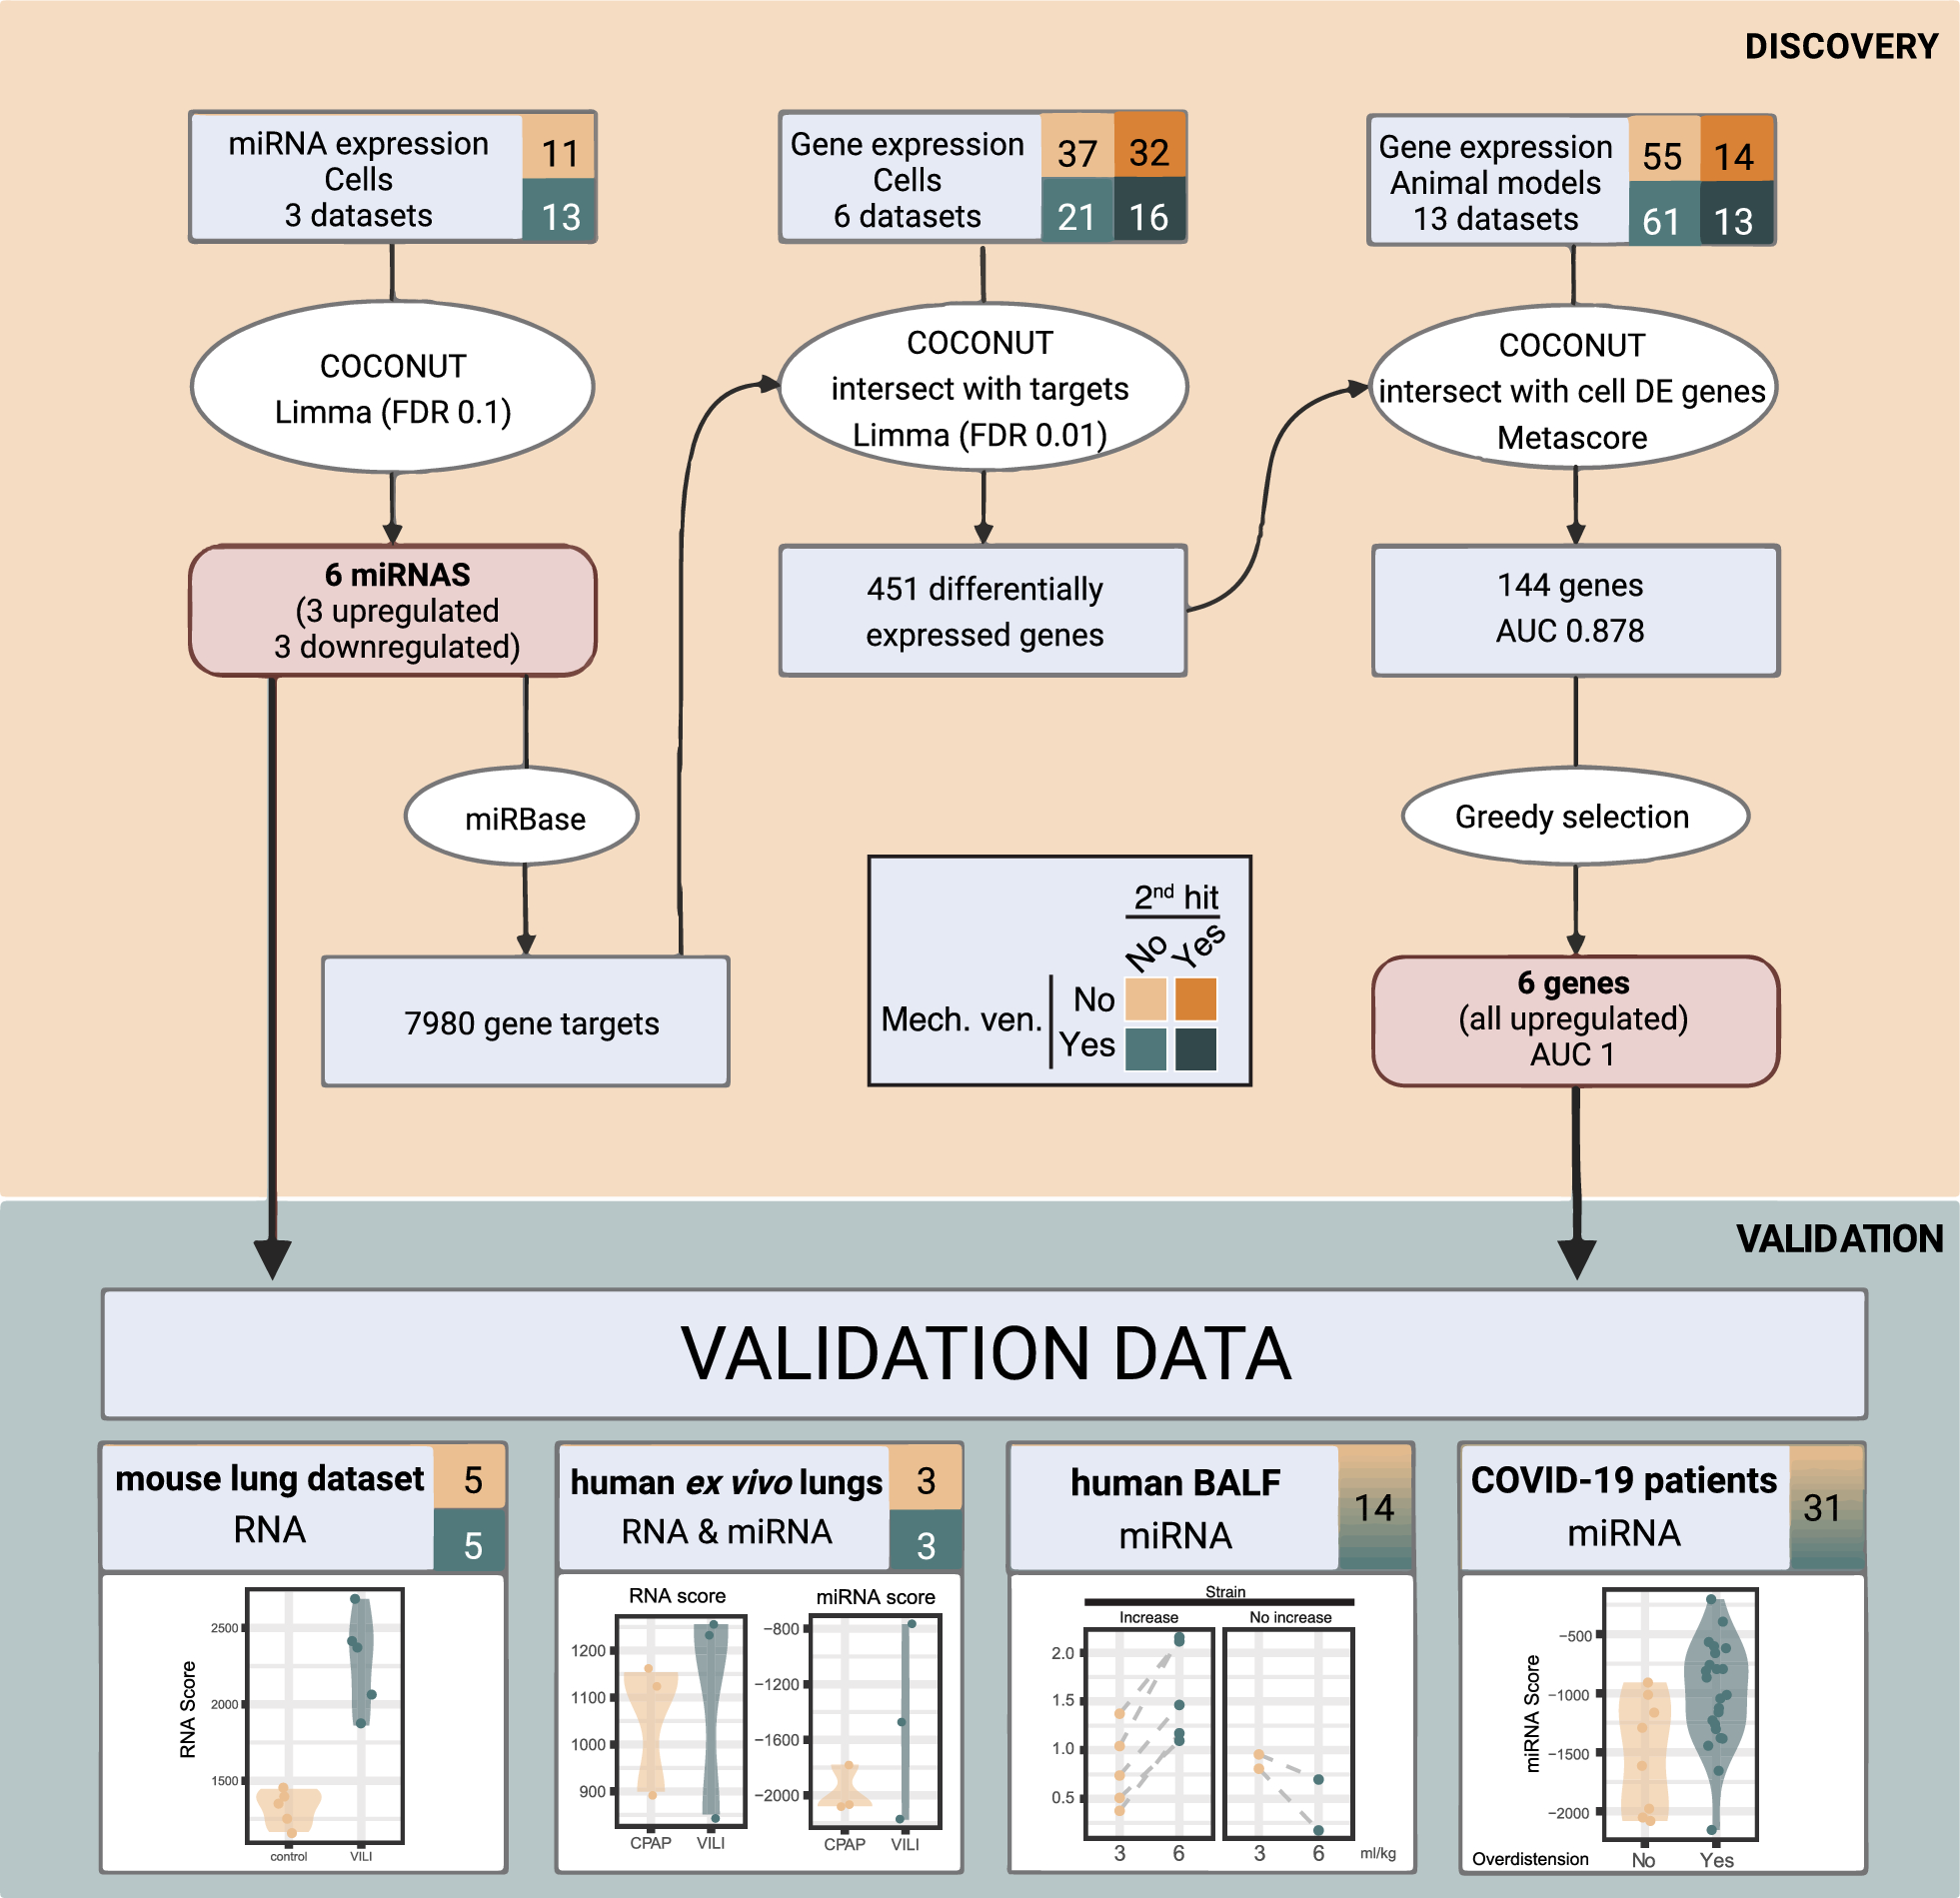
Remember me


For additional details, see online additional data, which is accessible from this issue’s table of content online at https://www.icm-experimental.springeropen.com.
Study design and patientsThis prospective interventional study was conducted at the ICU of the Erasmus Medical Center, Rotterdam, The Netherlands, from February 2022 to May 2023 (ClinicalTrials.gov: NCT05644418), after approval by the local Medical Ethics Committee. Adult cardiothoracic surgery patients requiring postoperative controlled mechanical ventilation in the ICU were screened and provided written informed consent prior to their surgery. Eligibility was reassessed at ICU arrival. Enrollment criteria were (1) invasive controlled mechanical ventilation, (2) FiO2 ≤ 50%, (3) positive end-expiratory pressure (PEEP) ≤ 10 cmH2O. Exclusion criteria were: (1) severe sputum stasis, (2) severe respiratory insufficiency (i.e., PaO2/FiO2 < 100 mmHg, or moderate-to-severe ARDS according to the Berlin definition [10]), (3) untreated pneumothorax, (4) hemodynamic instability, (5) contraindications to EIT monitoring and (6) an inner tube diameter ≤ 6 mm.
Data collectionAt enrollment, we collected sex, age, body mass index (BMI), ideal body weight (IBW), medical history, type of surgery, and hemodynamic status [noradrenalin dose, central venous oxygen saturation (ScvO2) and arterial-venous CO2 gap].
Continuous monitoringA conventional tube adapter (Ventinova Medical BV, The Netherlands) and flow sensor (Hamilton Medical, Switzerland) were placed in between the endotracheal tube and ventilator tubing. This tube adapter is an essential part of FCV (Evone ventilator, Ventinova Medical BV) and consists of a thin pressure probe with a length of approximately 25 cm from the endotracheal tube opening, hence allowing the measurement of intratracheal pressures. Output of this pressure probe and the flow sensor were connected to a dedicated signal acquisition system (MP160, BIOPAC Systems Inc., USA) for a synchronized recording of waveforms sampled at 200 Hz (AcqKnowledge, BIOPAC Systems Inc., USA) during the full protocol. To assess homogeneity of ventilation, continuous monitoring with electrical impedance tomography (EIT) was initiated with a belt placed at the 4th–5th intercostal space (PulmoVista 500, Dräger Medical, Germany).
Study proceduresThe study protocol was initiated directly after surgery when the patient arrived on the ICU. No recruitment maneuvers were performed after weaning from the cardiopulmonary bypass. Study steps are presented in Fig. 1 and lasted 30 min each. Arterial blood gases (ABG), central venous blood gases, SpO2, and hemodynamic and respiratory mechanics measurements were obtained at the end of each step. We aimed for a SpO2 of 95–100%, PaO2 < 15 kPa and end-tidal CO2 (EtCO2) and PaCO2 between 4.5 and 6.5 kPa throughout the protocol.
Baseline: PCV. Settings were optimized according to our local protocol (with PEEP as per a decremental PEEP trial aiming for the highest dynamic compliance (maximum PEEP 24 cmH2O), and tidal volumes of 6–8 mL/kg IBW) and were kept for at least 15 min to reach a stable condition before initiating continuous EIT, pressure and flow recordings for another 10 min at this step.
Step 1: FCV at ‘similar’ PCV settings. To directly compare FCV and PCV, the ventilation mode was switched to FCV with the same PEEP and FiO2 settings as baseline. Ppeak was titrated to reach the same tidal volumes as with PCV. Continuous set flow (determining the minute ventilation) was titrated to maintain a stable EtCO2. Inherent to the FCV working mechanism with an I:E ratio of 1:1, respiratory rate is the direct result of the combination of the set flow, the pressure difference between PEEP and Ppeak and the patient’s respiratory mechanics (resistance and compliance). Settings were kept for 30 min.
Step 2: FCV initial optimization. To maximally utilize the FCV working mechanism, FCV was optimized according to the ABG at the end of step 1 and the manufacturer’s instructions. PEEP was kept constant and FiO2 was adapted, if necessary, based on the PaO2 and target values mentioned at baseline. Ppeak was titrated in steps of 1 cmH2O to reach the highest dynamic compliance: if tidal volume increased more than expected (based on the dynamic compliance) when increasing the Ppeak, then Ppeak was further increased with 1 cmH2O. This sequence was repeated until tidal volumes did not increase more than expected (thus decreasing dynamic compliance) or until a safety limit of 10 mL/kg IBW was reached. Flow was adjusted to maintain PaCO2 within target values. Settings were kept for 30 min.
Step 3: FCV final optimization. Based on the ABG of step 2, flow and FiO2 were adjusted, if necessary, to maintain PaO2 and PaCO2 within target values.
Fig. 1
Study procedures with corresponding measurements
The patient’s management was then resumed as per local clinical protocol (with PCV settings similar as baseline).
Offline analysisComputation of parameters was performed for the steps baseline, step 1 and step 3.
Flow and pressure tracingsBreath-by-breath analysis of flow and intratracheal pressure was performed (Matlab 2021a, MathWorks, USA) for a period of 8–10 min at the end of each step. From the flow tracings, inspiratory time (Ti), RR, tidal volume (time-integral of inspiratory flow) and minute volume were calculated. Ppeak, total PEEP, and mean pressure were derived from the pressure waveforms. From the constructed pressure–volume (PV) loops (Additional file 1: Figure S1), the total energy per breath was computed as the integral of the PV loop times 0.098 (conversion to Joule), including the elastic dynamic and resistive components, but not the static part (unknown PEEP volume). The MP (Joule/min) was calculated by multiplying the total energy per breath by the RR. Dissipated energy was computed as the hysteresis area of the PV loop per breath (in Joule/Liter). For comparison, we also calculated the MP using bedside formulas for PCV [11] and using the simplified equation from Gattinoni [12] for FCV (which is similar to VCV during inspiration with its continuous flow).
EITPixel-level EIT data were obtained (PV500 Data Analysis SW130) and processed using a custom software developed in Python. At the end of each step, a stable period of at least 10 breaths was manually selected. For each pixel, an average inspiration was computed over this stable period (Additional file 1: Figure S2). Pixels with a tidal impedance change (∆Z) of at least 15% of the maximum pixel ∆Z were included in the analysis (Additional file 1: Figure S3), assuming significant contribution to the ventilated lung space and to minimize influence of cardiac-related artifacts, in line with [13].
Regions of interest (ROIs; ventral, mid-ventral, mid-dorsal and dorsal) were defined with a physiological approach utilizing the ventilated lung space: per patient, we first computed an average pixel impedance map of all three steps (baseline, step 1 and step 3). Then, ROIs were defined with each ROI representing 25% of the total variation in lung impedance of this average map (Additional file 1: Figures S4, S5). This computation allowed to assess subtle changes in regional EIT parameters between PCV and FCV.
For each step, the global ∆Z and regional ∆Z (per ROI) were calculated, as well as the global and regional static compliance (per ROI) (i.e., ∆Z/driving pressure, with driving pressure being the difference between plateau pressure and total PEEP derived from the intratracheal pressure tracings during both PCV and FCV), and the change in global end-expiratory lung impedance (∆EELI). Furthermore, we visualized and quantified the overall, spatial and temporal ventilation homogeneity as follows:
Global inhomogeneity index (GI) [14]; GI(%) = ((∑[x,y ∈ lung]|∆Zxy – Median(∆Zlung)|)/(∑[x, ∈ lung]∆Zxy)) × 100%; with ∆Zxy the impedance change of a ventilated pixel (x,y) and ∆Zlung the impedance change of the ventilated lung space.
Regional spatial volume distribution: first, to provide a visualization of the continuous regional inspiratory volume distribution, impedance waveforms per ROI were normalized over time and visualized as a percentage of the global ∆Z (Additional file 1: Figure S6). Second, regional intra-tidal impedance distribution was visualized by dividing the global inspiration into five parts of equal ∆Z and then computing the ∆Z for each ROI (Additional file 1: Figure S7) [15].
Regional ventilation delay index (RVDi) [16]: regional ventilation delay (RVD) was first computed as RVD = ΔtRVD/Δtmax–min, with ΔtRVD the time between the start of inspiration (as per the global ∆Z) until pixel ∆Z reached 40% of the maximal ∆Z; this was normalized to the global inspiration time (Δtmax–min) and expressed as percentage (Additional file 1: Figure S8). RVDi was then calculated as the standard deviation of all pixel RVDs; a lower RVDi reflects a more homogeneous temporal lung inflation.
Hemodynamics and gas exchangePaO2, PaCO2, PaO2/FiO2 ratio, central venous oxygen saturation (ScvO2), arterial-venous CO2 gap, ventilatory ratio [17], and noradrenalin dose were obtained per step.
Primary endpoint and secondary exploratory endpointsInitially, our primary endpoint (see Clinicaltrials.gov: NCT05644418) was the EELI difference between PCV and FCV (step 1) to assess direct changes in lung aeration. FCV at step 1 was chosen for comparison because subsequent FCV optimization could influence EELI due to tidal recruitment. Upon reviewing preliminary data halfway during the study, however, it became apparent that EELI changes could not be evaluated reliably due to EELI changes likely related to clinical fluid therapy in this selected cohort; this was confirmed after enrolling another five patients where continuous EIT monitoring for 2 h on PCV was performed (Additional file 1: Figures S9, S10). Since EELI changes can only be reliably assessed when hemodynamics and fluid administration are relatively stable over the period of interest—which was especially challenging in our population of interest, we changed our primary endpoint to the difference in MP between PCV and optimized FCV for a more robust evaluation. Secondary endpoints were the difference in minute volume, dissipated energy, ventilation distribution and homogeneity, and gas exchange between PCV and (optimized) FCV.
Sample sizeDue to the lack of comparator data, our sample size was based on the reported effect of FCV on minute volume in healthy pigs [18]. Using a matched pairs T-test approach (alpha, 0.05; power, 0.80) G*Power (Statistical Power Analyses, Universität Düsseldorf, Germany), the sample size was 6 patients. Since the effect size of FCV on other physiological parameters was unknown, we decided to enroll 10 patients in total. After changing the primary endpoint to the mechanical power, we did not re-power the sample size, because a good estimation of the difference in mechanical power between PCV and FCV could not be established using the previous literature, concerning that in those studies airway pressures during PCV and FCV were measured at different levels.
Statistical analysisStatistical analysis was performed using SPSS (IBM, Armonk, USA). Values are presented as median (interquartile range) and were tested for normality using the Shapiro–Wilk test. Steps were compared using the repeated measures ANOVA or the related-samples Friedman’s test depending on the distribution, and with Bonferroni correction for multiple comparisons. p < 0.05 was considered statistically significant.
Comments (0)