
記住我
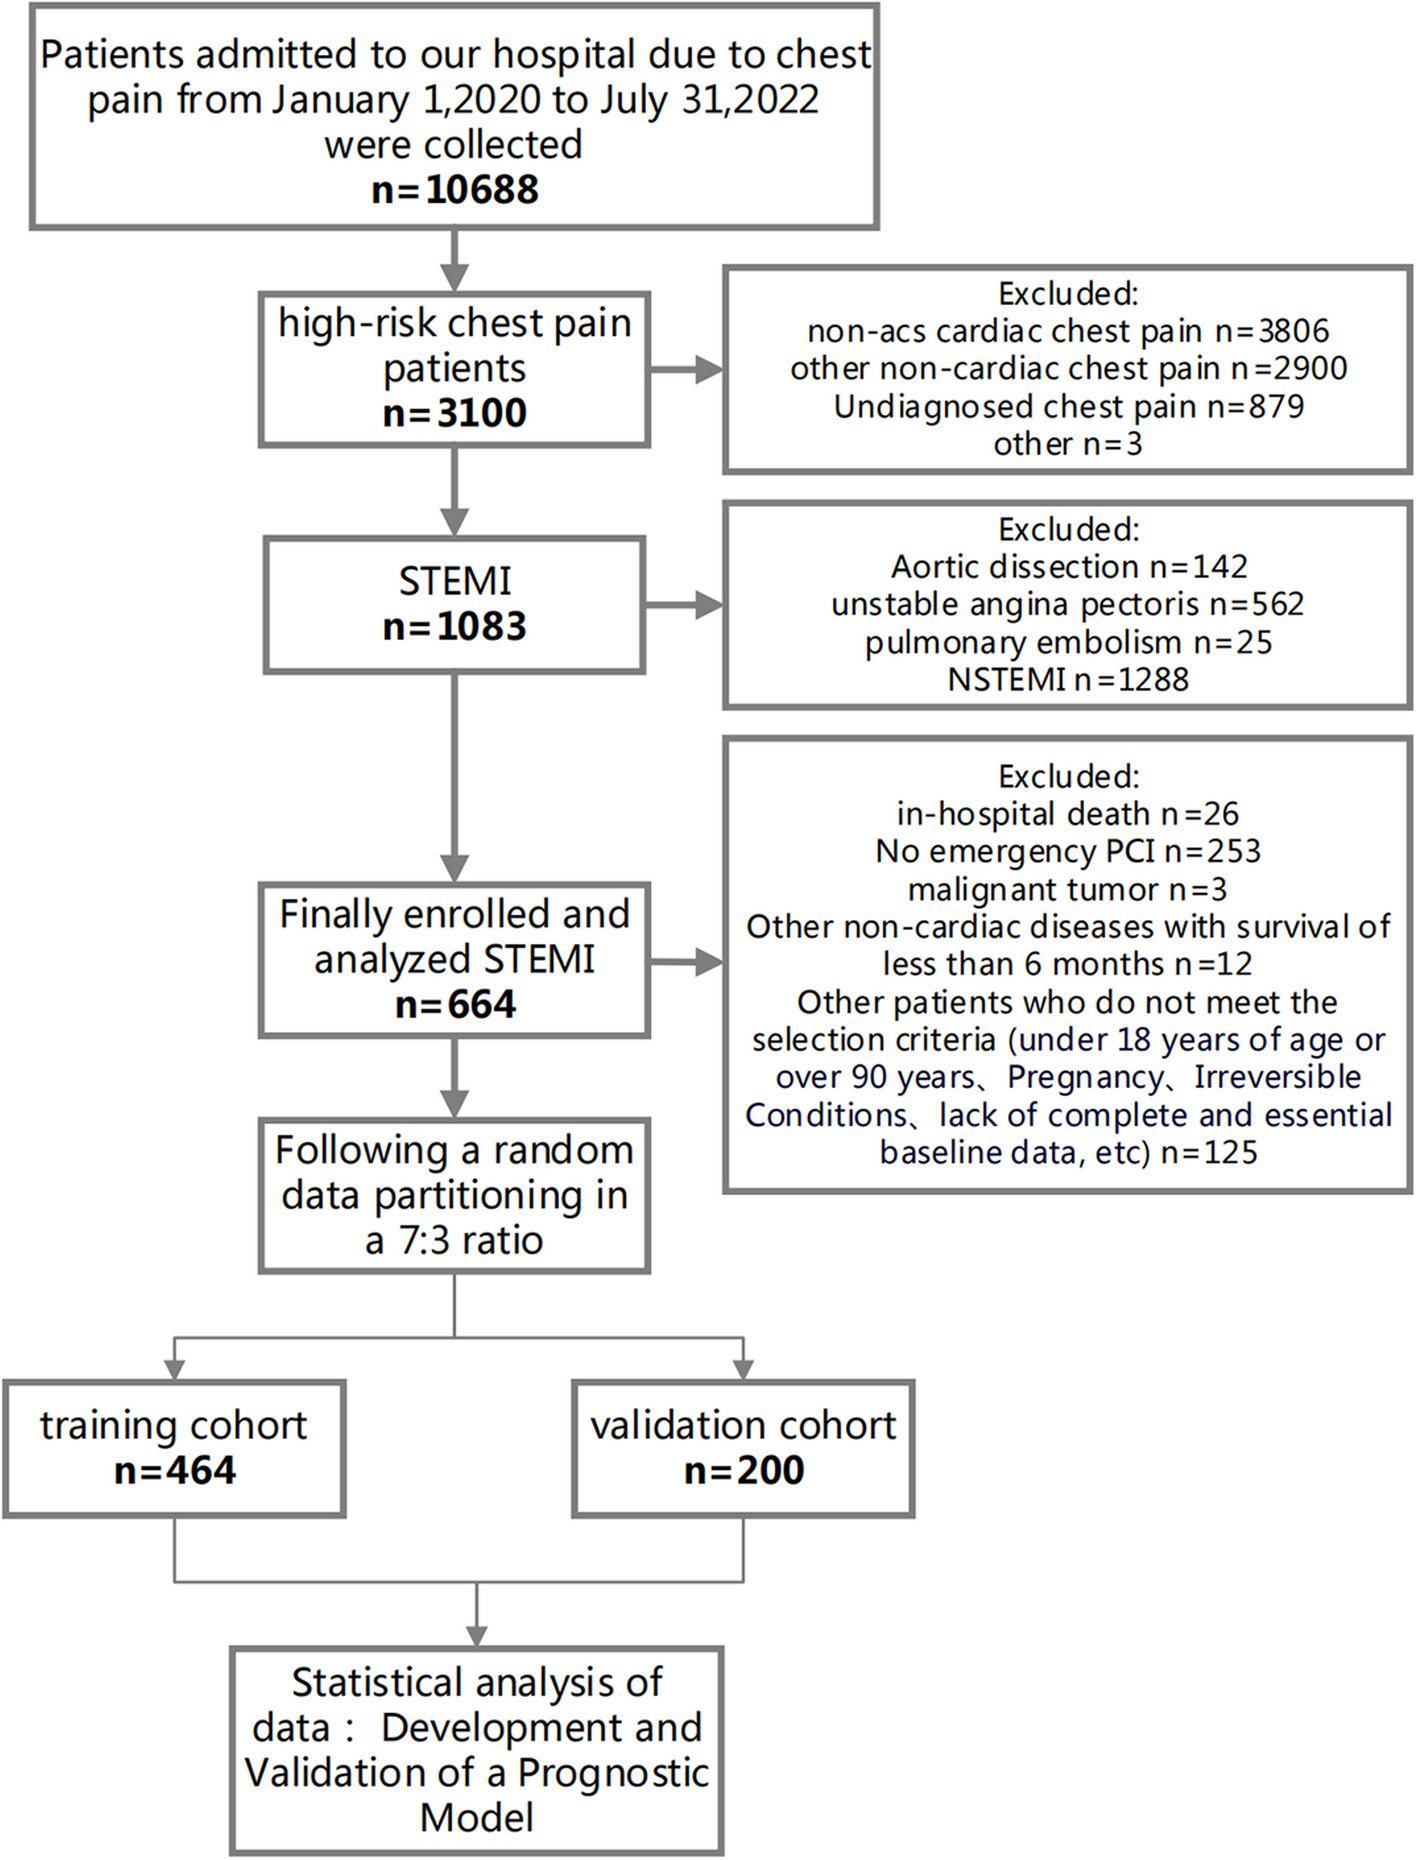


Table 1 delineates the baseline characteristics of patients with STEMI following PPCI intervention, categorized into the training cohort (N = 464) and the validation cohort (N = 200). The male constituent in both cohorts was 78.2% and 76.0%, respectively, with a P-value of 0.595. The mean age was reported at 63.0 years; the age distribution for the training cohort ranged between 55.0 and 71.0 years, while the validation cohort exhibited a similar range from 54.0 to 71.0 years (P = 0.855). Concerning historical medical data, both the training and validation cohorts demonstrated smoking prevalences of 56.9% and 57.0%, respectively. Therapeutically, β-blocker administration was observed in 88.8% of the training cohort and 89.0% of the validation cohort. In the context of PPCI procedural specifics, the Radial artery technique was the preferred method, with adoption rates of 93.3% in the training cohort and 92.5% in the validation cohort. Mortality indices for the training and validation cohorts were 5.82% and 4.00%, respectively, yielding a P-value of 0.439. A comprehensive data set, including statistical figures, P-values, and relevant terminologies, is tabulated in Table 1.
Table 1 Baseline characteristics of STEMI patients undergoing ppci in the mortality risk prognostic model development and validationTable 2 offers an incisive univariate Cox regression analysis elucidating the mortality risk post-discharge in STEMI patients who underwent PPCI intervention. A one-year increment in age emerged as a salient factor, correlating with an amplified mortality risk (HR = 1.062, 95% CI: 1.026–1.099, P = 0.001). History of cerebrovascular events, notably stroke, signaled a heightened death risk (HR = 2.45, 95% CI: 1.035–5.8, P = 0.042). Paradoxically, current smokers exhibited a relative attenuation in mortality risk (HR = 0.439, 95% CI: 0.201–0.959, P = 0.039). Renal compromise underscored a conspicuous escalation in mortality risk (HR = 3.775, 95% CI: 1.751–8.136, P = 0.001). The presence of atrial fibrillation corresponded with a marked surge in mortality risk (HR = 2.818, 95% CI: 1.067–7.447, P = 0.037). Significantly, mortality risk metrics within the Killip classification groups II-VI superseded that of the Killip classification group I (HR = 2.05, 95% CI: 1.529–2.747, P < 0.001). From a biochemical perspective, an increment of 100 units in NT-proBNP subtly paralleled with an augmented mortality risk (HR = 1.009, 95% CI: 1.005–1.013, P < 0.001). Every 1% reduction in left ventricular ejection fraction portended an elevated mortality risk (HR = 0.921, 95% CI: 0.887–0.956, P < 0.001). Medicinally, the administration of Beta-blockers (HR = 0.275, 95% CI: 0.12–0.629, P = 0.002) and agents from the ACEI/ARB/ARNI spectrum (HR = 0.16, 95% CI: 0.075–0.342, P < 0.001) resonated with a conspicuous decrement in mortality risk. The onset of hemodynamic shock was identified as a pivotal exacerbator of mortality risk (HR = 3.655, 95% CI: 1.384–9.657, P = 0.009). A more granular inspection of the data can be ascertained in Table 2.
Table 2 Univariate cox regression analysis of factors associated with mortality risk in STEMI patients undergoing PPCIThrough the application of the LASSO regression model, we discerned five pivotal prognostic factors robustly correlated with mortality outcomes: age, the Killip classification, NT-proBNP levels, LVEF, and the administration of ACEI/ARB/ARNI therapies, as illustrated in Fig. 2.
Fig. 2
LASSO Regression Coefficient Path and CV LASSO Regression Coefficient Path. A LASSO Regression Coefficient Path. B CV LASSO Regression Coefficient Path. (Note:The LASSO regression coefficient path displays how the coefficients of each variable change with increasing regularization parameter λ.The CV LASSO regression coefficient path illustrates the coefficients' behavior with λ tuned through cross-validation. Both paths provide insights into the impact of regularization on variable selection and coefficient estimation in the LASSO regression model)
Detailed outcomes from the COX multivariable regression analysis, derived from the quintet of predictors elicited by LASSO regression, are tabulated in Table 3:
Table 3 Multivariable cox regression analysis of factors associated with mortality risk in STEMI patients undergoing PPCIIncremental age, specified as each advancing year, was linked to a pronounced escalation in mortality risk (HR = 1.047, 95% CI: 1.012–1.083, P = 0.008). A heightened Killip classification substantially correlated with augmented mortality risk (HR = 1.515, 95% CI: 1.094–2.098, P = 0.012). For every centesimal augmentation in NT-proBNP levels, a discernible amplification in mortality risk was evident (HR = 1.005, 95% CI: 1.001–1.009, P = 0.045). In contrast, each percentage point elevation in the left ventricular ejection fraction (LVEF) was significantly allied with a decrement in death risk (HR = 0.952, 95% CI: 0.911–0.995, P = 0.028). Notably, patients undergoing ACEI/ARB/ARNI therapeutic regimens manifested a marked diminution in mortality susceptibility (HR = 0.200, 95% CI: 0.089–0.450, P < 0.001).
Employing time-dependent ROC curves, we elucidated the model's discriminative prowess. A C-index of 0.863 was observed in the training cohort, with a 95% CI ranging from 0.792 to 0.934. This corresponded to AUC values of 0.864 and 0.845 at the 12-month and 24-month intervals, respectively. A C-index of 0.888 was evident for the validation set, enveloped by a 95% CI of 0.821–0.955. This translated to AUC metrics of 0.785 and 0.812 for the 12 and 24 months, respectively (Fig. 3A and B). Post the execution of 500 bootstrap resampling iterations, the model's intrinsic stability was emphatically confirmed (Fig. 3C). Temporal calibration curves ratified impeccable model alignment across the 12- and 24-month benchmarks for the training and validation sets, thereby underscoring the model's robustness (Fig. 4).
Fig. 3
Area under the Receiver Operating Characteristic (ROC) curve and Bootstrap validation. A ROC curves for the training set at 12 months and 24 months. B ROC curves for the validation set at 12 months and 24 months. C Comparison of model stability between the original model and 500 rounds of Bootstrap validation on the training set
Fig. 4
Calibration curves at different time points. A Calibration curves for the training set at 12 months and 24 months. B Calibration curves for the validation set at 12 months and 24 months. (Note: The calibration curves depict the agreement between the predicted probabilities and the observed outcomes at different time points. The curves represent the performance of the predictive model in terms of calibration, indicating how well the model's predicted probabilities align with the actual probabilities)
The delineated time-dependent DCA and DCA nomogram across both cohorts unequivocally showcased the net clinical benefit, with the nomogram rendition distinctly surpassing the individual performance of the five discrete subsets (Fig. 5). Figure 6 portrays a delineative chart encapsulating the risk scores ascribed to each predictive variable. Elevated scores inherently resonate with an accentuated prospective mortality threat. Leveraging this schematic, patients were accorded scores and stratified into high and low-risk echelons. The Kaplan–Meier survival trajectories were then harnessed to evaluate the congruence across these cohorts. Indubitably, the risk quotient for mortality was attenuated in the low-risk segment compared to its high-risk counterpart across both data partitions (Fig. 7).
Fig. 5
Decision Curve Analysis (DCA) with Time and DCA Nomogram. A1: DCA with Time for the Training Set. B1: DCA with Time for the Validation Set. A2: DCA Nomogram for the Training Set. B2: DCA Nomogram for the Validation Set. (Note: The DCA curves in A1 and B1 illustrate the net benefit of the predictive model over a range of threshold probabilities at different time points for the training and validation sets. These curves provide insights into the clinical usefulness and added value of the model compared to alternative decision strategies. Additionally, the DCA nomograms in A2 and B2 provide a graphical representation of the decision curves, allowing for a more intuitive interpretation and application of the model's results)
Fig. 6
Nomogram for all-cause mortality risk prediction. (Note: The nomogram presents a visual tool for predicting the risk of all-cause mortality. It combines various predictors or risk factors into a comprehensive model that provides an individualized risk assessment. The nomogram allows for a simple and intuitive estimation of the probability of mortality based on the values assigned to each predictor. Clinicians can use this nomogram as a practical aid in risk assessment and shared decision-making with patients regarding appropriate interventions and management strategies)
Fig. 7
Rationality Analysis: Kaplan–Meier Survival Curves of High-Score and Low-Score Groups. A Rationality Analysis for the Training Set. B Rationality Analysis for the Validation Set. (Note: The Kaplan–Meier survival curves depicted in A and B demonstrate the differences in survival outcomes between the high-score and low-score groups. These curves serve as a rationality analysis to evaluate the predictive performance of the scoring system or model. The separation of the survival curves indicates the ability of the scoring system to stratify patients into distinct risk groups. This analysis provides insights into the reliability and validity of the scoring system in predicting survival outcomes and aids in assessing its clinical utility)
In our analysis presented in Supplementary Table 1, we observed a significant reduction in mortality among STEMI patients using ACE inhibitors (ACEI), angiotensin receptor blockers (ARB), or angiotensin receptor-neprilysin inhibitors (ARNI). This effect was evident in both groups classified by left ventricular ejection fraction (LVEF), with hazard ratios indicating a substantial protective effect of these medications on survival.
Temporal validationTo address the potential for overfitting and to assess the temporal generalizability of our model, a temporal validation was performed. Supplementary Fig. 1 illustrates the receiver operating characteristic (ROC) curves derived from the predictive model. Panel A presents the ROC curves for mortality predictions at 12 and 24 months post-discharge in the training cohort, which included 480 patients from the 2020–2021 dataset. The model demonstrated good predictive ability with an AUC of 0.819 (95% CI: 0.724–0.914) for 12-month mortality and an AUC of 0.836 (95% CI: 0.761–0.911) for 24-month mortality.
Due to the limited follow-up time available for the validation cohort, which consisted of 184 patients from the 2022 dataset, the model's performance was assessed using shorter-term outcomes. Panel B therefore shows the ROC curves for 6-month and 12-month mortality, yielding AUC values of 0.796 (95% CI: 0.603–0.988) and 0.877 (95% CI: 0.642–1.112), respectively. The shortened follow-up period for the validation cohort necessitated the use of these interim time points for model assessment.
Comparison of two modelsSupplementary Fig. 2 compares the predictive accuracy of two models developed via LASSO regression, using ROC curves for the training set (Panel A) and the validation set (Panel B). Model A, defined by the '1se' criterion, demonstrated an AUC of 0.875 in the training set and 0.763 in the validation set, indicating robustness across both datasets with essential predictors: age, Killip classification, ACEI/ARB/ARNI, ntpro-BNP/100, and LVEF. Model B, the 'min' full model, showed comparable AUCs in the training (0.867) and validation (0.765) sets. The performance similarity in both datasets suggests Model A's parsimony is effective for clinical application without compromising predictive ability.
Model evaluation metricsSupplementary Table 2 in our manuscript details critical model evaluation metrics on both training and validation sets. Notably, the model shows a strong Area Under the Receiver Operating Characteristic Curve (AUC) with 0.88 on the training set and 0.795 on the validation set, indicating its robust predictive ability. The accuracy rates of 0.909 (training) and 0.85 (validation) further affirm the model's effectiveness. Additionally, Sensitivity and Specificity values demonstrate balanced performance in identifying positive and negative cases. The Positive and Negative Likelihood Ratios (PLR and NLR) along with Predictive Values (PPV and NPV) underscore the model's precision in predicting outcomes. These metrics collectively highlight the model's reliability and potential applicability in practical scenarios.
留言 (0)