
記住我
Several surface markers have been associated to human IL-10+ Breg cells; however, the presence of IL10 messenger RNA and IL-10 expression remains the hallmark of human Breg cell identification. Stimulation with CpGC, a TLR ligand, expands Breg cells to 10–20% of total B cells (Supplementary Fig. 1a,b). To assess the metabolic pathways preferentially used by Breg cells, B cells were negatively purified from healthy peripheral blood mononucleated cells (PBMCs) and stimulated with CpGC, previously shown to promote the expansion of IL-10+ Breg cells within CD24hiCD38hi (immature), CD24intCD38int (mature-naive), CD24+CD38lo (memory) and CD24lo/−CD38hi (plasmablasts) B cell subsets (Supplementary Fig. 1c,d), together with inhibitors of different metabolic pathways or under nutrient starvation and/or repleting conditions (schematic in Fig. 1a). Inhibition of glycolysis by 2-deoxyglucose (2-DG) (a glucose analog) or FAO by etomoxir (carnitine palmitoyltransferase I (CPT1) inhibitor) or malonyl Co-A (allosteric inhibitor limiting uptake of fatty acids by mitochondria) did not alter Breg cell intracellular expression or secretion of IL-10 (Fig. 1b and Extended Data Fig. 1a). As 2-DG has been shown to have off-target effects and to further exclude the role of aerobic glycolysis in Breg cell differentiation, B cells were cultured in glucose-free media, or in glucose-free media replenished with high-glucose concentrations. B cells grown under these conditions did not show alteration in the IL-10+ Breg cell frequencies compared with the control group (Extended Data Fig. 1b). Replacement of glucose with galactose, a respiratory substrate known to slow glycolysis and to promote a compensatory increase in OXPHOS18, boosted IL-10+ B cell differentiation compared with the control group (Extended Data Fig. 1c).
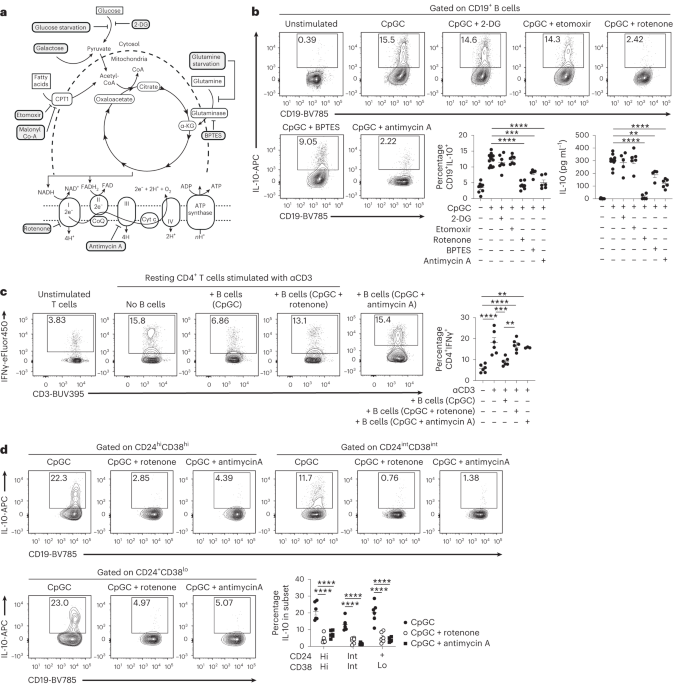
Fig. 1: ETC activity is critical for differentiation of IL-10+ B cells.
a, Schematic overview of cellular metabolism and the inhibition of glycolysis (2-DG, glucose starvation), FAO (etomoxir, malonyl co-A), glutamine metabolism (BPTES, glutamine starvation) and Complexes I and III of the ETC (rotenone and antimycin A, respectively). b, Representative contour plots and cumulative data show frequencies of CD19+IL-10+ B cells and IL-10 secretion following 72-h CpGC stimulation of isolated B cells with and without 1 mM 2-DG, 10 μM etomoxir, 1 μM rotenone, 500 nM BPTES or 10 nM antimycin A. **P = 0.001, ***P = 0.0002, ****P < 0.0001; data are representative of four independent experiments. c, Representative contour plots and cumulative data show the frequencies of CD3+CD4+IFNγ+ T cells after co-culture of CD4+ T cells stimulated with anti-CD3, with B cells preconditioned with CpGC, CpGC and rotenone, or CpGC and antimycin A. n = 6 (n = 3 for antimycin A) biologically independent samples examined over two independent experiments. Top to bottom, **P = 0.0024, ****P < 0.0001, ***P = 0.0006, ****P < 0.0001, **P = 0.0031. d, Representative contour plots and cumulative data show frequencies of CD19+IL-10+ B cells within transitional (CD19+CD24hiCD38hi), mature-naive (CD19+CD24intCD38int) and memory (CD19+CD24+CD38lo) gates following stimulation of isolated B cells for 72 h with CpGC, with and without 1 μM rotenone. n = 6 biologically independent samples examined over two independent experiments. ****P < 0.0001. Data were analyzed by one-way ANOVA followed by Tukey’s multiple comparisons test (b,c) or two-way ANOVA followed by Sidak’s test for multiple comparisons (d). Error bars are shown as mean ± s.e.m. Hi, high; Int, intermediate; Lo, low. Panel a created with Biorender.com.
Our findings, showing that ‘forcing’ B cells to utilize galactose expands Breg cells, suggest a reliance on OXPHOS for Breg cells to meet their energy demands. Given the importance of the mitochondrial respiratory chain for OXPHOS, we questioned if different complexes of the electron transport chain (ETC) pivot Breg cell differentiation and function. Inhibiting OXPHOS with rotenone (Complex I inhibitor) ablated B cell IL-10 expression and secretion, and partial inhibition of OXPHOS following glutamine metabolism inhibition, by BPTES or culture in glutamine-free media, partially reduced IL-10+ Breg cell frequencies (Fig. 1b and Extended Data Fig. 1d). Stimulation of B cells with the ETC Complex III inhibitor, antimycin A, impaired IL-10 intracellular expression and secretion, confirming the dependency of Breg cells on OXPHOS metabolism (Fig. 1b). There were no differences in B cell viability under these culture conditions (Extended Data Fig. 1e).
ETC blockade with rotenone or antimycin A inhibited B cell IL-10 expression after stimulation with TLR7 ligand R848 or CD40L, stimuli previously found to be important in the differentiation of Breg cells3,19. Stimulation with LPS, αBCR or IL-21 alone failed to induce IL-10+ Breg cell differentiation (Extended Data Fig. 1f).
The reduction in IL-10 expression and production, observed following inhibition of Complex I and Complex III, was accompanied by a significantly reduced ability to suppress IFNγ production by autologous anti-CD3-activated CD4+ T cells compared with vehicle-treated B cells (Fig. 1c). Additionally to IL-10, rotenone and antimycin A suppressed the expression of IL-35 and the inactive form of TGFβ (latency-associated peptide) (Extended Data Fig. 2a,b), immunoregulatory cytokines previously associated with Breg cell function1. The ability of B cells to produce pro-inflammatory cytokines including TNF, IL-6 and GM-CSF remained unaltered following OXPHOS inhibition (Extended Data Fig. 2c–e).
IL-10+CD24hiCD38hi transitional, IL-10+CD24intCD38int mature and IL-10+CD24+CD38lo memory B cell frequencies were equally reduced after rotenone and antimycin stimulation (Fig. 1d; gating strategy for B cell subsets after stimulation is shown in Supplementary Fig. 1c). We confirmed that the inhibition of IL-10+ Breg cell differentiation by rotenone was independent of their stage of maturation as sorted transitional, mature and memory B cells cultured with both CpGC and rotenone failed to differentiate into IL-10+ Breg cells (Extended Data Fig. 2f; Supplementary Fig. 1e shows the gating strategy for cell sorting). Our results confirm previously published data in mice showing that glycolysis, glutamine metabolism and OXPHOS are required for CD24lo/−CD38hiBlimp1+ plasmablast differentiation, as inhibition of glutamine metabolism by BPTES, ETC inhibition by rotenone or antimycin A, and glucose or glutamine starvation all reduced CD24lo/−CD38hiBlimp1+ plasmablast frequencies (Extended Data Fig. 3a–f)10,11.
High concentrations of ROS inhibit IL-10+ Breg cell differentiationA major by-product of the ETC and OXPHOS is ROS; in addition, Complex I inhibition has been associated with a burst of mitochondrial ROS (Extended Data Fig. 4a), and ROS levels that exceed the capacity of the cellular antioxidant defense system induce oxidative stress20. Therefore, a tight control of ROS production is essential for the maintenance of cell functions. TLR signaling has also been shown to promote higher ROS production, for example, in macrophages21.
To verify whether higher levels of ROS are detrimental for Breg cell differentiation, we stimulated B cells with increasing concentrations of CpGC and measured, respectively, the levels of cytoplasmic (CELLROX Orange) and mitochondrial (MitoSOX) ROS, and IL-10+ Breg cell frequencies. Increased stimulation with CpGC led to incremental increases in cytoplasmic and mitochondrial ROS in B cells (Fig. 2a,b). IL-10+ Breg cell frequencies increased up to 1 μM CpGC; however, at higher concentrations, IL-10 expression was significantly reduced compared with 1 μM CpGC (Fig. 2a,b and Extended Data Fig. 4b). Although higher concentrations of CpGC, leading to increased levels of ROS and decreased IL-10+ Breg cell frequencies, did not alter the overall CD24hiCD38hi transitional, CD24intCD38int mature and CD24+CD38lo memory B cell or CD24lo/−CD38hiBlimp1+ plasmablast frequencies (Supplementary Fig. 2a,b), the IL-10+ Breg cell frequencies within each of these subsets were significantly reduced after exposure to 5 μM CpGC compared with 1 μM CpGC (Extended Data Fig. 4c), with a net effect of a reduced ratio of IL-10+ Breg cells to IL-10− plasmablasts (Extended Data Fig. 4d).
Fig. 2: High ROS levels impair Breg cell differentiation.
a,b, Histograms and cumulative data show cytoplasmic ROS levels (CELLROX) (a) and mitochondrial ROS levels (MitoSOX) (b) following stimulation of isolated B cells with increasing concentrations of CpGC for 72 h, with paired CD19+IL-10+ B cell frequencies. n = 5 biologically independent samples, examined over two independent experiments. c, Representative contour plots and cumulative data show frequencies of CD19+IL-10+ B cells after stimulation of isolated B cells with 0.1–5 μM CpGC, with and without 1 mM NAC or 10 μM MitoTempo. n = 6 (NAC), n = 4 (MitoTempo) biologically independent samples examined over three independent experiments. In graph order, **P = 0.0053, ***P = 0.0001, **P = 0.0012, ****P < 0.0001, **P = 0.0067, ****P < 0.0001, ***P = 0.0002, ***P = 0.0003. d, Representative contour plots and cumulative data show frequencies of CD19+IL-10+ B cells after stimulation with 0.1 μM or 1 μM CpGC, with and without low (0.2 μM) or high (10 μM) levels of H2O2. n = 3 biologically independent samples, examined over two independent experiments. *P = 0.0384, ***P = 0.0006, *P = 0.0225. Data were analyzed by two-way ANOVA followed by Sidak’s test for multiple comparisons. Error bars are shown as mean ± s.e.m. MFI, median fluorescence intensity.
Next, we assessed whether ROS levels act as a rheostat, permitting (at low ROS levels) or inhibiting (at higher ROS levels) the differentiation of IL-10+ Breg cells. B cells were cultured with a scalar range (0.1–5 μM) of CpGC alone or combined with N-acetylcysteine (NAC) (1 mM), which here we report to inhibit cytosolic and not mitochondrial ROS in B cells (Extended Data Fig. 4e,f), or with MitoTempo (10 μM), a selective inhibitor of mitochondrial ROS22,23,24. NAC and MitoTempo significantly reduced, respectively, cytoplasmic and mitochondrial ROS, at all CpGC doses tested (Extended Data Fig. 4e,g). Low levels of cytoplasmic and mitochondrial ROS, produced upon 0.1–0.5 μM CpGC challenge, play a crucial role in supporting the differentiation of Breg cells, as indicated by a marked reduction in Breg cell frequencies during culture in the presence of NAC or MitoTempo (Fig. 2c). In contrast, inhibition of cytoplasmic or mitochondrial ROS in B cells stimulated with 1 μM or 5 μM CpGC significantly increased IL-10 expression by B cells compared with the control group (Fig. 2c), confirming that ROS levels need to be tightly controlled to achieve an optimal Breg cell output.
Our data indicate that stimulation with low-dose CpGC (0.1 μM) fails to induce robust IL-10+ Breg cell differentiation. To investigate whether this deficiency is associated with insufficient ROS production, under these experimental conditions, we stimulated B cells with 0.1 μM CpGC and supplemented them with exogenous H2O2 (10 μM represents the highest dose that could be used without impairing cell survival). Only the addition of low levels of H2O2 (200 nM) increased IL-10+ Breg cell frequencies compared with 0.1 μM CpGC alone, whereas the combination of 1 μM CpGC with both low and high H2O2 levels (10 μM) significantly reduced IL-10+ Breg cell frequencies (Fig. 2d).
Single-cell RNA sequencing confirms IL-10+ Breg cell metabolismTo confirm that all IL-10+ Breg cells favor OXPHOS over other metabolic pathways, we performed single-cell RNA sequencing (scRNA-seq) on ex vivo and in vitro CpGC-stimulated isolated B cells and looked for the expression of metabolism-related genes by IL10-expressing B cells. Dimensional reduction using the Seurat package revealed seven distinct clusters ex vivo, mainly based on the expression of genes marking B cell maturation stages as previously shown25 (Fig. 3a and Supplementary Fig. 3a). Clusters identified ex vivo and after CpGC stimulation included transitional and naive (CD24+CD38+CD27−IGHD+IGHM+), memory (CD27+CD24+CD38lowIGHM+/IGHG1/IGHA2) and double-negative B cells (IGHD−CD27−ITGAX+FCRL5+). Plasmablasts/plasma cells were readily identifiable by the expression of PRDM1, which expanded after CpGC stimulation (Supplementary Fig. 3a).
Fig. 3: scRNA-seq reveals an enrichment of OXPHOS-associated genes in IL10-expressing B cells.
a, UMAPs showing B cell clusters and phenotypic identities ex vivo (left) and following stimulation for 72 h with CpGC (right). b, Dot plots showing the expression of indicated genes in each subset ex vivo and following CpGC stimulation. c, UMAP and graph showing analysis of genes changing expression along the inferred trajectories through cluster C2 and activated naive into C3 and enriched biological processes. d, UMAP and Venn diagram show common genes upregulated in IL10+ C3 and IL10+ activated naive B cells compared with IL10− B cells in remaining clusters (including transitional, naive, IgM memory, classical memory, double-negative and plasma cells), and genes upregulated in IL10+ B cells within these remaining clusters compared with the IL10− counterpart. e, UMAPs showing B cells scored according to the expression of panels of genes associated with OXPHOS, glycolysis and FAO. Red and high contour density indicate cells with high scores. GO:BP, Gene Ontology:Biological Process.
We found that 1.9% of total unstimulated B cells expressed IL10, and IL10+ Breg cell distribution was across different clusters and independent of maturation stage, thus confirming the heterogeneity of Breg cells previously described by flow cytometry (Fig. 3b). We identified ten clusters of B cells following CpGC activation which expressed differing levels of IL10 (Fig. 3a,b). In response to CpGC, we reported the differentiation of three expanded clusters which were scarcely present ex vivo (C1, C2, C3), containing, respectively, 61%, 75% and 97% IL10-expressing B cells (Fig. 3a,b). C1, C2 and C3 expressed CD24, CD38, IGHM and IGHD, CD27+ and TNFRSF13B (encoding TACI), suggesting that these clusters have derived from several B cell subsets (Supplementary Fig. 3a). We observed the expansion of a population of naive B cells expressing markers of activation (activated naive B cells) which was 82% IL10+ (Extended Data Fig. 5a). B cells in C3 and in the activated naive cluster expressed higher levels of AHR, LAG3, TGFB1, AKT1, HIF1A and NFKB1, compared with the other clusters, further confirming their Breg cell identity (Fig. 3b). In addition to IL10, B cells in the activated naive cluster following CpGC stimulation expressed higher levels of TNF and IL6, and CD274 (encoding PD-L1), compared with other clusters (Extended Data Fig. 5a). CpGC stimulation induced the expansion of five plasmablast clusters, four of which expressed IL10+ (Extended Data Fig. 5b).
Trajectory analysis inferred multiple pathways seeding into C2, and subsequently into a single path leading to C3, and into plasmablasts/plasma cells. The activated naive B cell cluster formed a single trajectory leading to C3 (Fig. 3c). We compared the top 1,000 genes changing expression along each of these inferred trajectories which highlighted a common signature of 377 genes. Pathway analysis revealed an enrichment of processes primarily associated with mitochondrial respiration, supporting the high mitochondrial metabolic requirement of Breg cells (Fig. 3c).
To identify a core gene signature expressed in all of the Breg cells populating the different clusters, we first compiled a list of genes upregulated in C3 and activated naive clusters versus IL10− B cells, genes that were also upregulated in IL10+ B cells in the other clusters compared with their IL10− counterparts. This revealed a signature of 197 genes commonly expressed in C3, in activated naive clusters and in IL10+ Breg cells populating the other clusters. These common genes included those previously associated with OXPHOS and the antioxidant response (including COX5A, TXN, FDX1, TYMS) (Fig. 3d; gene signature is reported in Supplementary List 1).
Next, we scored each cell based on the expression of panels of genes associated with OXPHOS, glycolysis and FAO. High OXPHOS gene scores were enriched within the C2 and activated naive, C3, and plasmablasts. High glycolysis scores were enriched in the C1 cluster (Fig. 3e). These results confirm distinct metabolic programming in Breg cells compared with non-Breg cells, with IL10+ Breg cells enriched for gene signatures associated with mitochondrial respiration and the antioxidant response.
Trx favors IL-10+ Breg and restrains effector B cell differentiationTo identify potential gene pathways involved in the regulation of OXPHOS and the maintenance of homeostatic levels of ROS needed for Breg cell differentiation and function, we searched the Breg cell signature of 217 genes for those that have been previously shown to regulate the generation of ROS from the ETC. Among the most differentially expressed genes, we identified an upregulation of the antioxidant oxidoreductase thioredoxin (TXN) encoding Trx, a molecule present in the nuclei, mitochondrial membrane and cytoplasm, in the IL10+ Breg cell populations, mirrored by an upregulation of its inhibitor, thioredoxin-interacting protein (TXNIP), in the IL10− population (Fig. 4a).
Fig. 4: Thioredoxin expression is enriched in IL-10+ Breg cells and requires OXPHOS.
a, UMAP plots show the distribution of TXN+ and TXNIP+ B cells. b, Pseudotemporal gene expression profiles showing the expression levels of TXN and TXNIP with pseudotime within the trajectories seeding C3. c, Representative contour plot, histogram and cumulative data show IL-10 expression following 72-h stimulation with CpGC, and Trx expression and frequencies of CD19+Trx+ B cells within IL-10+ and IL-10− B cell subsets. n = 9 biologically independent samples examined over three independent experiments. ****P < 0.0001. d, Representative contour plots and cumulative data show frequencies of CD19+Trx+IL-10+ B cells following stimulation with CpGC for 72 h with and without 1 μM rotenone. n = 6 biologically independent samples examined over two independent experiments. ***P = 0.001. Data were analyzed by two-tailed paired t-test. Error bars are shown as mean ± s.e.m.
TXN expression progressively increased, while TXNIP decreased, along the pseudotime axis underlying the inferred trajectory, and TXN expression was concentrated within C3 and plasmablasts while TXNIP was reciprocally expressed in all remaining clusters (Fig. 4b). This progressive upregulation of TXN was not observed in the remaining inferred trajectories seeding classical memory, IgM memory (which includes cells in C1) and double-negative B cell clusters (Extended Data Fig. 5c). By flow cytometry we confirm that IL-10+ Breg cells contain higher frequencies of Trx+ B cells compared with the IL-10− B cell population (Fig. 4c). Stimulation with CpGC, CD40L or TLR7 ligand R848 alone, or CpGC in combination with IFNα, BAFF or anti-BCR, signals pivotal in Breg cell differentiation26, increased Trx+IL-10+ Breg cell frequencies (Extended Data Fig. 5d). Although the expression of mitochondrial thioredoxin TXN2, among different clusters, to a certain extent mirrored that of TXN (Extended Data Fig. 5e), at the protein level there were no differences in the frequencies of Trx2+ cells between IL-10+ and IL-10− B cell subsets (Extended Data Fig. 5f,g).
To assess whether the ETC regulates Trx+IL-10+ Breg cell frequencies, we cultured B cells with CpGC alone or with rotenone. Trx+IL-10+ Breg cell frequencies were significantly decreased following stimulation of B cells with rotenone (Fig. 4d), but not when co-cultured with inhibitors of glycolysis (2-DG), FAO (etomoxir) or glutamine metabolism (BPTES) (Extended Data Fig. 5h), demonstrating that Trx+IL-10+ Breg cells depend on OXPHOS.
Next, we tested whether Trx activity was necessary for the differentiation of IL-10+ Breg cells. B cells were cultured with CpGC and TrxR inhibitors D9 and myricetin (schematic in Fig. 5a). Addition of D9 or myricetin to CpGC-stimulated B cells significantly reduced IL-10+ Breg cell frequencies and IL-10 secretion compared with B cells stimulated with CpGC alone or CpGC with vehicle control (Fig. 5b and Extended Data Fig. 6a). Neither D9 nor myricetin altered B cell viability, and D9 did not alter B cell proliferation (Extended Data Fig. 6b,c).
Fig. 5: Trx is required for Breg cell expansion and suppressive ability.
a, Schematic of the Trx system with the target of D9 and myricetin indicated. b, Representative contour plots and cumulative data show frequencies of CD19+IL-10+ B cells (n = 13 biologically independent samples examined over four independent experiments) and IL-10 secretion (n = 9 biologically independent samples examined over three independent experiments) following culture of B cells with CpGC for 72 h, with and without vehicle control or 100 nM D9. ****P < 0.0001, ****P < 0.0001, ***P = 0.0005, ***P = 0.0007. c, Representative contour plots and graph show frequencies of CD19+IL-10+TNF−, CD19+IL-10+TNF+ and CD19+IL-10−TNF+ B cells after 72-h culture of isolated B cells with CpGC, with and without D9 or vehicle control. n = 6 biologically independent samples examined over three independent experiments. Left to right, **P = 0.0062, **P = 0.0083, *P = 0.0237, *P = 0.0172. d, Graph showing the levels of secreted TNF by isolated B cells stimulated for 72 h with CpGC, with and without D9 or vehicle control. n = 8 biologically independent samples examined over three experiments. *P = 0.0330. e, Representative contour plots and cumulative data show the frequencies of CD3+CD4+IFNγ+ T cells after co-culture of resting CD4+ T cells stimulated with anti-CD3, with B cells preconditioned with CpGC, CpGC and D9, or CpGC and vehicle control. n = 5 biologically independent samples examined over three independent experiments. Top to bottom, **P = 0.001, *P = 0.0359, *P = 0.0447, **P = 0.0071, *P = 0.0191, *P = 0.0264, *P = 0.0325. f, Representative contour plots and cumulative data showing frequencies of CD19+IL-10+ B cells after CRISPR–Cas9 silencing of TXN and TXNRD1 and culture for 72 h with CpGC. n = 5 biologically independent samples examined over three independent experiments. Top to bottom, **P = 0.0068, **P = 0.0044, **P = 0.0034, **P = 0.0022. Data were analyzed by one-way ANOVA followed by Tukey’s multiple comparisons test (b,d,e,f) or two-way ANOVA followed by Sidak’s test for multiple comparisons (c). Error bars are shown as mean ± s.e.m. Panel a created with Biorender.com.
In addition to IL-10, inhibition of Trx by D9 reduced, respectively, the TGFβ+, PD-L1+ and IL-35+ B cell frequencies, cytokines and immune-checkpoint inhibitors implicated in the regulatory function of B cells2,27, compared with B cells stimulated with CpGC and vehicle control (Extended Data Fig. 6d,f). The decrease in immune-regulatory cytokines following Trx inhibition was mirrored by increased CD19+IL-10−TNF+ B cell frequencies and an increase in the overall TNF and IL-6 secretion (Fig. 5c,d and Extended Data Fig. 6g,h). Trx-regulated IL-10 expression was also reduced by D9 following a range of B cell stimuli, including CpGC + IFNα, CD40L and anti-BCR (Extended Data Fig. 6i).
We assessed the effect that Trx inhibition has on different IL-10+ and IL-10− B cell subsets. Unlike rotenone, which blocked OXPHOS and inhibited both Breg cell and plasmablast differentiation, Trx inhibition reduced CD24hiCD38hi B cells and increased CD24lo/−CD38hiBlimp1+ plasmablast frequencies (Extended Data Fig. 7a,b). Inhibition of Trx function induced a significant decrease in IL-10+ Breg cell frequencies within the CD24hiCD38hi immature, CD24intCD38int mature-naive and CD24+CD38lo memory B cell and CD24lo/−CD38hiBlimp1+ plasmablast populations (Extended Data Fig. 7c).
To measure if Breg cells, in addition to producing IL-10, depend on active Trx to achieve their suppressive function, we co-cultured anti-CD3-stimulated CD4+ T cells with B cells cultured for 48 h with CpGC, with and without D9 or vehicle control. CD4+ T cells cultured in the presence of D9-conditioned B cells displayed increased IFNγ expression compared with T cells cultured in the presence of B cells stimulated with CpGC alone, or B cells stimulated with CpGC and vehicle control (Fig. 5e).
Although there are no known off-site effects of D9 due to the specificity of its target (TrxR), to further validate the unique role of Trx in Breg cell differentiation, we selectively silenced TXN and TXNRD1, as well as TXN2 and TXNRD2 as negative control. Comparable to the results obtained following the pharmacological inhibition of Trx with D9, silencing of TXN and TXNRD1 inhibits Breg cell differentiation whereas B cells continue to express IL-10 despite TXN2 or TXNRD2 silencing (Fig. 5f and Extended Data Fig. 7d,f).
Trx maintains low ROS and high mitochondrial polarization in B cellsWe next assessed B cell cellular bioenergetic profiles and found that in response to Trx inhibition, the O2 consumption rate (OCR), an indicator of OXPHOS rate, was significantly lower when compared with B cells stimulated with CpGC alone or with CpGC and vehicle control, whereas the basal extracellular acidification rate, a consequence of lactic acid production and an indicator of glycolysis rates, was unaffected (Fig. 6a and Extended Data Fig. 8a). Inhibition of Trx reduced mitochondrial spare respiratory capacity when compared with CpGC- or CpGC and vehicle-treated B cells, as indicated by the difference between the maximal OCR (after stimulation with the uncoupler FCCP (carbonyl cyanide-p-trifluoromethoxyphenylhydrazone)) and basal OCR (Fig. 6a).
Fig. 6: Trx maintains mitochondrial health and low ROS levels.
a, Graphs show real-time Seahorse analysis and basal, ATP-linked, maximal respiration and spare respiratory capacity (SRC) of B cells following 72-h stimulation with CpGC, with and without vehicle control or 100 nM D9. n = 4 biologically independent samples examined over two independent experiments. Left to right, *P = 0.0115, *P = 0.0213, ****P < 0.0001, ****P < 0.0001, ****P < 0.0001, *P = 0.0328, *P = 0.0123, *P = 0.0382, *P = 0.0356. b, Representative contour plots stained with MitoTracker Green (MtG; to assess mitochondrial mass) and MitoTracker Orange (MtOR; its accumulation is dependent upon membrane potential) and graphs show frequencies of B cells with polarized (MtG+MtOR+) and depolarized (MtG+MtOR−) mitochondrial membranes within IL-10+Trx+ and IL-10−Trx− B cell subsets. n = 6 biologically independent samples examined over two independent experiments. Left to right, **P = 0.0035, **P = 0.0021. c, Representative contour plots and graph show frequencies of B cells with polarized (CD19+MtG+MtOR+) and depolarized (CD19+MtG+MtOR−) mitochondrial membranes following 24-h stimulation of B cells with CpGC, with and without vehicle control or 100 nM D9. n = 5 biologically independent samples examined over two independent experiments. Top to bottom, *P = 0.0164, *P = 0.0117. d, Confocal images show expression of Trx (red) alongside MtG (green) and MtOR (yellow) staining in B cells stimulated for 72 h with CpGC. e, Representative histograms and cumulative data show levels of cytoplasmic (CELLROX) and mitochondrial (MITOSOX) ROS after 72-h stimulation of isolated B cells with CpGC, with and without D9 or vehicle control. n = 6 biologically independent samples examined over two independent experiments. Left to right, *P = 0.0148, *P = 0.0138, *P = 0.04, *P = 0.0250. Data were analyzed by two-way ANOVA followed by Sidak’s test for multiple comparisons (a), two-sided paired t-test (b) or one-way ANOVA followed by Tukey’s multiple comparisons test (c,e). Error bars are shown as mean ± s.e.m. Ro/AA, rotenone/antimycin A.
Because Trx has been shown to maintain mitochondrial structure, biogenesis and bioenergetics28 we posited that Breg cells, in virtue of expressing elevated Trx and relying on ETC activity, present with highly polarized mitochondria. We found that Trx+IL-10+ Breg cells have highly polarized mitochondrial membranes (Fig. 6b) and that Trx inhibition with D9 or by gene silencing led to an accumulation of B cells with depolarized mitochondria (Fig. 6c and Extended Data Fig. 8b) and a loss of IL-10 expression (Fig. 5b). Under these culture conditions we showed that Trx is co-localized with polarized mitochondria (Fig. 6d and Extended Data Fig. 8c). Inhibition of Trx by D9 or TXN by gene silencing led to an increase of mitochondrial and, to a lesser extent, cytoplasmic ROS (Fig. 6e and Extended Data Fig. 8d,e). Collectively, these results show that Trx inhibition of ROS is accompanied with optimal mitochondrial polarization and respiration, necessary to meet the metabolic demands of IL-10+ Breg cells.
Trx deficiencies underpin IL-10+ Breg cell dysfunction in SLEWe and others have previously shown that B cells fail to differentiate into Breg cells in patients with SLE3. Moreover, mitochondrial dysfunction and increased oxidative stress have been shown to play a role in SLE pathophysiology, but whether these defects contribute to the Breg cell aberrations present in these patients remains unknown29. We report that in addition to a decrease in IL-10+ Breg cells in a new SLE patient cohort (demographics are reported in Table 1) (Fig. 7a), B cells from patients with SLE present with significantly greater mitochondrial membrane depolarization and elevated mitochondrial ROS levels compared with healthy donor B cells ex vivo (Extended Data Fig. 9a) or following CpGC stimulation (Fig. 7b–d). Patients with SLE also displayed significantly lower frequencies of Trx+ B cells compared with healthy donors (Fig. 7e). Cumulative analysis of healthy and SLE B cells shows a positive correlation between the frequencies of Trx+ and IL-10+ Breg cells (Fig. 7f), further supporting the role of Trx in IL-10+ Breg cell differentiation. Mitochondrial membrane depolarization and reduced IL-10+ Breg cell frequencies were observed in SLE B cells after stimulation with the TLR7 ligand R848, or when cultured with 0.1 μM CpGC (Extended Data Fig. 9b,e). Of note, Trx expression was higher in B cells than in other immune cell subsets in healthy individuals, and in patients with SLE the defect was restricted to B cells, as other cells exhibited the same expression of Trx as healthy donors (Extended Data Fig. 9f).
Table 1 Demographic and clinical characteristicsFig. 7: Exogenous Trx rescues Breg cell deficiencies in SLE.
留言 (0)