Preparation of hydrogels and drug release
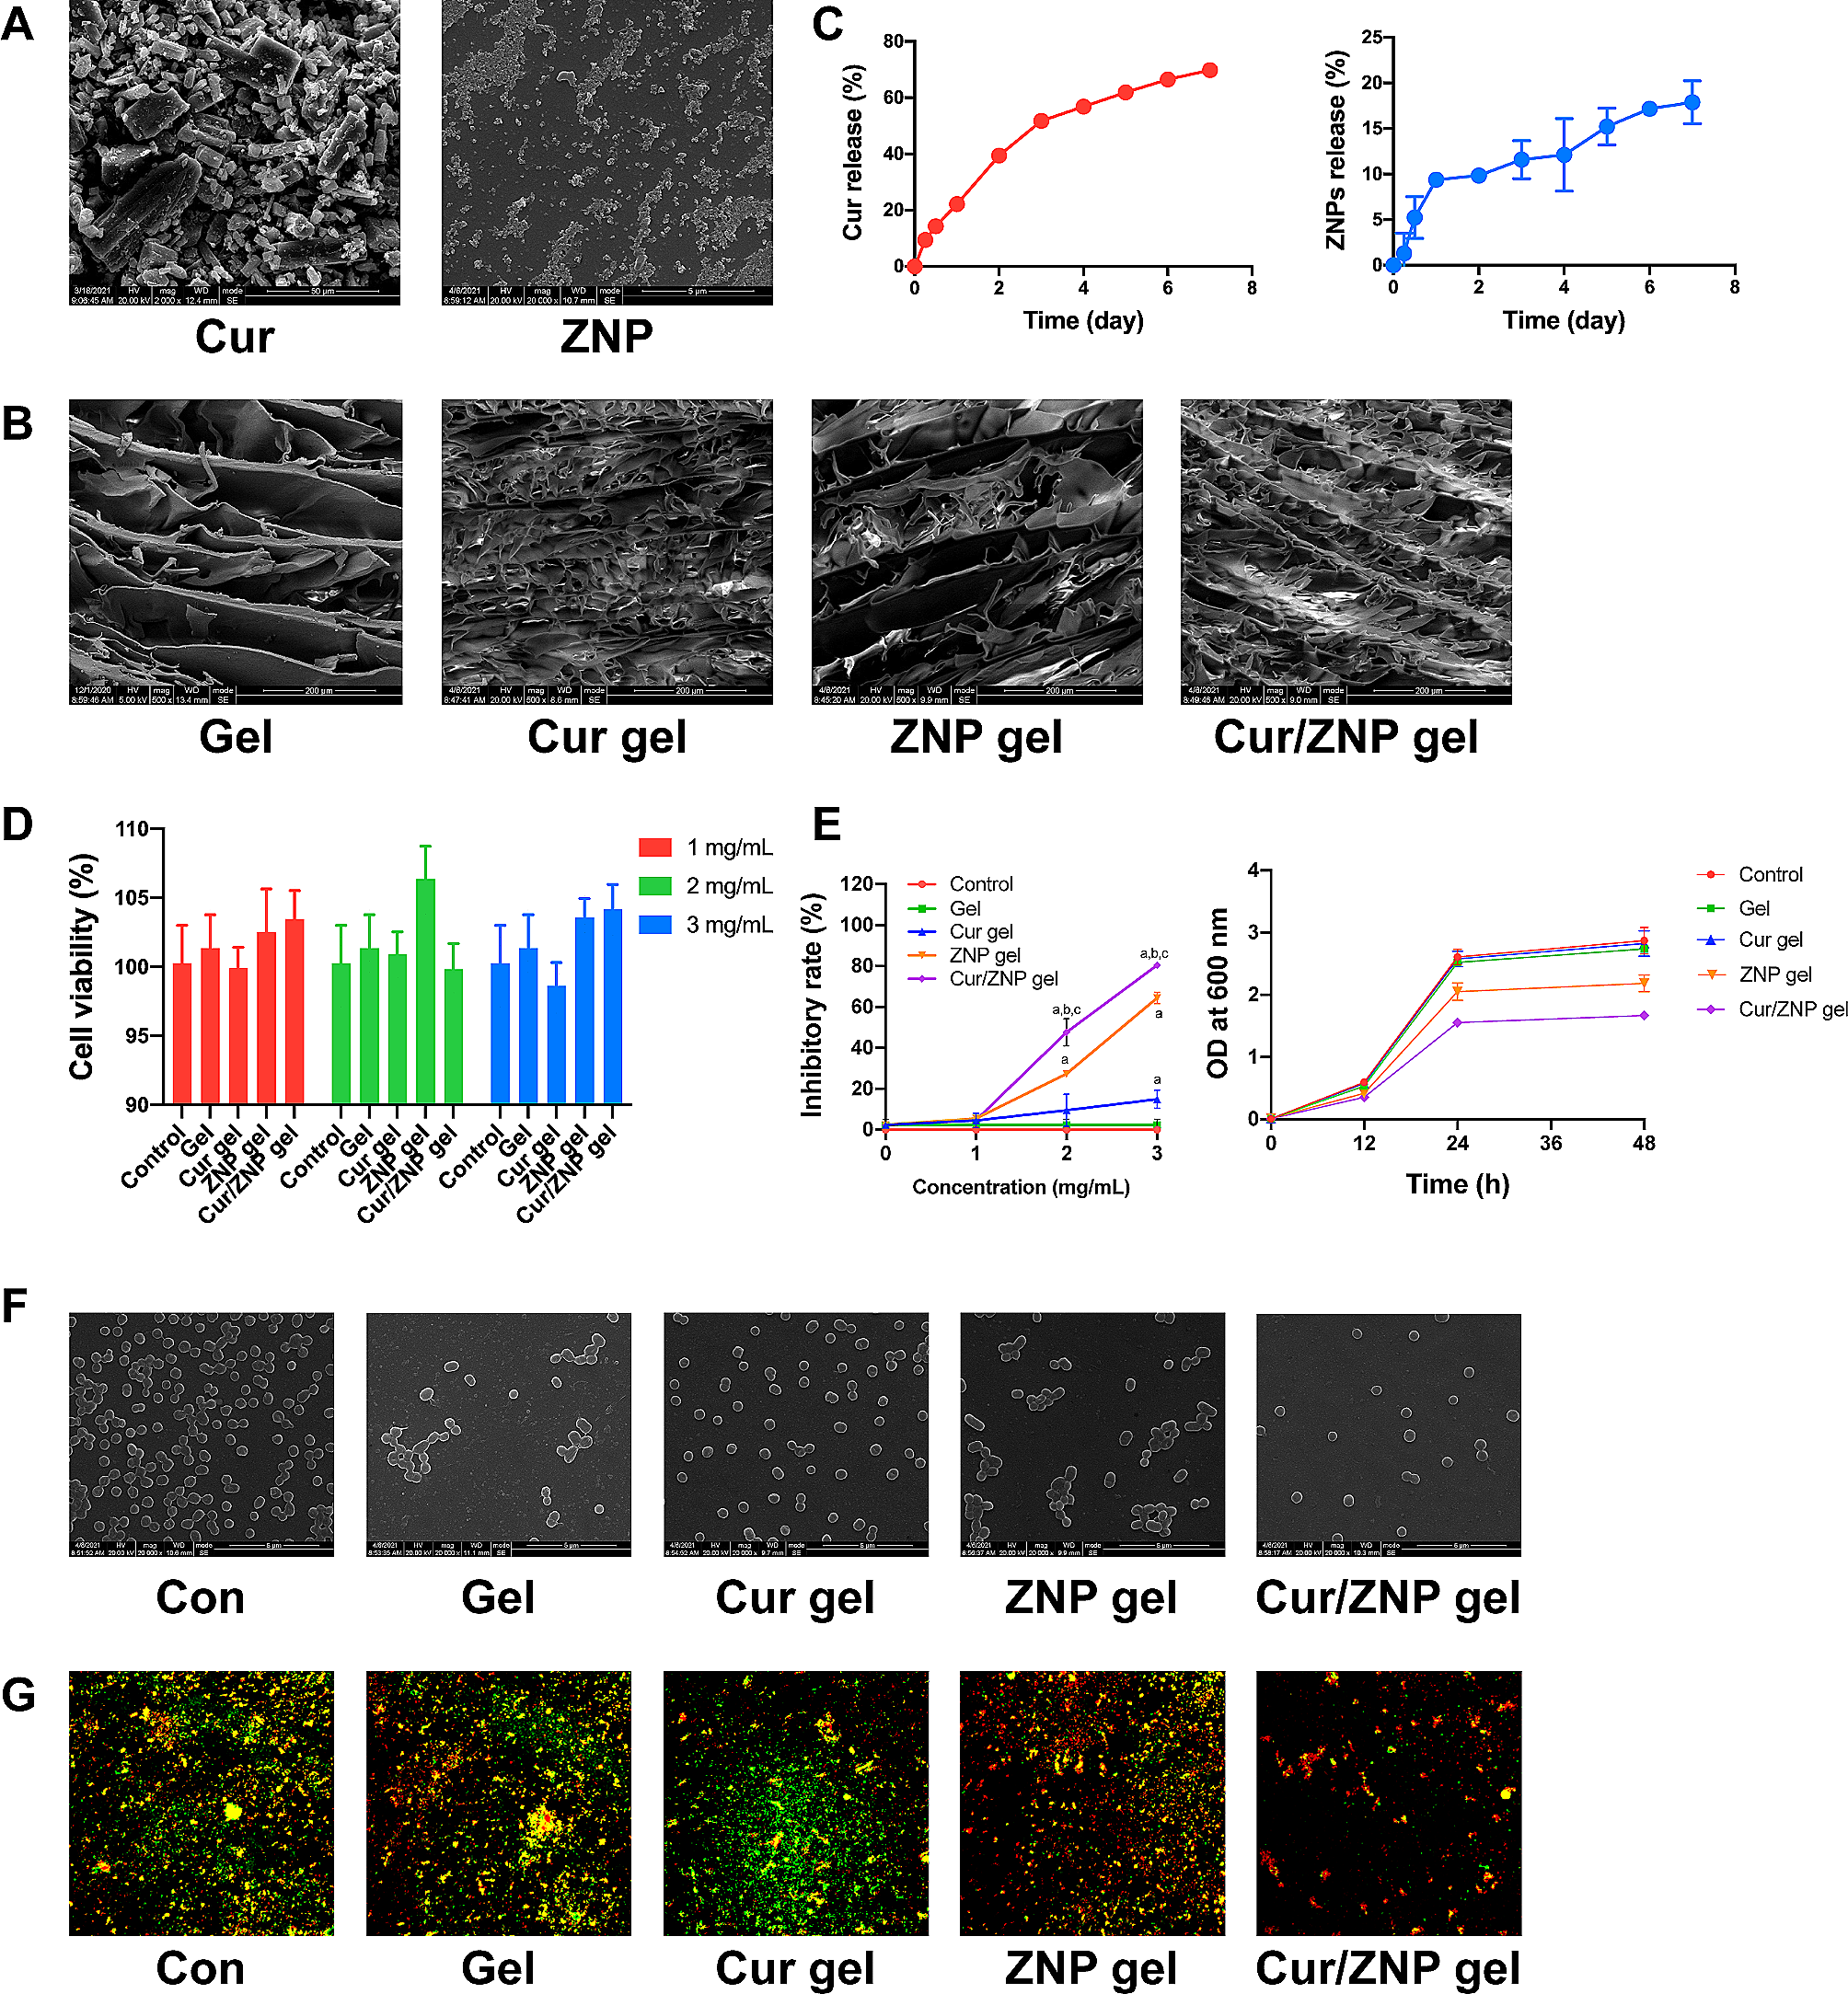
Methylcellulose (Sigma‒Aldrich, LLC) was slowly added to deionized water at 70 °C, after which the mixture was oscillated to form a 14% methylcellulose solution; the mixture was subsequently stored at 4 °C overnight to ensure complete wetting and removal of entrapped air bubbles, thus forming the hydrogel. A Cur hydrogel was prepared by weighing pure Cur powder with a microbalance, slowly adding Cur to the preprepared methylcellulose hydrogel, and stirring in an ice bath. Cur methylcellulose hydrogels at 1 mg/mL, 2 mg/mL, and 3 mg/mL were prepared, and then all the samples were transferred to amber bottles and stored in a freezer. A ZNP methylcellulose hydrogel was prepared by adding 25 mg, 50 mg, or 75 mg of a ZNP dispersion (40 wt %) into 10 mL of the hydrogel prepared in advance in an ice bath. The mixture was stirred evenly to prepare 1 mg/mL, 2 mg/mL, and 3 mg/mL ZNP hydrogels. A Cur/ZNP hydrogel was prepared by adding 10 mg of pure curcumin powder and 25 mg of a ZNP dispersion (40 wt %) to a 10 mL hydrogel and stirring it evenly to obtain a Cur/ZNP hydrogel at 2 mg/mL. Cur/ZNP hydrogels at 1 mg/mL and 3 mg/mL were prepared in the same way. The Cur hydrogel was yellow and translucent, the ZNP hydrogel was white and translucent, the Cur/ZNP hydrogel was yellow, and the color was darker than that of the Cur hydrogel. The injectability and fluidity of the hydrogels were evaluated at different temperatures. To test drug release in vitro, Cur hydrogel (2 mL) and ZNP hydrogel (2 mL) were placed in centrifuge tubes and slowly added to 20 mL of phosphate-buffered saline (PBS) release medium containing 0.5% Tween-80. The release system was placed in a horizontal shaker at 37 °C and 100 rpm. The upper release medium (1 mL) was removed at a specific time, and the OD431nm and OD268nm were determined; then, 1 mL of fresh release medium was added. During the experiment, no flocs or precipitates appeared in the release medium. Three replicates of each hydrogel were performed. The drug concentration at each time point was calculated according to the standard curve (Additional Fig. 1), and the cumulative percentage release of Cur and ZNPs was calculated according to the following formula (\(}_\)) [17]:
$$}_=\frac__^_+__}_}\times 100$$
where \(_\)is the initial dose of drug loaded in the hydrogel (mg), \(_\) is the total volume of release medium (\(_\) = 20 mL), \(_\) is the volume of replaced release medium (\(_\) = 1 mL), and \(_\) is the drug concentration of the n-th sample (\(_\) = 1 mL).
Cells and cell culture
P. gingivalis ATCC 33,277 was cultured anaerobically at 37 °C in Trypticase soy broth supplemented with yeast extract (1 mg/ml), hemin (5 μg/mL) and menadione (1 μg/mL). Human oral keratinocyte-1 (HOK-1) cells were cultured in oral keratinocyte medium (ScienCell Research Laboratories, Inc.) in an incubator at 37 °C with 5% CO2.
Antibacterial activity evaluation
Leaching solutions of hydrogels at different concentrations (1, 2, or 3 mg/mL) were prepared [18]. P. gingivalis (20 μL 109 CFU/mL) and 200 μL of leaching solution were incubated anaerobically at 37 °C in a 96-well plate for 24 h, after which the OD600nm was measured. To determine the influence of the hydrogels on the growth of P. gingivalis, 20 μL of 109 CFU/mL P. gingivalis solution was incubated with 2 mg/mL hydrogel. The absorbance at OD600nm was measured at 0, 12, 24, and 48 h.
Scanning electron microscopy (SEM) and confocal laser scanning microscopy
P. gingivalis treated with each hydrogel was fixed on cover glass slides at 4 °C for 2 h in 2.5% glutaraldehyde, followed by washing with PBS buffer and gradient dehydration with alcohol and anhydrous ethanol. After sputtering with a layer of gold, the morphology of P. gingivalis was observed using a scanning electron microscope (Hitachi S-3400). A laser scanning microscope (Leica) was used to detect exopolysaccharides (EPSs) in P. gingivalis. EPSs were labeled with the tetramethylrhodamine isothiocyanate-labeled lectin concanavalin A from Canavalia ensiformis (TRITC-Con A; Molecular Probes, Inc., USA), and P. gingivalis was labeled with fluorescein isothiocyanate (FITC) [19].
Cell cytotoxicity assay
The cytotoxicity of Cur and ZNPs on HOK-1 cells was examined using a CCK-8 assay (APExBIO Technology LLC). Briefly, 104 cells were seeded in each well of a 96-well plate and cultured at 37 °C for 24 h in 5% CO2. The medium was replaced with 100 μL of leaching solution, and the mixture was cultured for 24 h. The medium was subsequently replaced with medium containing 10% CCK-8, the mixture was incubated at 37 °C for 1 h, and the OD450nm was detected.
Animal study design
All animal procedures were approved by the Ethics Committee of the State Key Laboratory of Oral Diseases, West China Hospital of Stomatology, Sichuan University (WCHSIRB-D-2020-438); the protocols ensured humane practices. The animal experimental study was conducted using eight-week-old male Sprague‒Dawley rats (weight, 250–300 g) purchased from Chengdu Dashuo Experimental Animal Co., Ltd. (license no. 510,109,000,176,387). The rats were randomly divided into five groups (n = 5 per group): (i) healthy controls (sham), (ii) experimental periodontitis (EP), (iii) experimental periodontitis treated with Cur hydrogel (Cur gel), (iv) experimental periodontitis treated with ZNP hydrogel (ZNP gel), and (v) experimental periodontitis treated with Cur/ZNP hydrogel (Cur/ZNP gel). According to the procedure and method in Additional Fig. 2, the EP was established using ligatures with 4–0 silk thread around the bilateral maxillary first molars. P. gingivalis ATCC 33,277 (107 CFU/mL) was smeared onto silk twice a week. One month after ligature placement, rats in the EP + Cur group were treated with Cur hydrogel (Dalian Meilun Biotech Co., Ltd.), those in the EP + ZNP group were treated with ZNP hydrogel (Shanghai Aladdin Biochemical Technology Co., Ltd.), and those in the EP + Cur/ZNP group were treated with Cur/ZNP hydrogel. To do so, 200 μL of each hydrogel (2 mg/mL) was injected into the periodontal pocket of the bilateral maxillary first molar once a week for one month with a blunt syringe. Hydrogels were used as a control for the sham group. Rats were excluded if rapid weight loss and mental or behavioral burnout occurred. According to the distribution of different stages in the experiment, there were corresponding records on the label outside the cage. Outcome evaluation and data analysis were carried out based on random cage units by one investigator who was blinded to the group assignments in the experiments. One month after hydrogel treatment, there was no significant difference in the body weight of the rats between the groups (Additional Table 1). All rats were anesthetized, and blood was drawn by cardiac puncture and euthanized by CO2 inhalation. The maxillary jaws and gingiva were then harvested.
Periodontal destruction analyses
Maxillary jaw samples were decalcified in 10% ethylenediaminetetraacetic acid (EDTA) solution for two months before being sequentially dehydrated in ethyl alcohol at different concentrations. Finally, the tissues were processed into paraffin sections for hematoxylin and eosin (H&E) staining to facilitate the observation of the alveolar bone level (ABL) under a light microscope (DM 500; Leica). A high-resolution micro-CT system (μCT 50; SCANCO Medical AG) was used to scan the maxillary jaw samples [20].
Immunohistochemical (IHC) staining and enzyme-linked immunosorbent assay (ELISA)
IHC staining was performed to highlight osteocalcin (OCN)-positive osteoblasts (ColofulGene Bio, Inc.) and to detect osteoprotegerin (OPG) expression (ColofulGene Bio, Inc.). The number of positive cells per square millimeter of bone marrow was observed under a light microscope and counted using Image-Pro Plus 6.0 software (Media Cybernetics, Inc.). Epicanthus venous blood was centrifuged (10 min, 2432 × g) at 4 °C to obtain serum. The serum levels of OCN were measured using corresponding ELISA kits (Thermo Fisher Scientific, Inc.).
RNAseq and quantitative (q) reverse transcription (RT)-PCR
Total RNA was extracted using TRIzol® reagent (Thermo Fisher Scientific, Inc.). The TruSeq Stranded total RNA with the RiboZero Plus kit (IIlumina, San Diego, CA) was used to obtain a sequencing library from 1 μg of total RNA. Eukaryotic mRNA sequencing was performed using an Illumina NovaSeq 6000 by Shanghai Majorbio Biopharm Technology Co., Ltd. Raw gene counts with a minimum of two counts per million in at least one sample were used for downstream analyses. Differentially expressed genes were determined using the DESeq2 R package [21]. GO enrichment analysis was conducted using the GO seq package, and the results were visualized using the clusterProfiler package [22, 23]. The GO gene network and PPI network were visualized using Cytoscape [24]. All sequencing reads were deposited in the Gene Expression Omnibus (GEO) database under the accession number GSE185147. qPCR was performed using TaqMan Real-Time PCR Master Mix (Thermo Fisher Scientific, Inc.) and TaqMan gene expression assays (Thermo Fisher Scientific, Inc., Assay IDs Rn01476373_g1 and Rn01775763_g1). The transcription of Ceacam1 in the gingiva of rats was evaluated using the 2−ΔΔCT method, with Gapdh serving as an internal reference.
Statistical analysis
Analysis of variance with Tukey’s multiple comparison test was conducted using GraphPad Prism V8.0.0 (GraphPad Software, Inc.), and a P value < 0.05 indicated statistical significance. The values are expressed as the mean ± standard deviation.


Comments (0)