Cell source
The AF used in this study was donated by ten female patients who underwent amniocentesis without fetal sonographic structural abnormalities in their second trimester of pregnancy (16–24 week) at The Third Affiliated Hospital of Guangzhou Medical University (Guangzhou, China). Meanwhile, part of the patients’ information and their karyotype results are shown in Table 1. All donors provided their written informed consent. This study was reviewed and approved by the Ethics Committee and the Institutional Review Board of the Third Affiliated Hospital of Guangzhou Medical University (No. 2021–023).
Cell culture
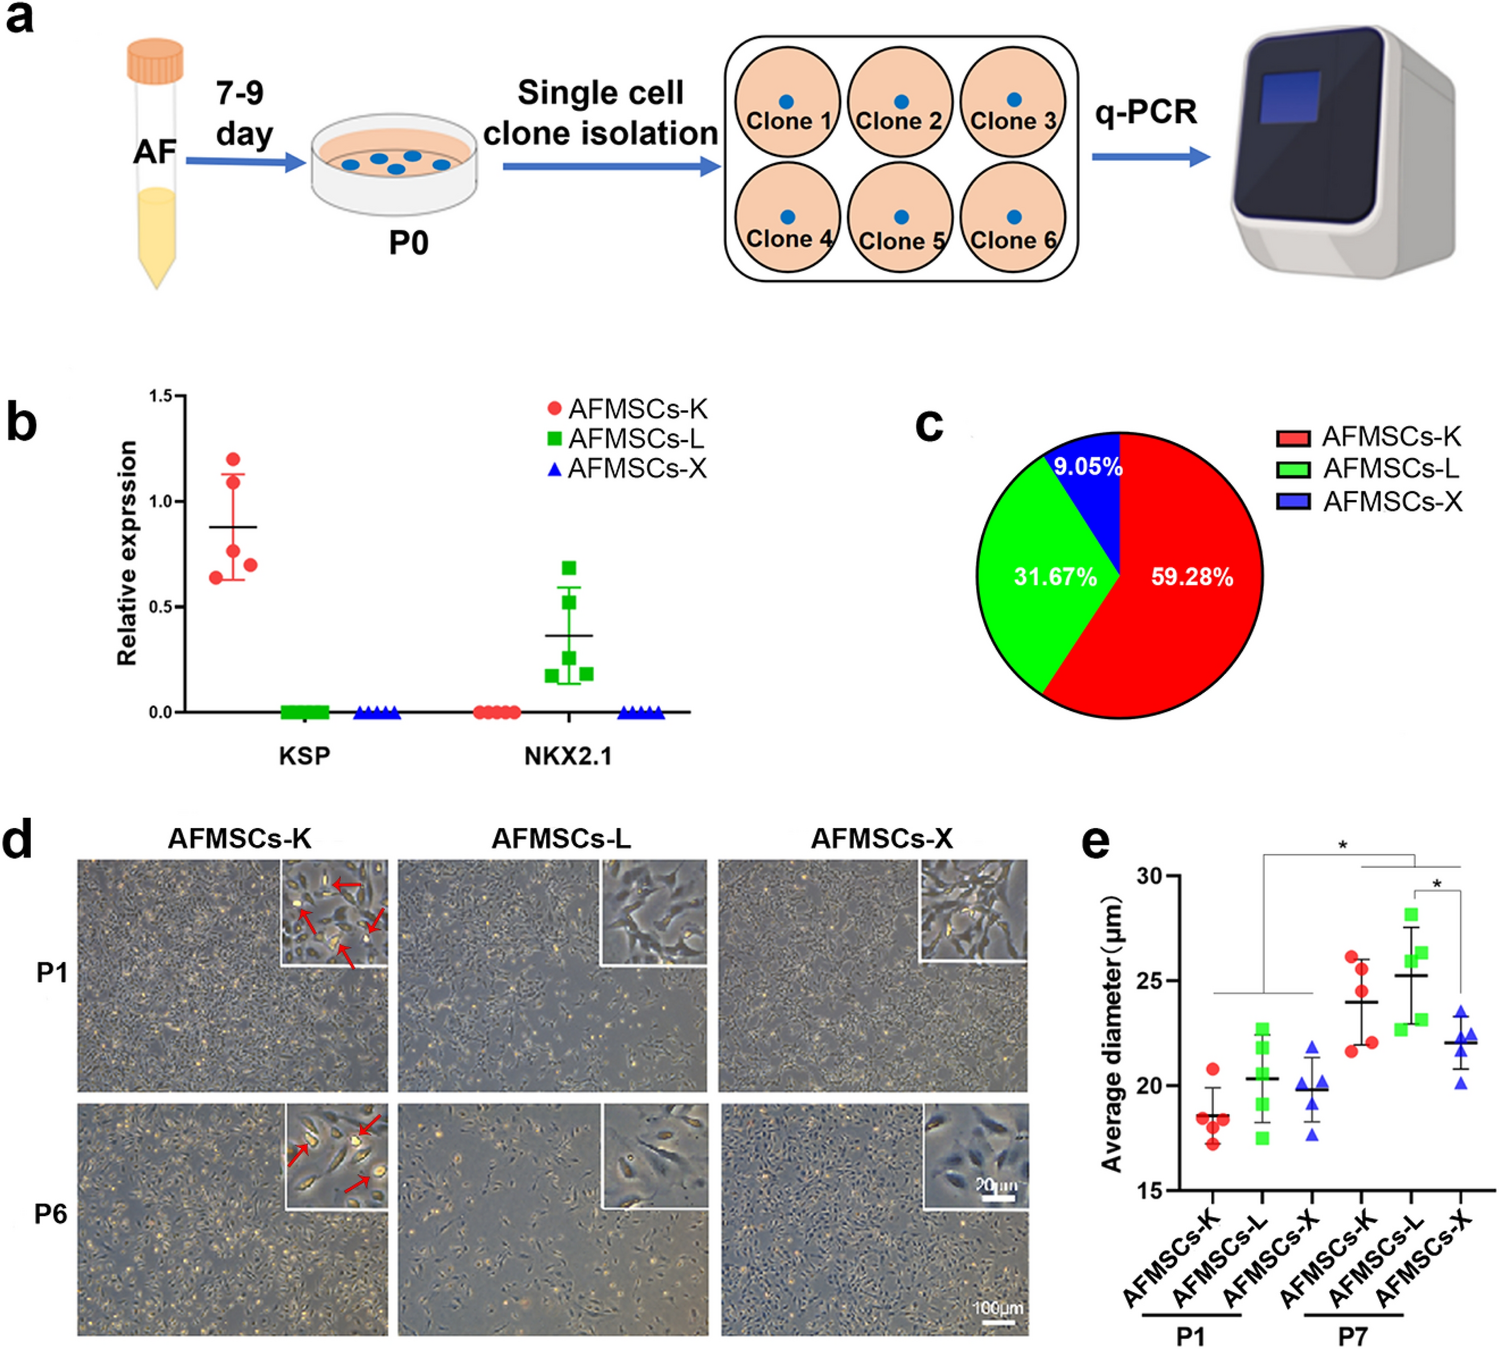
We performed a series of experimental single cell clonal culture of AFMSCs. Routinely we cultured a 10 mL AF cell pellet in a 25 cm2 cell culture dish and approximately 5–40 cell clones formed and used for clinical karyotype detection. In this study, we reduced the volume of AF to 5 mL and centrifuged at 300×g for 5 min at room temperature (RT). Then the cell pellet was suspended in 9 mL commercial AFMSCs medium (BI), transferred into 10-cm Petri dishes, which was enough for AFMSCs to form single cell clones. After 7–9 days, clones which are uniform and have very clear boundaries were defined as a single cell clones. These clones were treated with 0.05% trypsin–EDTA (Gibco), mechanically separated and transferred into 6-well plates for subsequent expansion. All the assays were conducted with AFMSCs of passage 3 unless there is a specific notation.
Population doubling time (PDT) assay
Tissue-specific AFMSCs (P2–P6) were cultured to determine the population doubling time (PDT). Cells were stained with trypan blue (Thermo) using a cell counter (Thermo). Approximately, 2 × 10⁵ cells were seeded in a 10-cm2 culture dish and PDT was calculated using an online tool based on the final cell number (http://www.doubling-time.com/Compute.php).
SA-β-galactosidase staining
Cellular senescence was assessed using a β-Galactosidase Staining Kit (Beyotime). Briefly, culture media was removed and cells were washed with PBS, cells were fixed with 4% paraformaldehyde (PFA, v/v) at RT for 15 min. Fixation solution was removed and cells were rinsed 3 times with PBS for 5 min each. Cells were then treated with 1 mL staining solution and incubated overnight at 37 °C. β-Galactosidase staining was then observed using a bright field inverted microscope (Leica).
Flow cytometry
About 3 × 10⁶ cells AFMSCs were incubated for 30 min at RT with fluorescent-conjugated antibodies against CD19-FITC (Biolegend, Cat# 306,204), HLA-DR-APC (Biolegend, Cat# 307,610), CD34-FITC (BD, Cat# 560,942), CD45-APC (BD, Cat# 555,485), CD11b-APC (Biolegend, Cat# 301,310), CD73-APC (Biolegend, Cat# 344,005), CD44-PE/CY7 (Biolegend, Cat# 103,029), CD29-PE (Biolegend, Cat# 303,003), CD117-APC (Biolegend, Cat# 313,206), CD105-PE (Biolegend, Cat# 800,503), CD90-PerCP/Cyanine5.5 (Biolegend, Cat# 328,117), PCNA-PE (Biolegend, Cat# 307,908) and Ki-67-APC (Biolegend, Cat# 350,513). AFMSCs were then rinsed twice with PBS and analyzed by flow cytometry (Thermo).
Cell differentiation assays
AFMSCs reached 70–80% confluence, then differentiated for 21 days in inducing media. The osteogenic differentiation medium consisted of DMEM, 50 μM L-corbic acid (MedChem Express), 100 nM dexamethasone (Sigma), and 10 mM β-glycerophosphate disodium salt hydrate (Sigma). The chondrogenic differentiation medium consisted of DMEM, 1 μM dexamethasone (Sigma), 50 μM L-ascorbic acid (Med Chem Express), 500 μM sodium pyruvate solution (Sigma), 10 μg/L TGF-β1 (Novoprotein) and 1% insulin–transferrin–sodium selenite media supplement (ITS) (Thermo). The adipogenic differentiation medium was DMEM supplemented with 0.5 mM IBMX (Sigma), 1 μM dexamethasone (Sigma), 10 μM insulin (Meilunbio) and 200 μM indometacin (Sigma). On day 21, trilineage differentiation were stained with Alizarin red S, Toluidine blue and Oil Red O, respectively.
Immunosuppression of PHA-stimulated PBMCs
AFMSCs were pre-treated with 10 µg/mL mitomycin C (Med Chem Express) for 3 h. PBMCs isolated from healthy donors via Ficoll-Paque (GE) were labeled with the fluorescent dye 5, 6-carboxyfluorescein diacetate succinimidyl ester (CFDA-SE) (Invitrogen). AFMSCs and PBMCs were then co-cultured at a 1:5 ratio for 72 h in RPMI-1640 (CORNING) supplemented with 30% FBS (Gibco) and 100 μg/mL PHA (Dahui Biotechnology). PBMCs proliferation were evaluated by measuring CFSE fluorescence via flow cytometry, and mRNA expression was examined using RT-qPCR.
Care and housing of experimental animals
All animal procedures were approved by the Ethics Research Committee of The Third Affiliated Hospital of Guangzhou Medical University. C57BL/6 mice (weighing 18–20 g, 5–6 weeks) were purchased from the Guangdong Medical Laboratory Animal Centre (Guangzhou, China), housed under standard conditions with a 12 h light–dark cycle, and are free access to food and water.
Sepsis induction and treatment
The mice were randomly assigned to five experimental groups (nine mice per group): sham group, CLP group, and 3 treatment groups (CLP + AFMSCs-K, CLP + AFMSCs-L, or CLP + AFMSCs-X). Three hours following CLP, mice in the treatment group received an intravenous injection of approximately 3 × 10⁵ AFMSCs suspended in 150 μL PBS via the caudal vein. The sham and CLP groups received PBS only. The 7-day survival rates were determined, peripheral blood and peritoneal fluid bacterial CFU counts and peripheral blood serum were collected at 48 h. At the end of the study, mice were euthanized by decapitation.
Enzyme-linked immunosorbent assay (ELISA)
Cytokine levels in mouse sera were analyzed using ELISA immunoassays (MEIMIAN), including IL-1β, IL-6, IFN-γ and TNF-α. In addition, optical density (OD) was measured at 450-nm wavelength using an ELISA plate reader (BioTek).
Bacterial colony forming unit (CFU) counts
Peripheral blood (50 μL) and peritoneal fluid (5 μL) were diluted 20- or 20,000-fold with PBS, respectively. The diluted samples were plated on blood agar plates (HuanKai Microbial) and incubated in a carbon dioxide incubator at 37 °C for 24 h. Then, bacterial CFU was imaged using a microscope and quantified using Image J.
Quantitative real-time polymerase chain reaction (RT-qPCR)
Total RNA was extracted using TRIzol™ (Invitrogen). cDNA was synthesized using PrimeScript™RT Kit (Takara). qPCR was performed on a StepOne™ Real-Time PCR System using SYBR® Premix Ex Taq™ II (Takara) and analyzed using ViiA7™ System software (Thermo). The primers used in this procedure are listed in Supplementary Table 1. The mRNA expression was normalized to β-Actin mRNA, and relative mRNA levels were calculated using the ∆∆CT method.
Statistical analysis
All experiments were performed in triplicate with quantitative results expressed as mean ± SD. Statistical comparisons between two groups were conducted using unpaired, two-tailed Student’s t-tests. Log-rank (Mantel-Cox) tests were used to analyze survival data. P value < 0.05 was defined as statistical significance. GraphPad Prism 8 were used for statistical analyses.


留言 (0)