
記住我
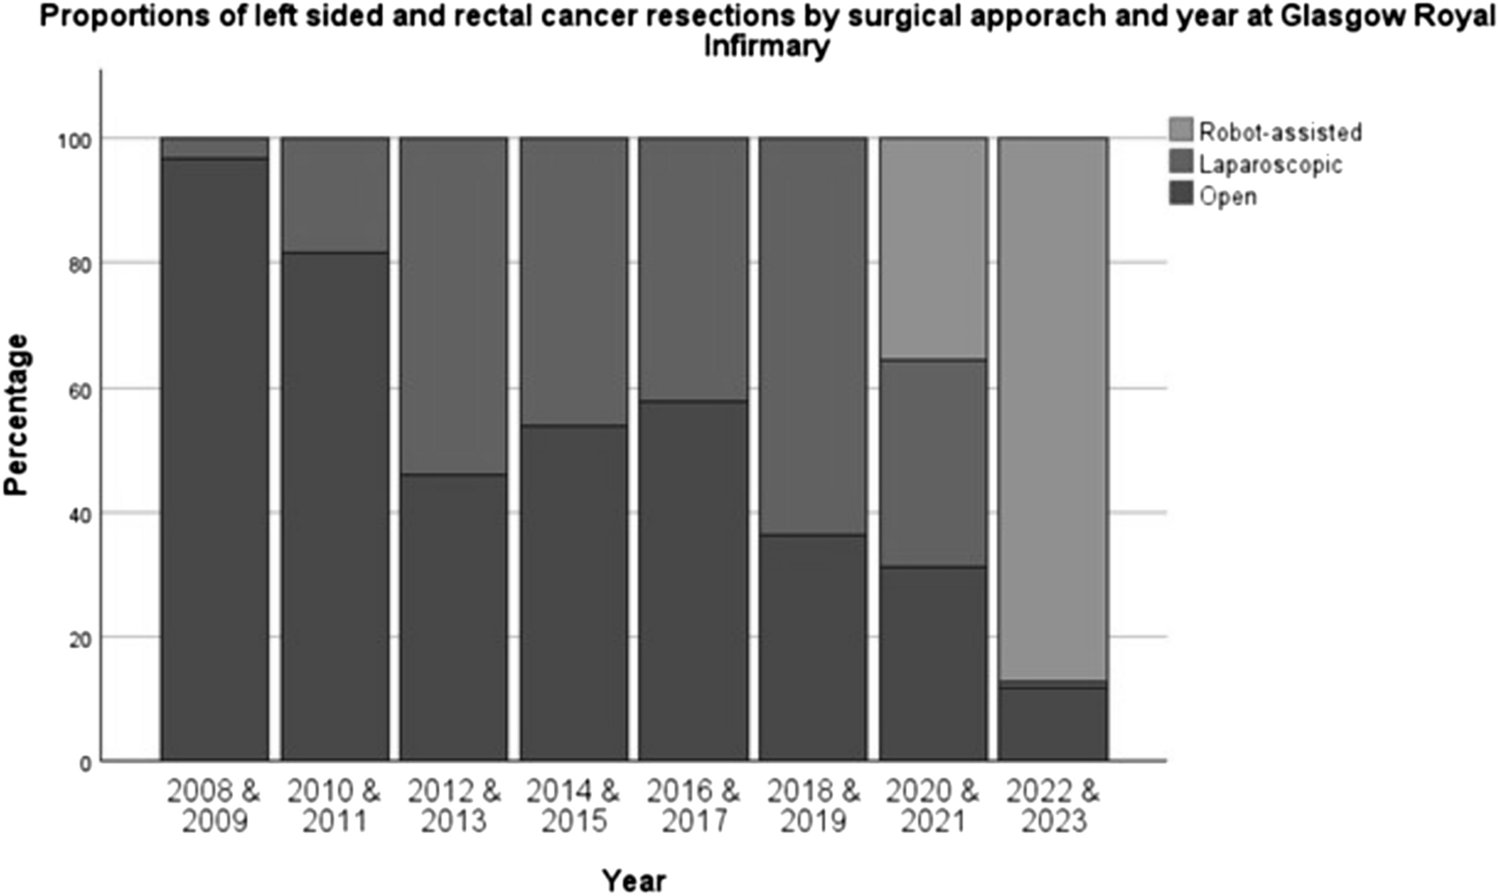
Between January 2008 and May 2021, 830 patients underwent surgery for left-sided and rectal cancer at GRI (462 OS, 368 LS). Since the introduction of RAS in May 2021 to March 2023, 201 patients underwent surgery for left-sided and rectal cancer (21 OS, 8 LS and 172 RAS) at GRI. Figure 1 and Table 1 shows the operative approach for these operations over this time-period. Rates of minimally invasive surgery (MIS) were highest in 2022/2023 when over 85% of left-sided colon and rectal cancer patients were managed with MIS. RAS commenced at GRI in May 2021 with 2 surgeons commencing simultaneously (CR and GM) followed by DC (September 21) and DM (April 22). Initial cases selected for each surgeon were deemed to be technically straightforward high anterior resections but within 2 months all left-sided and rectal resections were directed to the RAS surgical team (Fig. 1).
Fig. 1
Surgical approach for left-sided and rectal cancer resections by year at GRI from 2008 to 2023. (N = 1031)
Table 1 Baseline clinical, pathological characteristics and clinical outcomes of all patients (n = 1031) who had a resection performed for left-sided and rectal cancer based on operative approach (Chi squared test for trend for categorical dataBaseline characteristics of each group in the whole unmatched cohort stratified by surgical approach is provided in Table 1. Comparisons for trend are made across all 3 surgical approach cohorts as well as specifically for LS vs RAS approaches. There was no difference in the sex, age, nodal status or metastatic disease status between the 3 cohorts. In each cohort the most common procedure was HAR, followed, respectively, by LAR, APR, and other procedures, which includes subtotal colectomy and panproctocolectomy. In the OS cohort, 40.6% of cases were HAR followed by 26.1% LAR and 23.4% APR. In the LS cohort 47.3% were HARs, 39.6% LARs and 7.4% APRs and in the RAS cohort 42.4% were HARs, 36% were LARs and 14% APRs (Fig. 2). There was a significant trend towards an increasing proportion of overweight and obese patients BMI ≥ 25 kg/m2 in the minimally invasive approaches compared to OS (OS 67.3% LS 74.2% RAS 80.8%, p = 0.004).
Fig. 2
Operative distribution of all left-sided colorectal cancer resections by surgical approach. (N = 1031)
There was a statistically significant difference in the proportions of these procedures across the 3 operative approaches (p < 0.001) but across LS versus RAS patients alone, there were no statistically significant differences (p = 0.071). Patients treated with an OS approach had the highest proportion of patients with ASA ≥ 3 (38.5%) followed by RAS and LS approaches (36% and 26.1%, respectively) (p < 0.001 for all groups; p = 0.018 for RAS versus LS). There is a significant trend towards OS cohort having more advanced T-stage including a higher proportion of T4 disease on pathology than both LS and RAS (p < 0.001) but no difference in nodal status or whether metastatic disease is present. There were no differences in trend for T-stage when comparing the LS and RAS groups specifically.
There was a trend towards a higher proportion of patients with pre-op CRP > 10 mg/l in the OS group (31.6%) (p < 0.001) but there were no statistically significant differences between LS and RAS when compared specifically (p = 0.385).
OS had the highest rates of neoadjuvant therapy followed by RAS (OS 27.6% vs LS 12% vs RAS 20.5%).
All patients had a minimum follow-up of 90 days.
Inflammation in the postoperative period (CRP)Across all patients there were significant differences in the perioperative inflammatory profiles between the different surgical approach groupings when comparisons for trend were assessed for trends between the OS, LS and RAS approaches (Table 1 and Fig. 3). Comparing for trends between RAS versus both OS and LS, median POD 1, 2, 3, and 4 CRP were significantly lower after RAS, likewise fewer RAS patients had a CRP ≥ 150 on POD 2 and 3 (all p < 0.001).
Fig. 3
a Median daily CRP level trends of all patients undergoing surgery for left-sided or rectal stratified by surgical approach. Patients undergoing conversions have been removed from analyses of CRP outcomes data. b Median daily CRP level trends of all patients undergoing high anterior resections stratified by surgical approach. Patients undergoing conversions have been removed from analyses of CRP outcomes data. c Median daily CRP level trends of all patients undergoing low anterior resections stratified by surgical approach. Patients undergoing conversions have been removed from analyses of CRP outcomes data
When comparing RAS to LS specifically, there were significant differences in POD 1, 2 and 3 CRP levels (p < 0.001, p = 0.001 and p = 0.037, respectively). There was a trend towards lower POD 4 CRP levels with an RAS approach which was not statistically significant (p = 0.066). There was a lower proportion of RAS patients with a POD 2 CRP exceeding 150 mg/l (p = 0.026). There was a trend towards a lower proportion of patients with a POD3 CRP exceeding 150 mg/l with an RAS versus LS approach, but this was not statistically significant (p = 0.09).
Perioperative outcomesAcross all patients undergoing left-sided colon cancer and rectal cancer surgery, there was a trend towards a longer LOS in OS compared to LS and RAS (median of 12 days OS vs 6 days for LS and RAS), p < 0.001 (Table 1). There were no statistically significant differences in LOS between RAS and LS specifically.
The rate of patients experiencing any complications within the first 30 post-operative days were most frequent in the OS cohort followed by LS and RAS; [60% OS vs 44.1% LS vs 35.5% RAS, p < 0.001). The rate of major complications was significantly lower in the RAS cohort (7%) vs LS (9.8%) and OS (14.1%) (p = 0.021). There were no statistically significant differences in the rate of all or major complications between RAS and LS specifically although there was a trend towards a reduced all-complications (CD1-5) rate in RAS versus LS (35.5% versus 44.1%, respectively, (p = 0.055)].
No mortality was observed in the RAS cohort vs 0.9% in the LS cohort and 1.9% in the OS cohort. There were no statistically significant differences in mortality between the cohorts in whole group comparisons or between RAS and LS.
In the whole group, there was a trend towards fewer patients requiring a postoperative CT scan in the minimally invasive approaches versus OS to investigate potential complications within 30 days, (OS 33.4% vs LS 25% vs RAS 21.6%, p = 0.003). Comparing RAS versus LS specifically, these differences were not statistically significant.
The postoperative blood transfusion rate was lower with minimally invasive surgery approach versus OS approach (OS 18% vs LS 3.6% vs RAS 4.1%, p < 0.001). Comparing RAS versus LS specifically, these differences were not statistically significant.
The rate of surgical site infection (SSI) within 30 days was lower in RAS and LS surgery compared to OS (OS 19.9% vs LS 8.6% vs RAS 8.1%, p < 0.001). Anastomotic leak rates were numerically lower in RAS when compared to LS and OS but did not reach significance (OS 6.4% (4 × Grade B, 25 × Grade C) vs LS 5.5% (2 × Grade B, 13 × Grade C) vs RAS 3.4% (1 × Grade B, 4 × Grade C 2.7%), p = 0.388). Comparing LS versus RAS specifically, RAS was associated with a significantly lower anastomotic leak rate (p = 0.039).
There was a trend in favour of RAS for a reduced rate of reoperation or readmission within 30 days although these were not statistically significant in whole group or RAS versus LS comparisons.
There were fewer conversions in the RAS cohort (4.1%) vs LS (9.1%) (p = 0.039).
Binary logistic regressionBinary logistic regression analysis was performed to determine which preoperative clinical factors including surgical approach determined magnitude of the postoperative inflammatory response and development of any and major postoperative complications, respectively (Tables 4 and5).
The relationship between preoperative clinical characteristics and POD3 CRP ≥ 150 mg/L are shown in Table 2. On univariate binary logistic analysis, male patients (p = 0.048), preoperative CRP ≥ 10mg/L (p < 0.001), advancing T stage (p < 0.001), operative procedure type (HAR = reference) (LAR p = 0.243; APR p < 0.001, Other procedures p = 0.007), and higher ASA (p = 0.006) were associated with a CRP ≥ 150mg/L at day 3 postoperatively. In addition, LS and RAS approaches (both p < 0.001), later year of surgery (2014–2018 p = 0.003; 2019–2023 p < 0.001) were also associated with lower CRP levels at day 3 post-operatively (both p < 0.001). On multivariate analysis, male sex (OR 1.42, 95% CI 1.07–1.89, p = 0.016), preop CRP ≥ 10 (OR 2.37, 95% CI 1.70–3.31, p < 0.001) and operative procedure type was also associated with higher CRP levels at POD 3. Using HAR as the reference group, all other procedure types were independently associated with elevated POD3 CRP levels (LAR OR 1.58, 95% CI 1.14–2.21, p = 0.007; APR OR 2.34, 95% CI 1.56–3.51, p < 0.001; Other procedures OR 1.73 95% CI 1.02–2.93, p = 0.041). Finally, LS and RAS approaches and later year of surgery were independently associated with lower CRP levels at 3 days postoperatively (LS OR 0.45, 95% CI 0.33–0.62; RAS OR 0.35 95% CI 0.21–0.59 (both p < 0.001)) and (2014–2018 OR 0.67, 95% CI 0.47–0.93, p = 0.018; 2019–2023 OR 0.54 95% CI 0.36–0.81, p = 0.003) (Table 2).
Table 2 Binary Logistic regression comparing preoperative factors with a POD 3 CRP ≥ 150 mg/L in the whole groupThe relationship between development of complications and preoperative clinical characteristics is shown in Table 3. On univariate analysis, age ≥ 75 (0.032), male sex (p = 0.008), pre-op CRP ≥ 10mg/L (p = 0.003), high ASA (p < 0.001) and operative procedure type (HAR = reference) (LAR p = 0.002; APR p < 0.001, Other procedures p < 0.001) were associated with increased likelihood of developing any complications. Only an LS and RAS approach were associated with less likelihood of developing any complications both p < 0.001. On multivariate analysis, male sex (OR 1.38, 95% CI 1.06–1.80, p = 0.017), ASA 3 and 4 (OR 1.64, 95% CI 1.24–2.17, p < 0.001) and pre-op CRP < 10 mg/L (OR 1.38 95% CI 1.00–1.89, p = 0.049) were associated with a higher likelihood of developing any complications. Operative procedure type was also associated with the development of any major complications. Using HAR as the reference group, all other procedure types were independently associated with any (CD 1–5) complications (LAR OR 1.88, 95% CI 1.39–2.54, p < 0.001; APR OR 3.04, 95% CI 2.04–4.51, p < 0.001; Other procedures OR 2.22, 95% CI 1.33–3.71, p = 0.002). An LS and RAS approach was associated with a reduced likelihood of developing any complications (OR 0.63, 95% CI 0.47–0.85, p = 0.002 and OR 0.39 (0.26–0.56), p < 0.001, respectively.
Table 3 Binary logistic regression comparing preoperative factors with development of any complications in the whole groupThe relationship between preoperative clinical characteristics and the development of major complications (CD grade 3 +) are shown in Table 4. On univariate analysis, only advancing T-stage of tumours (p = 0.044) were associated with increased likelihood of major complications. Likewise, only an RAS approach (p = 0.017) was associated with a reduced likelihood of developing major complications. Similarly, on multivariate analysis, only a RAS approach (OR 0.5 95% CI 0.26–0.95, p = 0.036) was independently associated with a reduced likelihood of developing major complications.
Table 4 Binary logistic regression comparing preoperative factors with development of major complications in the whole groupPropensity scores matched modelIn order to further investigate differences in perioperative outcomes and inflammatory response profiles between LS and RAS, we undertook a propensity score matched analysis. In the total cohort of 376 and 172 patients who underwent LS and RAS, a total of 334 patients were matched by propensity scores (167 in each group). There was a subsequent improvement in balance in the distribution of propensity scores of the two cohorts after matching (Supplementary Fig. 1a and b). In terms of postoperative inflammatory response, RAS was associated with a lower serum CRP at POD 1 (46 mg/l, IQR 30–71 versus LS 56 mg/l, IQR 39–83, p = 0.004) and POD 2 (80 mg/l, IQR 52–131 versus LS 107 mg/l, IQR 72–165, p = 0.004) but not POD 3 and 4 (Table 5). Furthermore, RAS was associated with a smaller proportion of patients with a CRP ≥ 150 mg/l at POD 3 (20.9% versus 30.5%, p = 0.036).
Table 5 Baseline clinical and pathological characteristics and outcomes of propensity score matched patients (McNemar test for categorical outcomes data and Wilcoxon signed-rank tests for continuous outcomes data)In terms of perioperative outcomes, RAS was associated a lower postoperative all-complications rate (34.7% versus 46.7%, p = 0.033). There were no significant differences between the RAS and LS matched cohort in terms of length of stay, the development of major complications, need for postoperative CT imaging, SSI, re-admission, re-operation, or conversion to open although the trend favoured the RAS outcomes.
留言 (0)