
記住我

This study created a life table modelling approach with a single-year cycle length and estimated the health and productivity burden of T2D in working-age South Africans. Life table modelling in combination with decision analysis were utilised to simulate the follow-up of the T2D cohort.
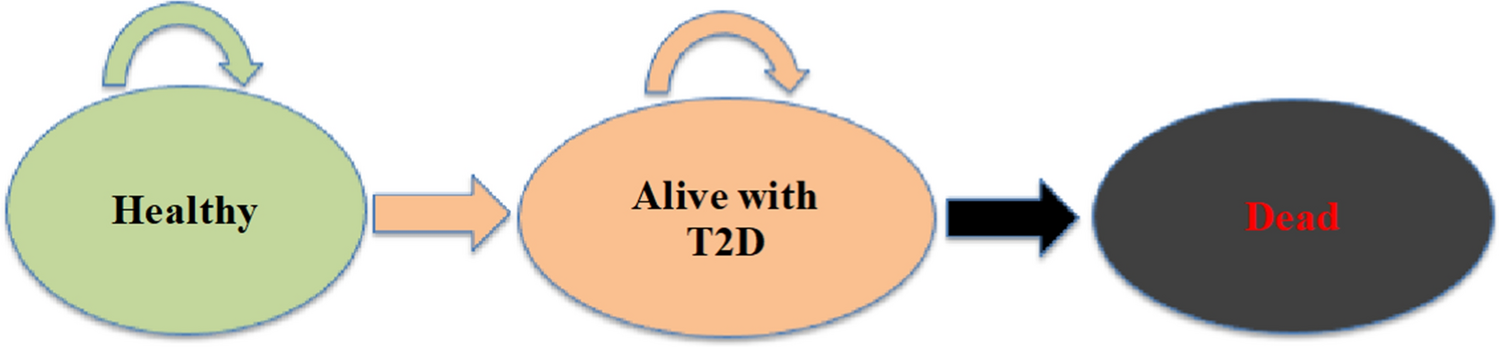
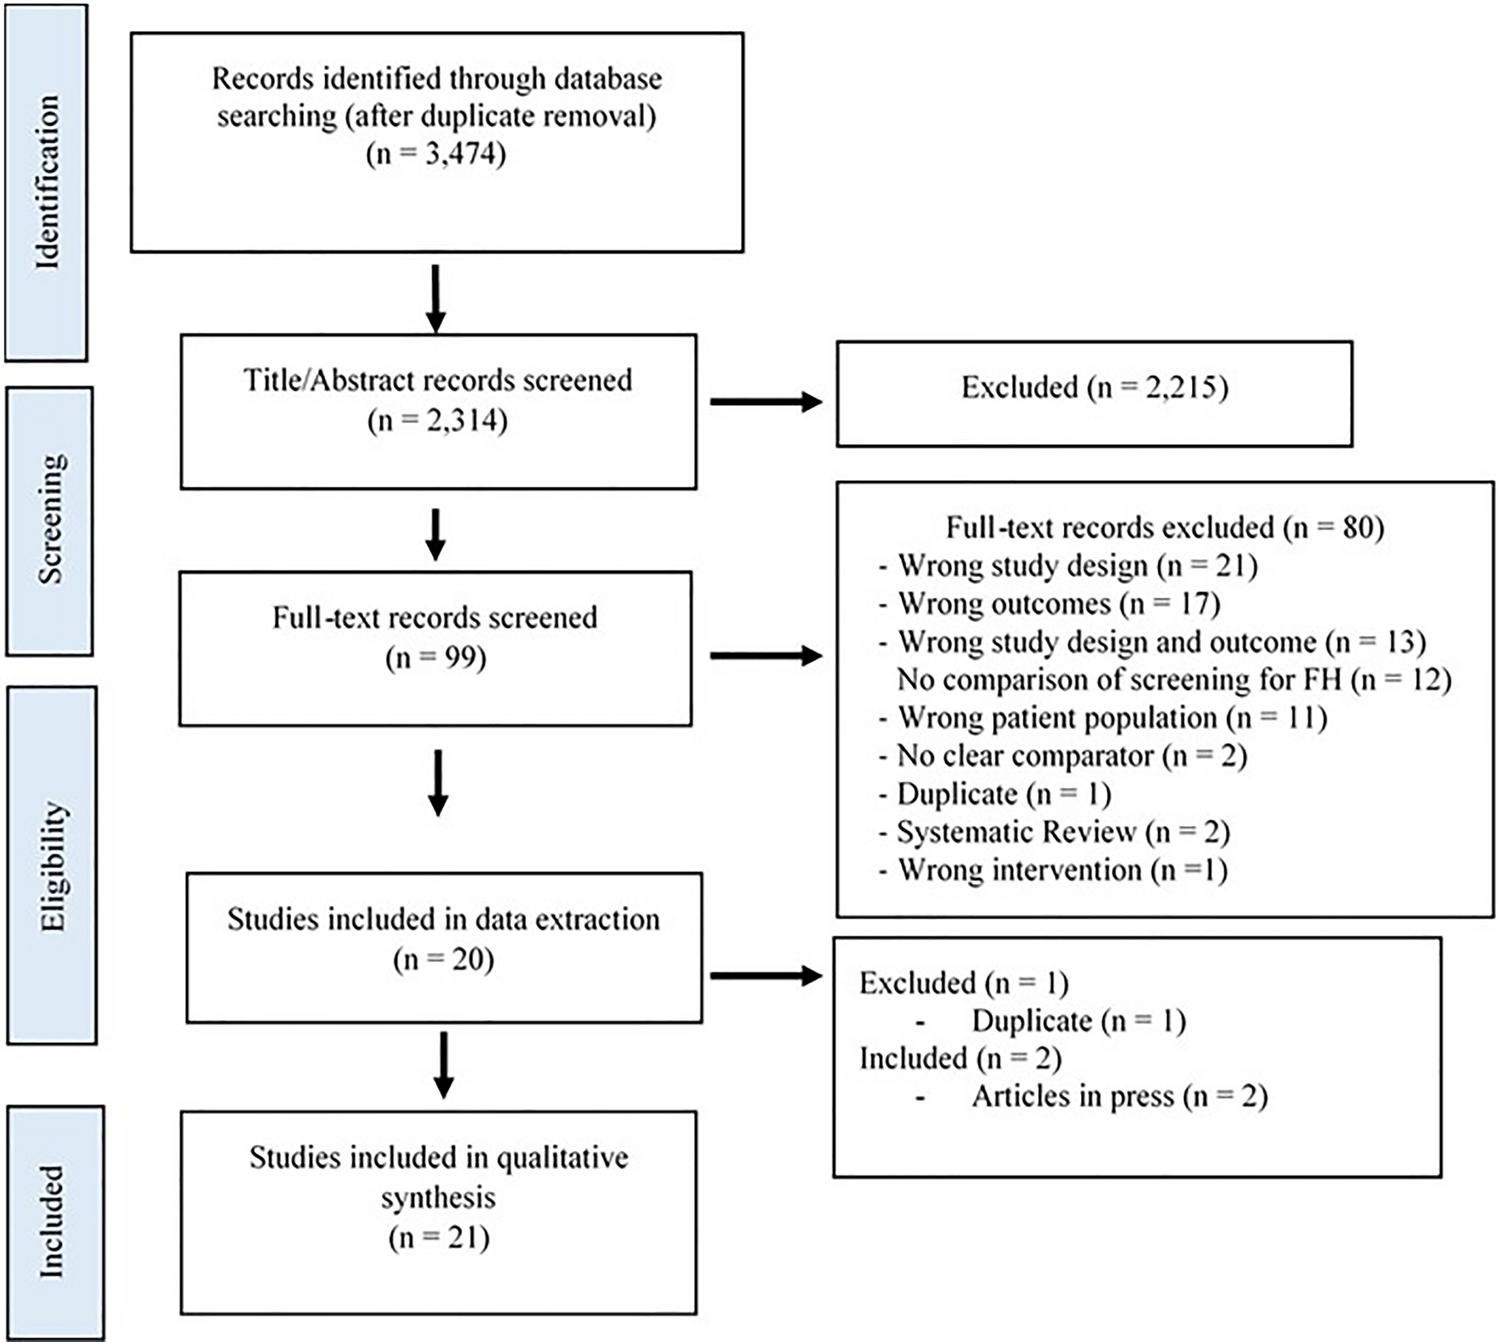
We specifically focused on T2D due to its prevalence, healthcare costs, and impact on the burden of labour productivity [18,19,20,21,22]. In this study, we used life table modelling to project the health outcomes of the working-age population in SA. The models were developed in Microsoft Excel version 2021. We have constructed two models within Excel: Model 1 simulated a cohort with T2D, and Model 2 re-simulated the same cohort under the hypothetical absence of T2D. Model 1 is depicted in Fig. 1. Notably, our life table models did not account for transitions between non-diabetic and diabetic states or the possibility of T2D recovery. Instead, we relied on baseline prevalence data and population demographics to simulate cohort progression to mortality transitions, omitting changes between diabetic and healthy states.
Fig. 1
Model description for cohort with type 2 diabetes (T2D), including two health states
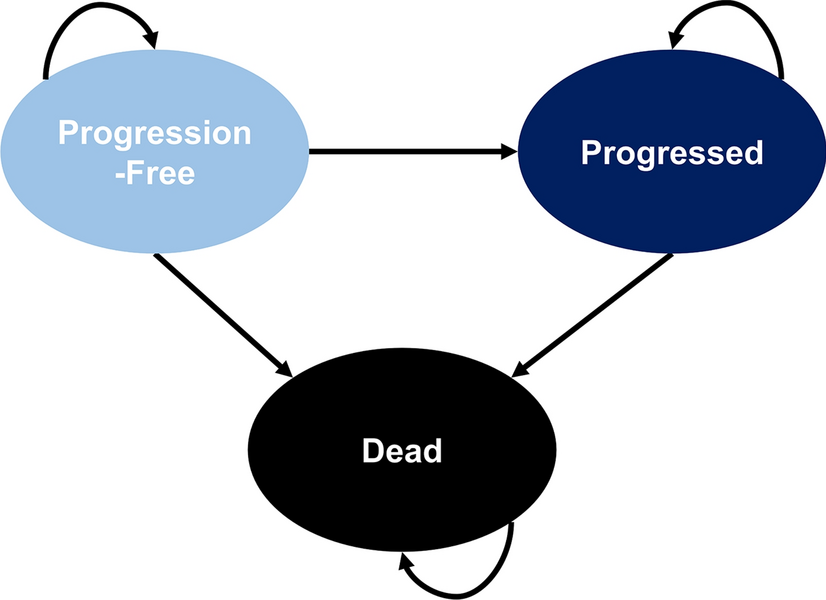
By contrasting the cohorts—one with T2D (presented in Fig. 1) and the other hypothetically without T2D (presented in Fig. 2)—we quantified the impact of T2D on life years lived and workforce productivity. First, the difference in the total mortality (excess mortality) and YLL between the two models in labour force participation reflected the impact of diabetes-related productivity loss in labour dropout—accounting for the shortfall in labour force participation in those with T2D compared to those without [16,17,18]. Second, the PALY metric, which depends on productivity indices and YLL, was calculated [17].
Fig. 2
Model description for cohort without type 2 diabetes (hypothetically)
Data were derived both from publicly available databases and published sources. We used population labour force data from Statistics South Africa (Stats SA) for 2019 [23], shown in the online resources—see Electronic Supplementary Material (ESM) Table 2. The 5-year age group and sex-stratified data of working-age population prevalence and annual mortality rate (AMR) were obtained from the IDF Atlas 10th Edition and the vital statistics department in Stats SA, respectively [11, 13, 23]. All monetary values were converted from ZAR to US dollars using the 2019 average exchange rate of ZAR14.4496 to US$1 to allow comparability with other populations [24].
2.1 Type 2 Diabetes (T2D) PrevalenceFive-year age group and sex-stratified T2D prevalence data for the SA population were obtained from the 2021 IDF Atlas [12]. These data were then applied to the midpoint of each age band to estimate single-year age prevalence rates. Two distinct scenarios were established in separate sheets: Model 1, using the actual T2D prevalence from IDF data, and Model 2, assuming zero T2D prevalence. These data points were extrapolated over time, incorporating demographic shifts. Our method used life table models to simulate the cohort’s progression to mortality transitions based on the existing prevalence data and population demographics, as detailed online in ESM Table 1. This approach enabled us to assess the impact of the presence and absence of T2D on the SA population.
Table 1 Age- and sex-specific prevalence of T2D among the working-age population in SA, 2019 [12, 23]2.2 Annual Mortality RatesThe 5-year age and sex band mortality rates for the SA population in 2019 were obtained from Stats SA [10, 30]. We analysed mortality rates attributed to individuals with and without T2D based on age, sex, and T2D prevalence. In the current context of T2D, the 2021 IDF Atlas method of age-related estimation of T2D mortality in conjunction with age was utilised.
This study applied the average annual proportional reduction in adult mortality for the past decade in SA of 1.8% per year data obtained from the WHO progressively across the model time horizon to project temporal risk trends in population mortality [25]. AMR was used, assuming that death occurs half way through the cycle. Information regarding the burden of mortality and excess deaths related to diabetes is often limited and unreliable, especially in low- and middle-income countries (LMICs). This is also the case for estimates in SA, which have primarily relied on death certificate data from the Department of Home Affairs submitted to Stats SA. However, death certificate data alone may not account for the complex nature of deaths influenced by multiple causes. Formulas used to calculate AMRs for individuals with and without T2D, categorised by age group and sex, can be found in the online ESM.
All-cause mortality associated with T2D was sourced from a study conducted within the Asia Pacific population [19]. The decision to utilise data from the Asia Pacific region was driven by the lack of comprehensive, specific mortality risk data related to T2D in the SA population and the cultural similarity between the two populations [26, 36]. Through the process, we quantified the excess deaths caused by T2D and the YLL. The YLL is a metric that quantifies the effects of premature death by estimating the years a person would have lived had they not died early [17,18,19]. This calculation is derived by subtracting the age at death from a predetermined life expectancy value, known as the standard life expectancy (SLE). Hence, the formula for YLL is expressed as the difference between the years of life lived in the ‘T2D cohort’ assuming no T2D and the years lived in the T2D cohort. The model estimation included the SLE and the age at which the person died. In SA, at birth in 2019, men had a lower life expectancy of 64 years, while women had a higher life expectancy of 70 years [27].
2.3 Productivity IndicesProductivity indices signify a productivity index that can be calculated by dividing an output index by an index of hours worked [17, 28]. While the productivity index for T2D patients is expected to be less than 1, in those without diabetes, it was assumed to be 1 (fully productive).
Absenteeism, here the number of lost workdays in a year owing to diabetes, is commonly represented as a percentage of the total number of working days in a year [21]. Both women and men of all age groups in SSA were estimated to miss 8.6 days on average [22].
Presenteeism, the self-assessed productivity loss indicator while at work, was expressed as a percentage of total productivity. Data estimated by the ‘Global Economic Burden of Diabetes’ in adults aged 20–79 years for SSA indicate that 1.0% of women and 0.6% of men experienced a decrease in production due to presenteeism related to T2D [22].
To determine the PALYs for the T2D cohort, we multiplied the time period that the cohort spent in the workforce by a productivity index. The index was determined based on estimates of absenteeism and presenteeism related to diabetes. This process is similar to multiplying the years of life lived by a measure of utility to calculate quality-adjusted life years [29]. Thus:
$$} = \, \left( } }\;}} \right)\left( } }\;}\;}\;}\;}\;}\;}\left( }_}} } \right)\;}\;}\;}} \right)$$
1Absenteeism and presenteeism caused by T2D-related impairment
2((YLLd)(labour force participation rate of SA))
There were 250 calendar working days in 2019 in SA. This study estimated the combined productivity shortfall related to diabetes, including absenteeism and presenteeism, which was 4.44% in women (a T2D productivity index of 0.9556) and 4.04% in men (with a productivity index of 0.9596), with the formulas employed for estimation found in the online ESM. On the other hand, the productivity index among individuals without T2D was assumed to be 1 (fully productive) for simplicity of calculations.
2.4 Labour Force ParticipationFive-year age group, sex-stratified, population-level employment was obtained from the Labour Department of Stats SA [27]. These data were used to quantify the inability to work and early retirement among people with T2D compared to those without T2D. The labour force participation was quantified using a full-time equivalent (FTE) employment rate. The FTE considers the total hours worked by individuals in a given age group relative to the complete standard full-time working hours, thus adjusting the proportion of employed individuals in that group. In the general population of SA, the lowest labour force participation rates were observed in the 60–64 age group, with 4.68% for males and 5.78% for females. Conversely, the highest participation rate was in the 25–29 age bracket for males at 16% and in the 20–24 age bracket for females at 15.4% (Table 1) [23].
Diabetes-related labour force dropout was expressed as a difference in labour force participation rates, varying from 7.0% in females and 5.2% in males aged 20–29 years with T2D to 12.8% in females and 8.3% in males over 40 years [21]. These relative reductions were applied to 2019 sex- and age-group-specific SA labour force participation rates to derive the participation rates in those with and without T2D. The decline in labour force participation is often triggered by an inability to work and early retirement among individuals with T2D compared to individuals without, accounting for absenteeism and presenteeism [17].
2.5 Gross Domestic ProductThe data on GDP per capita in SA were sourced from the World Bank and stood at ZAR96,584.38 ($6684.04) in 2019 [30]. The projected temporal trends in GDP growth rate of 1.6% for 2019 were obtained from the Organisation for Economic Co-operation and Development (OECD) Compendium [31]. In this study, we assumed that the economic value of each PALY corresponded to the annual GDP per effective full-time (EFT) worker, based on a constant GDP per EFT worker of $6684.04 [30]. This calculation reflects the potential GDP loss incurred when a worker drops out of the workforce due to T2D and does not reflect the actual annual earnings of an EFT worker. Furthermore, this does not account for the indirect costs incurred by the worker when forced out of the workforce due to diabetes, which is currently under investigation in this study for the year 2019. The GDP per EFT worker was held constant throughout the model time horizon.
2.6 Sensitivity and Scenario AnalysisTo assess the robustness of our model, we conducted deterministic sensitivity analyses. These analyses examined the impact of uncertainties in diabetes-related mortality risk, productivity indices, economic data inputs, and potential PALYs lost due to T2D. We incorporated the upper and lower 95% confidence intervals around the risk ratios of T2D to estimate the bounds for all-cause mortality risk associated with T2D. Additionally, we assessed the uncertainty limits around productivity indices by varying absenteeism, presenteeism, and labour force dropout estimates by 25%. Scenario analyses were also conducted to explore the effects of different model assumptions. These included scenarios where the mortality risk doubled from the population's average annual reduction in mortality risk of 1.8–3.6% per year [25], maintaining 2019 mortality risks over the model's time horizon, and varying trends in GDP per worker by either doubling the average annual GDP growth rate from 1.6 to 3.2% or keeping it constant throughout the model [30]. Lastly, we explored the effect of applying a 5% discount rate, in contrast to the standard WHO annual discount rate of 3% [32], to evaluate its impact on our findings.
留言 (0)