
記住我
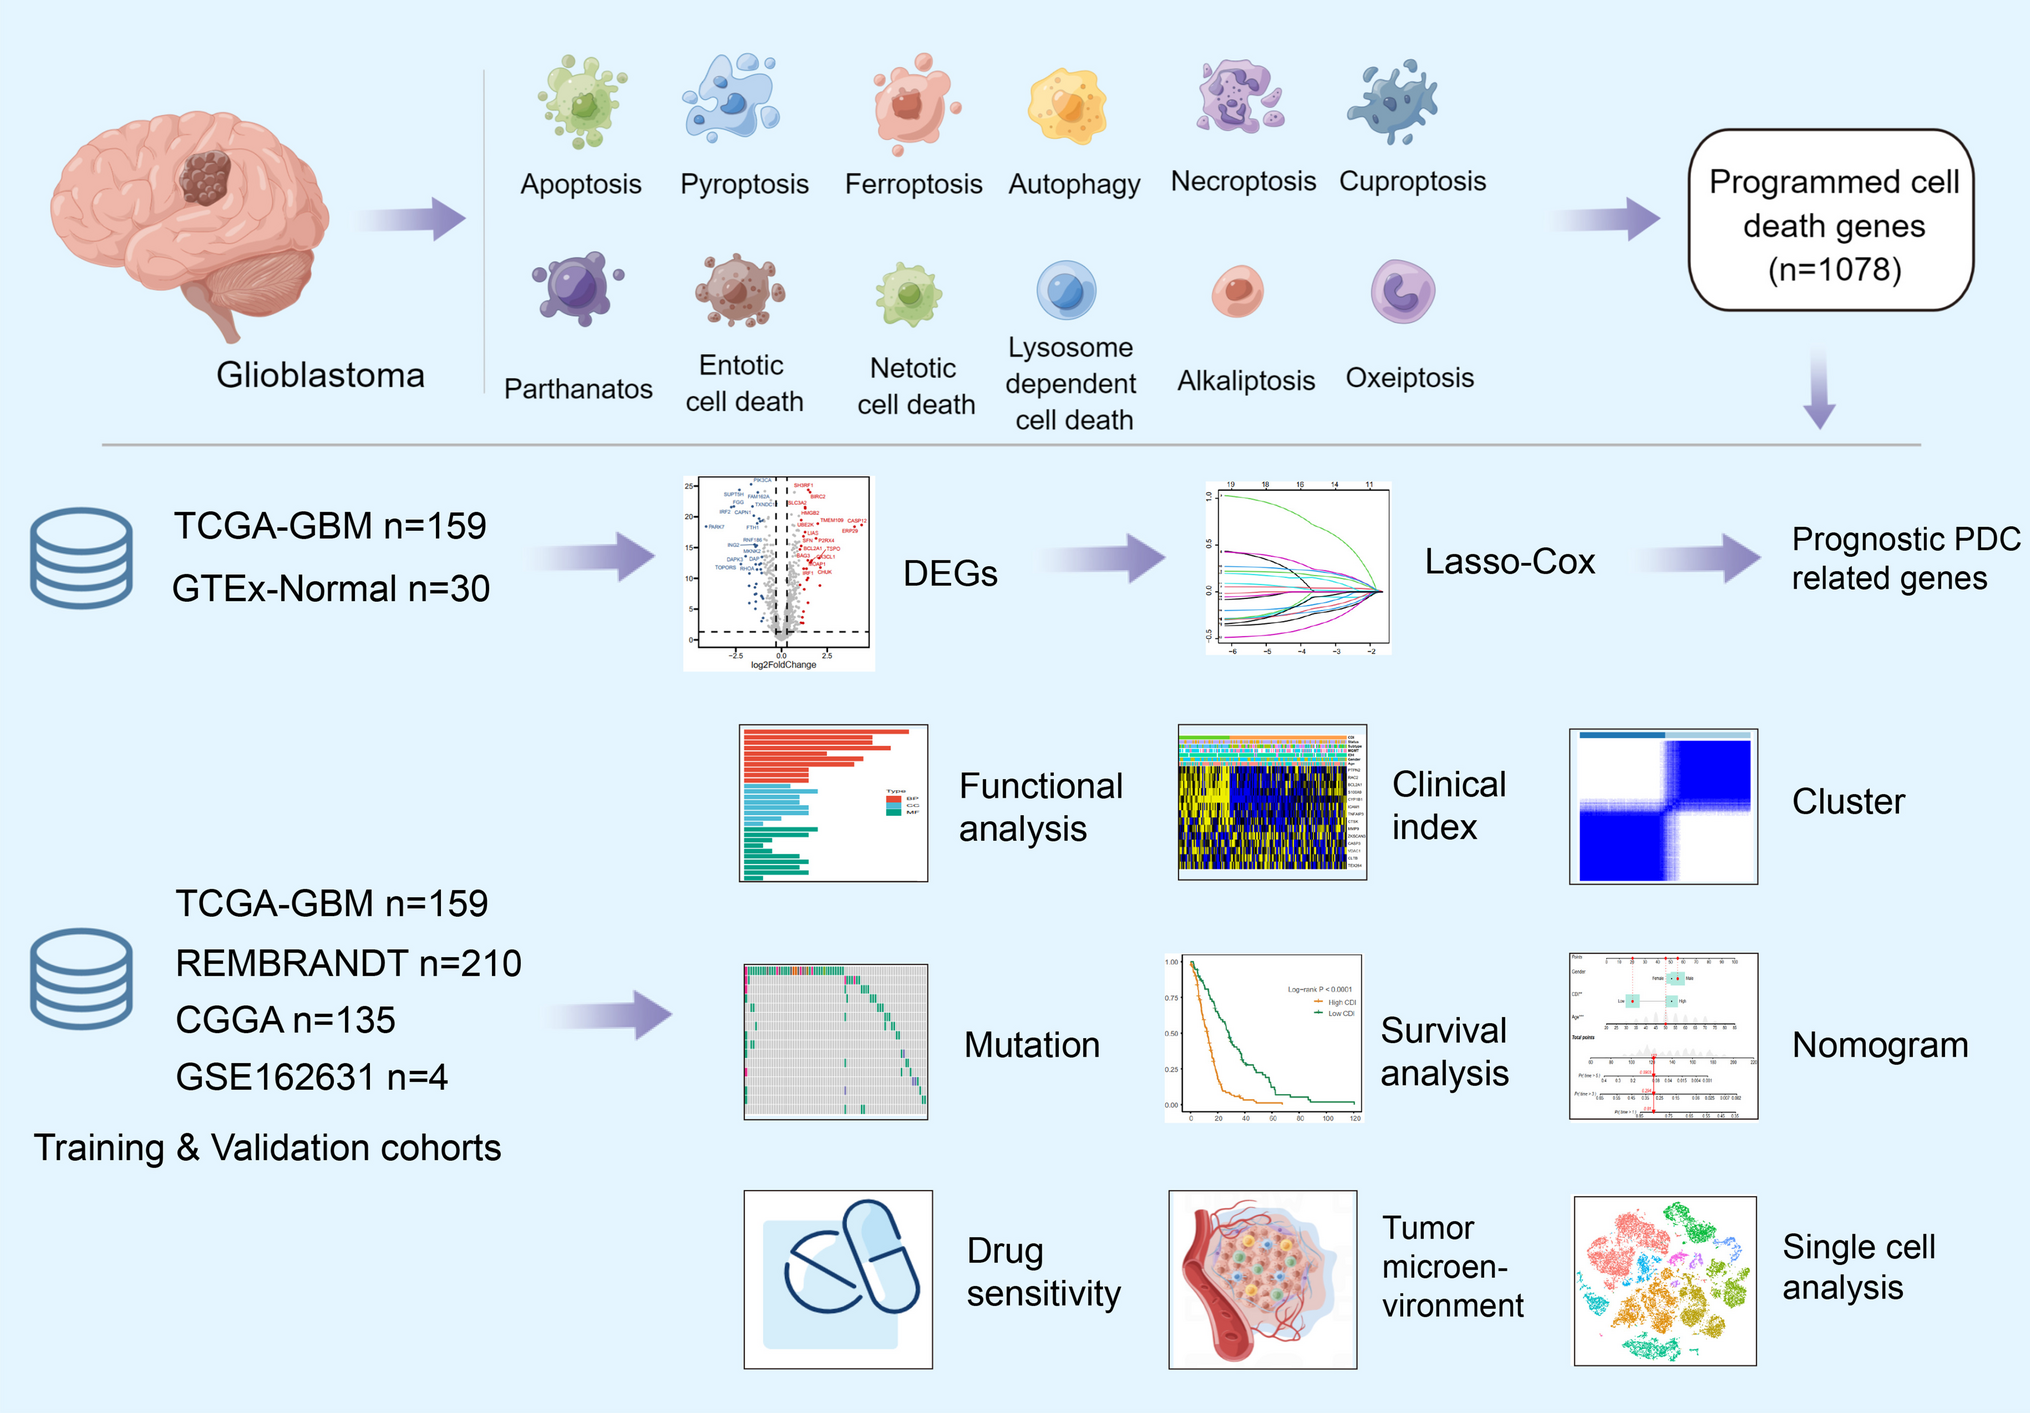


The TCGA-GBM database was selected as the training cohort, while the REMBRANT and CGGA databases were chosen as the validation cohorts for the prognosis predictive model. Transcriptional heterogeneity was evaluated using single-cell RNA-seq data (GSE162631) obtained from four patients with GBM. The detailed process of this study is illustrated in Fig. 1.
Fig. 1
Flowchart for comprehensive analysis of 11 programmed cell death (PCD) patterns in GBM patients
Differential Expression of PDC-Related Genes in GBM PatientsA total of 68 differentially expressed genes (DEGs) were identified in the TCGA-GBM dataset. The differentially expressed genes (DEGs) exhibited a p-value below 0.05 after adjustment and a fold change exceeding 1 on the absolute log2 scale. Out of these, the GBM group exhibited upregulation of 30 genes, whereas 38 genes showed downregulation. The heatmaps in Fig. 2A display the scaled RNA levels of the differentially expressed genes (DEGs). Furthermore, Fig. 2B showcases a volcano plot that emphasizes the differentially expressed genes (DEGs). For more in-depth details on the chromosomal position, expression trends, and associations of every DEG, refer to Fig. 2C. Moreover, the GO enrichment analysis revealed several biological pathways associated with these differentially expressed genes, as depicted in Fig. 2D. Furthermore, the examination evaluated the diversity of genes associated with PCD among patients with GBM in the TCGA group. The results revealed that approximately 16.7% of GBM patients exhibited mutations in PCD-related genes. In Fig. 2E, the top ten mutations of these genes are shown, with PIK3CA having the highest frequency of mutations (58%), followed by nine other genes ranging from 12 to 4% (Fig. 2F). Figure 2G depicts the connections among extensively mutated genes associated with PCD. Furthermore, the analysis of CNV status revealed frequent changes in genes associated with PCD. In particular, PARK7 displayed the highest occurrence of CNV deletion, while YPIK3CA demonstrated notable amplifications in copy number (Fig. 2H).
Fig. 2
Differential expression of PDC-related genes in GBM Patients. A, B Heatmap and volcano plot of the PDC-related DEGs between GBM and normal tissues. C The location, expression, and correlation of PCD-related differential expression genes (DGEs) in the TCGA cohort. D GO enrichment analyses based on the DEGs. E, F An oncoplot of PCD-related genes in the TCGA cohort. G The correlogram of interactions between highly mutated PCD-related genes. H CNV values of PCD-related genes in the TCGA cohort
Prognostic Signature Construction with PCD-Related GenesSurvival data from GBM patients was collected and subjected to analysis. At first, a univariate Cox regression analysis was used to discover 19 genes linked to survival. Figure S1 demonstrates the further validation of the results through Kaplan–Meier analysis. LASSO Cox regression analysis effectively reduced features in high-dimensional data and optimized predictors of clinical outcomes. The vertical dotted line in Fig. 3A corresponds to the penalty value of the lowest point (that is, the upper coordinate corresponding to the lowest point of the curve). Then, we find the vertical line corresponding to the corresponding position of the penalty value in Fig. 3B. The number of intersecting points is the number of variables included in the final model, and the ordinate of the corresponding intersection point is the regression coefficient of the variable. We took the value of log(λ) to − 3, and 14 genes were finally selected from 19 genes. Among these genes, there were eight genes associated with apoptosis, five genes linked to autophagy, three genes connected to lysosome-dependent cell death, two genes related to necroptosis, and one gene associated with pyroptosis. Figure S2 illustrates the examination and representation of the association among every gene in the model. Moreover, the levels of expression for these 14 genes were compared between TNBC tissues and normal samples using the Wilcoxon test (Figure S3). Significant differences (p < 0.05) were detected in the expression of all 14 genes. The hazard model was constructed by combining the 14 PCD-associated genes using their coefficients from the multivariate Cox analysis, according to the formula:
Fig. 3
Prognostic signature construction with PCD-related genes. A, B Identification of the 14 model genes by LASSO regression analysis. C Violin plots of the relationship between CDI and different GBM molecular subtypes. D Heatmap of 12 model genes and clinical features. E Pathway enrichment analysis between high- and low-CDI groups by GSEA
$$\beginCDI=\left(E_2\mathrm A1}\times0.15\right)+\left(E_3}\times-0.05\right)+\left(E_}\times0.14\right)\\+\left(E_}\times-0.19\right)+\left(E_1\mathrm B1}\times0.60\right)+_1}\times-0.03)\\+(E_9}\times0.03)+(E_2}\times-0.29)+(E_2}\times-0.09)\\+(E_\times0.19)+(E_264}\times0.01)+(E_3}\times0.11)\\+(E_1}\times-0.18)+(E_3}\times0.20)\end$$
EBCL2A1 represents the expression value of the gene BCL2A1, while the remaining genes have a similar representation to BCL2A1. Using the X-tile program, a threshold value of 1.58 was determined for CDI. Using this criterion, the TCGA cohort was segregated into a high-CDI group and a low-CDI group, comprising 159 GBM patients, which were then utilized as the training dataset. The presence of CDI was found to have a significant association with various clinical characteristics, such as distinct molecular subtypes of GBM (as shown in Fig. 3C). Heatmaps were employed to illustrate the associations between CDI and clinical characteristics, along with the status of survival. However, no significant relationship was observed (Fig. 3D). In order to further examine variations in biological processes among the subgroups classified by the gene signature, the application of gene set enrichment analysis (GSEA) was utilized. In the TCGA cohort, Fig. 3E showcases the top ten biological processes that have been identified.
Internal Training and External Validation of the PCD-Related SignatureThe results of our study showed that in the TCGA-GBM cohort, consisting of 159 patients, which served as the internal training dataset, as well as in the external validation cohorts REMBRANDT (210 patients) and CGGA (135 patients), individuals with elevated CDI levels (> 1.58) exhibited a decreased rate of survival in comparison to those with lower CDI levels (≤ 1.58) (as depicted in Fig. 4A). PCA was conducted to assess the categorization using CDI, and the findings demonstrated a favorable classification, as depicted in Fig. 4B. Furthermore, a significant distinction was noted in the duration of overall survival (OS) between the two groups with CDI. In particular, individuals in the low-CDI category demonstrated a greater likelihood of encountering reduced mortality rates (p < 0.05, as shown in Fig. 4C). Additionally, a connection was established between the mutation status and the CDI groups. Significantly, our results indicated a higher occurrence of PTEN mutations in patients belonging to the high-CDI group (p < 0.05, Figure S4).
Fig. 4
Internal training and external validation of the PCD-related signature. A Distribution of adjusted CDI according to the survival status and time in TCGA, REMBRANDT, and CGGA cohorts. B Principal component analysis (PCA) plot based on the CDI in TCGA, REMBRANDT, and CGGA cohorts. C Overall survival in the low- and high-CDI group patients in TCGA, REMBRANDT, and CGGA cohorts
Unsupervised Clustering of PCD-Related Model GenesA comprehensive analysis was carried out to investigate unknown variations of GBM, utilizing a collection of 14 genes associated with PCD. Significantly, the subgroups exhibited the most noticeable disparities when the value of k (number of clusters) was established as 2. The implication was that the TCGA-GBM cohort, consisting of 159 patients, could be successfully categorized into two separate groups, as shown in Fig. 5A and B. Moreover, there was a notable difference in the duration of overall survival (OS) time among these clusters, with a p-value of 0.032 (Fig. 5C). Cluster B exhibited a more favorable prognosis, while cluster A was characterized by a poorer prognosis. Similar results were also observed in the REMBRANDT dataset (p-value = 0.013) and the CGGA dataset (p-value = 0.081). Furthermore, the clusters were visualized using alluvial diagrams to depict the distribution patterns of CDI. Figure 5D shows that most patients in cluster A had elevated CDI values, while a significant number of patients in cluster B had decreased CDI values.
Fig. 5
Unsupervised clustering of PCD-related model genes. A GBM patients were grouped into two molecular clusters when k = 2, based on the PCD-related model genes. B Representative cumulative distribution function (CDF) curves. C Kaplan–Meier survival curve analysis between the two clusters. D Alluvial diagram shows the interrelationship between molecular clusters, survival status, and CDI groups in GBM patients
Construction and Assessment of the Nomogram Survival ModelTo ascertain whether CDI could serve as a prognostic factor independently, both univariate and multivariate Cox regression analyses were conducted. According to the univariate analysis findings, CDI was found to be a significant risk factor in comparison to other factors (HR = 4.27, 95% CI 2.76–6.61, p < 0.001, Fig. 6A). Furthermore, even after accounting for other influencing factors, the multivariate analysis revealed that CDI continued to be a separate predictive factor in GBM patients (HR = 3.13, 95% CI 1.81–5.41, p < 0.001, Fig. 6B). A nomogram model was created in the TCGA cohort using multivariable Cox regression and stepwise regression analyses to predict the overall survival (OS) for 1, 3, and 5 years. Figure 6C includes gender and CDI as predictor variables in the nomogram. The model’s predictive accuracy was calculated as 0.675 (95% CI 0.627–0.722), as indicated by its C-index value. To evaluate the precision of the model in forecasting the survival rates for 1, 3, and 5 years, calibration curves were created (Fig. 6D). Significantly, there was a clear contrast in survival rates between the high and low groups, as indicated by the nomogram score (Fig. 6E). In addition, the AUC values were assessed in three separate groups, indicating that the nomogram showed excellent precision in forecasting the survival of GBM patients for both 3 and 5 years (Fig. 6F).
Fig. 6
Construction and assessment of the nomogram survival model. A, B Univariate and multivariate analysis of CDI and the clinicopathologic characteristics. C A nomogram was established to predict the prognostic of GBM patients. D The calibration curve of the nomogram. E Kaplan–Meier analyses for the two GBM groups based on the nomogram score. F Receiver operator characteristic (ROC) analysis of nomogram in TCGA, REMBRANDT, and CGGA cohorts
Drug Sensitivity Analysis and Landscape of the Immune MicroenvironmentIn order to examine the correlation between the established model and drug responsiveness, we computed the IC50 values, representing the concentration at which half of the drug’s inhibitory effect is achieved, for every GBM sample to detect noteworthy variances. Figure 7A and B illustrate the relationship and importance of drug sensitivities and CDI. Surprisingly, the group with high CDI demonstrated increased IC50 values for carmustine and AZD5991, suggesting a possible resistance to these medications. Conversely, 5-fluorouracil and dasatinib exhibited lower IC50 values, suggesting a possible susceptibility to these medications. The results indicate that individuals with elevated CDI levels in GBM may exhibit resistance to carmustine but could potentially show sensitivity to 5-fluorouracil. Consequently, 5-fluorouracil shows promise as a treatment option for chemotherapy-resistant GBM patients with high CDI.
Fig. 7
Drug sensitivity analysis and landscape of the immune microenvironment. A Bubble plot of the correlation between drugs and model genes. B Boxplots of IC50 of carmustine, AZD5991, 5-fluorouracil, and dasatinib in high- and low-CDI groups. C Bar plot of the correlation between immunomodulators and the CDI values in GBM patients
Furthermore, we performed an examination to discern disparities in immunomodulating agents and cells associated with the immune system among the two groups with CDI. According to the bar graph shown in Fig. 7C, it can be inferred that the low-CDI group might demonstrate more robust immune responses. In addition, the enrichment scores for immune-related cells were computed, revealing that only consistently activated NK cells exhibited significantly elevated levels in the low-CDI group across the three cohorts. Figure S5 demonstrates a notable positive correlation between CDI and the increased activation of these elevated levels of NK cells.
Single-Cell RNA Transcriptome Data in GBMTo acquire a more comprehensive comprehension of the distribution of CDI in GBM patients, we examined data from the single-cell RNA transcriptome (GSE162631). Following the process of quality control (as shown in Figure S6A-B), the cells underwent clustering using the FindNeighbors and FindClusters functions, with a resolution of 0.1, which led to the formation of nine distinct clusters (as depicted in Figs. 8A and B and S6C). Figure S6D displays the top five marker genes for every cell type. Using the Garnett package, we performed cluster annotation and tSNE visualization of downscaled cell types, identifying 22 known cell types (Fig. 8C). In the GBM microenvironment, it was noticed that monocytes displayed higher CDI values compared to other cell types among these cell types (Fig. 8D). The ReactomeGSA analysis showed that COX reactions, histamine receptors, MGMT-mediated DNA damage reversal, and classical antibody-mediated complement activation pathways were mainly associated with memory B cells, dendritic cells, monocytes, CD8 + T cells, activated mast cells, and plasma cells (Fig. 8E). Moreover, we examined the association between the 14 genes associated with PCD and the CytoTRACE score, which forecasts the developmental capacity of a cell. According to this analysis (Fig. 8F), monocytes exhibited a greater capacity for development. Furthermore, by employing RNA velocity, the cells exhibiting the greatest CytoTRACE score, which signifies the least mature cells, were assigned to the initial point of the trajectory. In order to further explore the communication between cells, we examined the connection among monocytes and memory B cells, dendritic cells, CD8 + T cells, activated mast cells, and plasma cells. Significantly, the involvement of ICAM1-ITGAL, ICAM1-SPN, and ICAM1-AREG in monocytes was observed to have pivotal functions in ligand-receptor interactions (Fig. 8G).
Fig. 8
Single-cell RNA transcriptome data analysis in GBM. A–C Cluster annotation and cell type identification by tSNE. D Boxplots showing CDI of six subtypes of cell in GBM microenvironment and feature plot showing CDI of monocytes. E Functional enrichment analysis of identified six cell types. F Correlation between 14 PCD-related genes and CytoTRACE score and a predicted higher developmental potential for monocytes (cells with the highest CytoTRACE score mapped to the starting point of the trajectory by RNA velocity). G Among the six cell types, there were high cell-to-cell correlations in terms of the number and intensity of ligand-receptor interactions
留言 (0)