
記住我
Bordetella bronchiseptica is a highly contagious, gram-negative, bacterial veterinary pathogen. It can serve as the primary etiologic agent or as a co-contributor to a spectrum of clinical disease outcomes ranging from asymptomatic carriage to severe bronchopneumonia (Mattoo and Cherry, 2005; Brockmeier et al., 2019; Chambers et al., 2019). B. bronchiseptica is closely related to Bordetella pertussis and Bordetella parapertussis, the causative agents of whooping cough in humans (Goodnow, 1980; Parkhill et al., 2003; Preston et al., 2004; Diavatopoulos et al., 2005). In fact, data suggest that B. pertussis and B. parapertussis evolved from a B. bronchiseptica ancestor (Parkhill et al., 2003; Preston et al., 2004; Diavatopoulos et al., 2005). In addition to their close genetic relatedness, classical Bordetella species harbor many of the same virulence factors, which are similarly regulated (Parkhill et al., 2003; Linz et al., 2016; Chen and Stibitz, 2019). Despite these similarities, the classical Bordetella species differ in traits such as host specificity, disease severity, and duration of infection. B. pertussis only infects humans, lacks an animal reservoir, and lacks the ability to survive in the environment (Hewlett et al., 2014; Pinto and Merkel, 2017). In contrast, B. bronchiseptica infects a variety of animals, often establishing chronic infections that range from lethal pneumonia to asymptomatic carriage and is capable of surviving in the environment (Goodnow, 1980; Brockmeier et al., 2019). While rare and more frequent in immunocompromised individuals, human infections have been reported (Register et al., 2012; Agarwal et al., 2022; Barcala Salido et al., 2022; Moore et al., 2022).
A key regulatory mechanism is shared among the classical Bordetella species in that the majority of virulence gene expression is regulated by a two-component sensory transduction system encoded by the bvg locus. This locus comprises a histidine kinase sensor protein, BvgS, and a DNA-binding response-regulator protein, BvgA. In response to environmental cues, such as temperature, MgSO4, or nicotinic acid concentrations, BvgAS controls expression of a spectrum of phenotypic phases transitioning between a virulent (Bvg+) phase and a non-virulent (Bvg-) mode, a process referred to as phenotypic modulation. During the virulent Bvg+ phase, the BvgAS system is fully active and virulence-activated genes (vags), such as filamentous hemagglutinin (FHA), pertactin (PRN), fimbriae, adenylate cyclase toxin (ACT), and a type III secretion system (T3SS), are fully expressed (Cotter and Jones, 2003). Conversely, BvgAS is inactive during the Bvg-phase, resulting in the maximal expression of motility loci and virulence-repressed genes (vrg genes) (Akerley et al., 1992, 1995; McMillan et al., 1996).
Two genes, bvgR and risA, have been demonstrated to be involved in the regulation of vrgs (Merkel and Stibitz, 1995; Croinin et al., 2005). BvgR is a vag and functions as a repressor to vrg genes during non-modulating (Bvg+) conditions (Merkel and Stibitz, 1995; Merkel et al., 1998). RisA is a member of the OmpR family of two-component response regulators and has been demonstrated to be required for maximal expression of at least some vrgs (Croinin et al., 2005; Stenson et al., 2005). The risA gene is adjacent to risS encoding a sensor kinase of the RisA/S two-component system (Chen et al., 2017). risA was originally identified and named from a B. bronchiseptica transposon mutagenesis screen as a gene required for survival (reduction in intracellular survival) (Jungnitz et al., 1998). While the regulatory mechanism of action for BvgR is not fully understood, it shares sequence similarity to diguanylate phosphodiesterases and contains a conserved EAL sequence found in diguanylate phosphodiesterases that are involved in the degradation of bis-(3′-5′)-cyclic-dimeric guanosine monophosphate (c-di-GMP). c-di-GMP is a bacterial second messenger known to regulate a variety of cellular processes and has been shown to promote biofilm formation and inhibit motility for B. bronchiseptica (Sisti et al., 2013).
The global transcriptional response orchestrated by BvgR and RisA in B. pertussis has recently been reported (Coutte et al., 2016). In this study we utilize RNA-sequencing to evaluate the global transcriptome of wildtype B. bronchiseptica, ΔbvgR, ΔrisA, risAD60N, and ΔrisAS during both modulating and non-modulating conditions. We additionally assess the contribution of BvgR, RisA, phosphorylation of RisA, and RisS to intracellular c-di-GMP and GMP levels, motility, and biofilm formation. Given the ancestral link between B. pertussis and B. bronchiseptica, the data reported here provides an evolutionary perspective on gene regulation and virulence phenotypes.
Materials and methods Bacterial strains and culture conditionsThe bacterial strains and plasmids used in this study are listed in Table 1. E. coli strains were grown in Lysogeny Broth (LB) medium or on Lysogeny Agar (LA) plates. All B. bronchiseptica strains were grown at 37° C on Bordet-Gengou (BG) agar (Difco, Sparks, MD) supplemented with 10% sheep’s blood or in Stainer-Scholte (SS) broth. When appropriate, antibiotics were included at the following concentrations: carbenicillin, 100 μg/mL; kanamycin, 100 μg/mL; streptomycin, 40 μg/mL; chloramphenicol, 30 μg/mL; gentamicin, 100 μg/mL; and 200 ug/mL 2, 6-diaminopimelic acid (DAP). BG agar or SS broth supplemented with 50 mM MgSO4 was used to induce the Bvg-mode of B. bronchiseptica strains.
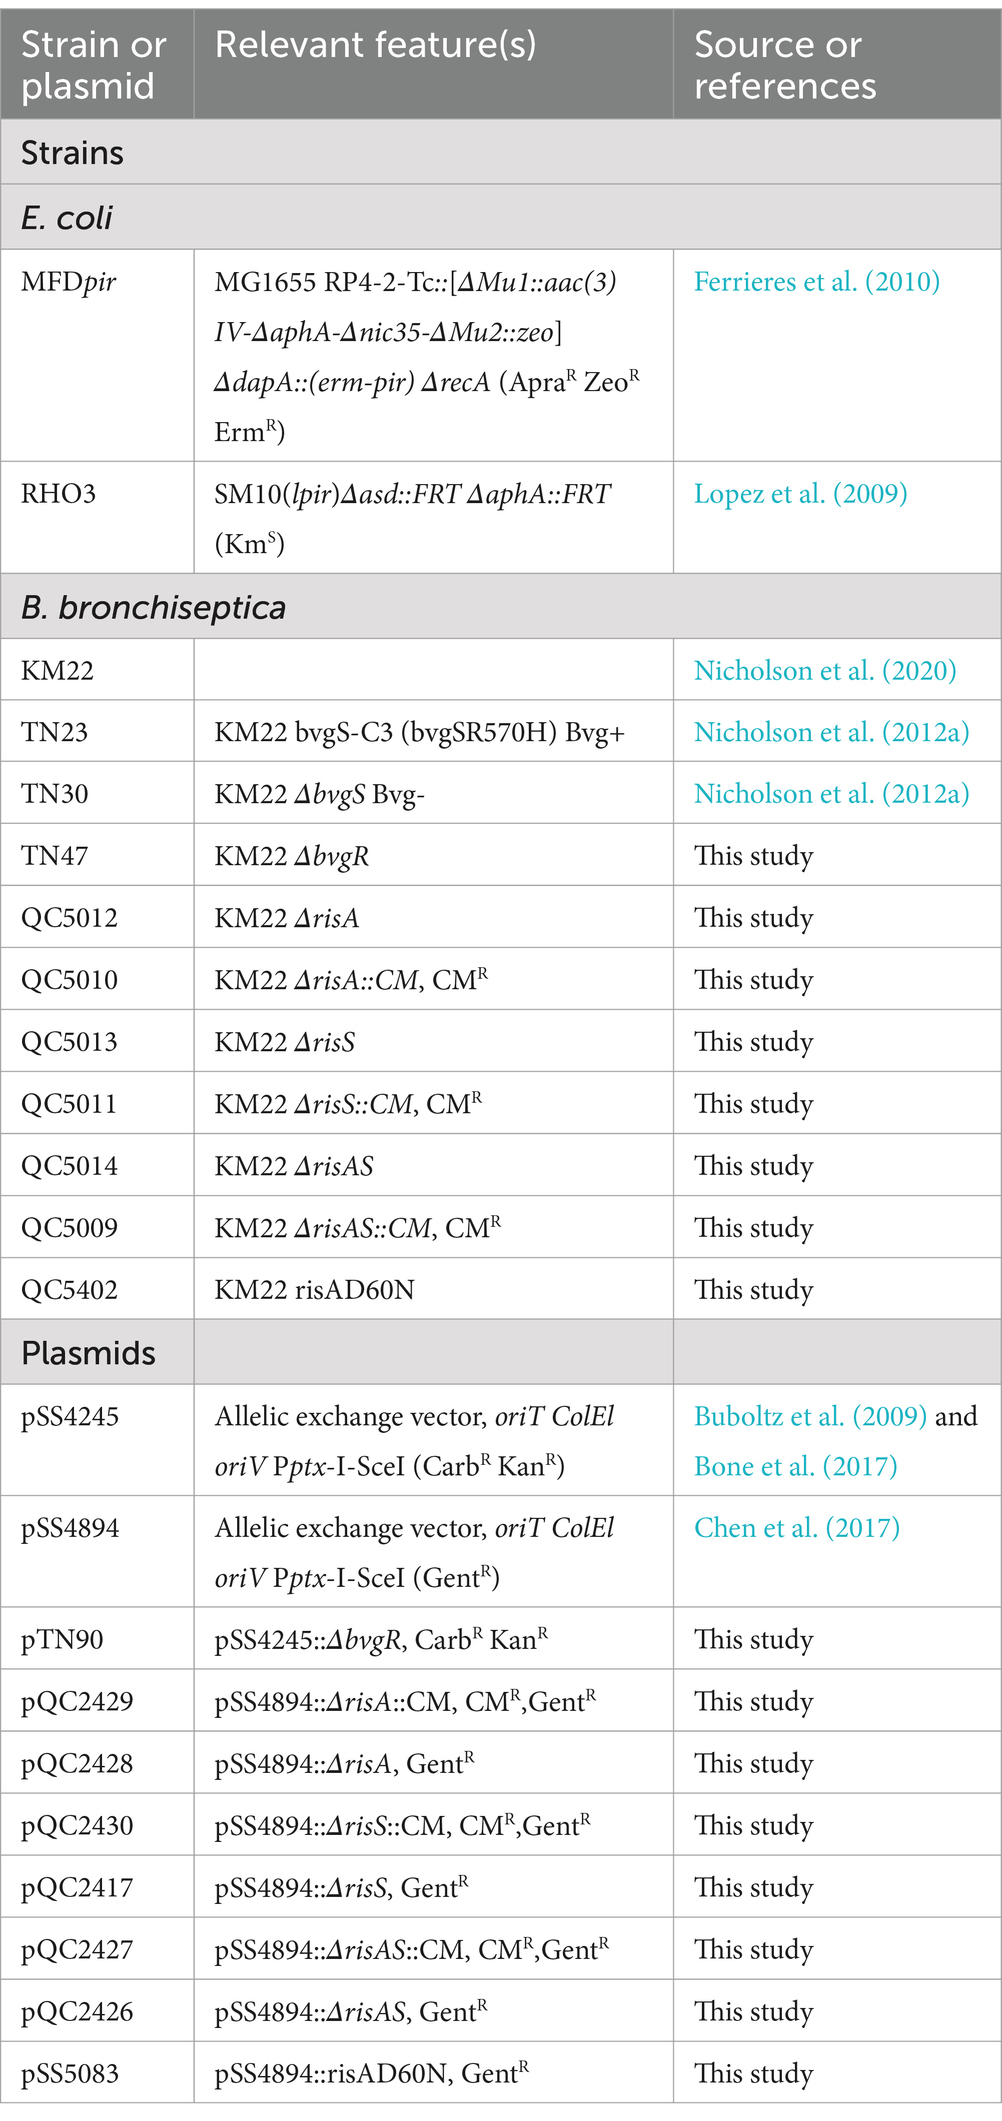
Table 1. Bacterial strains and plasmids used in this study.
Construction of Bordetella bronchiseptica mutant strains harboring in-frame deletions or a single-base mutationFor construction of TN47 (KM22ΔbvgR), a 1,520-bp DNA fragment (Eurofins Genomics Blue Heron, Bothell, WA) containing a 759-bp upstream region, which included 755 bps upstream of bvgR and the first two bps of bvgR, and a 761-bp downstream region, which included the last 4 bp of bvgR and extending 751 bps downstream of bvgR, flanked by SpeI and BamHI sites was cloned, following digestion, into pSS4245 using the same sites. The resulting plasmid pTN90 was then transformed into E. coli MFDpir, with selection on LA supplemented with kanamycin and DAP. The recipient KM22 was grown on BG agar supplemented with streptomycin and 50 mM MgSO4 prior to mating, which was performed on BG agar supplemented with 10 mM MgCl2 and 50 mM MgSO4 for 5 h at 37°C. Cointegrants were selected on BG agar supplemented with 50 mM MgSO4 and carbenicillin and kanamycin. Colonies arising from this selection were then then plated on BG agar supplemented with streptomycin. Resulting colonies were then screened for the loss of the suicide vector by sensitivity to carbenicillin and by PCR for incorporation of the deletion allele. A single colony, designated TN47 hence forth referred to as ΔbvgR, was selected for subsequent use and was further confirmed by PCR amplification of the upstream and downstream regions of the bvgR gene followed by DNA sequence analysis.
For the ΔrisA construction, two 500 bp DNA fragments flanking the region to be deleted, i.e., from the first 5 to the last 5 codons of risA, were generated by PCR using KM22 genomic DNA as a template and primer pairs Q2186 (5′-tatggtctccggccgccacgaccgcgtcgtcggccgccgcgc) & Q2230 (5′- tatggtctccaattggttttgcgtgttcatggccggaaatgtaacagtgacaagaaccagc), and Q2231 (5′-tat ggtctccaattggatggcggcagttgacctaatggcccgccccgggcaggagcgc) & Q2203 (5′-tatggtctcggatcccagcgccgtggcgccccagcccagccattcgatgcc). Following BsaI restriction enzyme digestion, the resulting NotI-MfeI and MfeI-BamHI fragments were ligated together with NotI and BamHI cleaved pSS4894 to generate plasmid pQC2428 (pSS4894::ΔrisA, GentR) containing a MfeI site at the deletion point between the two flanking regions. To facilitate the allelic exchange, a 762-bp DNA fragment (Biomatik USA, Wilmington, DE) encoding a chloramphenicol resistance cassette flanked by EcoRI sites was cloned, following digestion, into pQC2428 to create pQC2429 (pSS4894::ΔrisA::CM, CMR, GentR). Both pQC2428 and pQC2429 were transformed into E. coli RHO3, with selection on LA supplemented with gentamicin and DAP, and used as donor strains.
Construction of QC5012 (KM22 ΔrisA) was created employing a two-step process. The first step resulted in the construction of QC5010 (KM22 ΔrisA::CM), in which the internal portion of the risA allele was replaced with a chloramphenicol resistance cassette. To introduce ΔrisA::CM, the donor RHO3[pQC2429] was swabbed together with the KM22 recipient onto BG agar supplemented with DAP. After incubation for 3 h at 37°C the cells were streaked onto selective media, i.e., BG plus chloramphenicol and grown for 3 days at 37°C. Allelic replacement under these conditions occurs via a single step involving two homologous recombination events in the flanking DNA of the plasmid that is linearized following conjugative transfer, induction of I-SceI synthesis, and cleavage at the I-SceI site in the vector. A candidate for replacement of risA with ΔrisA::CM was selected, screened, and saved as strain QC5010 (KM22 ΔrisA::CM). To replace ΔrisA::CM with an ΔrisA in the second step, QC5010 (KM22 ΔrisA::CM) was used as a recipient in a mating with RHO3[pQC2428]. This mating was performed maintaining modulation of the recipient KM22 in all steps by the addition of 50 mM MgSO4 to the recipient growth plate, the mating plate, and the selection plate. In addition, the mating plate contained DAP, and the selection plate contained chloramphenicol and gentamicin. Plasmid-integrants arising from this mating were subsequently restreaked onto plain BG plate. Under such conditions, synthesis of I-SceI is induced, integrated plasmid is cleaved, and survivors arise by repair of the double-strand break by homologous recombination. Those in which the ΔrisA replaced the ΔrisA::CM allele were identified by their chloramphenicol-sensitive phenotype. One of these was chosen as QC5012 (KM22 ΔrisA) and confirmed by PCR and sequencing.
For the ΔrisS construct, two 500 bp DNA fragments flanking the region to be deleted, i.e., from the first 5 to the last 5 codons of risS, were generated by PCR using KM22 genomic DNA as a template and primer pairs Q2204(5′ tatggtctccggccgcatctgccgccgcctgcgcggcggccacgac) & Q2209 (5′ tatggtctcaattgctcctgcccggggcgggccattaggtca), and Q2210 (5′ tatggtctcaattgttagacagccaaaaccaatagcgtag) & Q2189(5′ tatggtctccgga tccatcgtgttgtcggggtcgacgatg). Following BsaI cleavge, the resulting NotI-MfeI and MfeI-BamHI fragments were ligated together with NotI and BamHI cleaved pSS4894 to generate plasmid pQC2417 (pSS4894::ΔrisS, GentR) containing a MfeI site at the deletion point between the two flanking regions. To facilitate the allelic exchange, a 762-bp DNA fragment (Biomatik USA, Wilmington, DE) encoding a chloramphenicol resistance cassette flanked by EcoRI sites was cloned, following digestion, into pQC2417 to create pQC2430 (pSS4894::ΔrisS::CM, CMR, GentR). Both pQC2417 and pQC2430 were transformed into E. coli RHO3, with selection on LA supplemented with gentamicin and DAP, and used as donor strains.
Construction of QC5013 (KM22 ΔrisS) was created employing a two-step process similarly as described above. The first step resulted in the construction of QC5011 (KM22 ΔrisS::CM), using the donor RHO3[pQC2430] and the KM22 recipient. To replace ΔrisS::CM with an ΔrisS in the second step, QC5011 (KM22 ΔrisA::CM) was used as a recipient in a mating with RHO3[pQC2417] to create QC5013 which was confirmed by PCR and sequencing.
For the ΔrisAS construct, two 500 bp DNA fragments flanking the region to be deleted, i.e., from the first 5 of risA to the last 5 codons of risS, were generated by PCR using KM22 genomic DNA as a template and primer pairs Q2186 (5′ tatggtctccggccgccacgaccgcgtcgtcggc cgccgcgc) & Q2230 (5′ tatggtctccaattggttttgcgtgttcatggccggaaat gtaacagtgacaagaaccagc), and Q2210 (5′ tatggtctcaattgtt agacagccaaaaccaatagcgtag) & Q2189 (5′T atggtctccggatccatc gtgttgtcggggtcgacgatg). Following BsaI digestion, the resulting NotI-MfeI and MfeI-BamHI fragments were ligated together with NotI and BamHI cleaved pSS4894 to generate plasmid pQC2426 (pSS4894::ΔrisAS, GentR) containing a MfeI site at the deletion point between the two flanking regions. To facilitate the allelic exchange, a 762-bp DNA fragment (Biomatik USA, Wilmington, DE) encoding a chloramphenicol resistance cassette flanked by EcoRI sites was cloned, following digestion, into pQC2426 to create pQC2427 (pSS4894::ΔrisAS::CM, CMR, GentR). Both pQC2426 and pQC2427 were transformed into E. coli RHO3, with selection on LA supplemented with gentamicin and DAP, and used as donor strains.
Construction of QC5014 (KM22 ΔrisAS) was created employing a two-step process similarly as described above. The first step resulted in the construction of QC5009 (KM22 ΔrisAS::CM), using the donor RHO3[pQC2427] and the KM22 recipient. To replace ΔrisAS::CM with an ΔrisS in the second step, QC5009 (KM22 ΔrisAA::CM) was used as a recipient in a mating with RHO3[pQC2426] to create QC5014 which was confirmed by PCR and sequencing.
To obtain the risAD60N allele (Chen et al., 2017), fragments comprising sequences flanking the mutation were synthesized using PCR amplification with KM22 genomic DNA as a template. The upstream fragment was amplified with primers 3493* (5′-tataggtctccggccgcggtggtgaaggccaccttgtc) and 3499 (5′-tatag gtctccatcaggttgagaaccagcaggtcaaagtg). The downstream fragment was amplified with primers 3501 (5′-tataggtctcctgatgctgccgggcg aggatggcctgtcgatc) and 3496* (5′-tataggtctcggatccgatctggccgag gtcctcgtcgatg). Both fragments were digested with the BsaI to create cohesive ends compatible with EagI at one end of the first PCR fragment and with BamHI at one end of the second PCR fragment. BsaI cleavage also generated cohesive ends, allowing two PCR fragments joined in the middle along with the D60N mutations incorporated into the primer 3499. The two BsaI digested fragments were ligated together with pSS4984 digested with EagI and BamHI, transformed, and screened to create pSS5083. The resulting plasmid pSS5083 was then transformed into E. coli RHO3, with selection on LA supplemented with gentamicin and DAP.
To construct QC5402 (KM22 risAD60N), QC5010 (KM22 ΔrisA::CM) was used as a recipient in a mating with RHO3[pSS5083]. This mating was performed maintaining modulation of the recipient KM22 in all steps by the addition of 50 mM MgSO4 to the recipient growth plate, the mating plate, and the selection plate. In addition, the mating plate contained DAP, and the selection plate contained chloramphenicol and gentamicin. Plasmid-integrants arising from this mating were subsequently restreaked onto plain BG plate. One of those in which the risAD60N replaced the ΔrisA::CM allele was identified as QC5402 by its chloramphenicol sensitive, PCR and sequencing.
Growth kinetics of Bordetella bronchiseptica strainsFor each strain, a single colony was inoculated in SS broth supplemented with 40 μg/mL streptomycin and grown overnight at 37°C with shaking at 275 rpm. Overnight cultures were then diluted to an OD600 of 0.5 in SS broth supplemented with 40 μg/mL streptomycin and with or without 50 mM MgSO4. 100 μL of culture for each strain (biological replicates) were transferred into four wells (technical replicates) of a microplate. Plates were incubated in a high throughput microplate reader (Bioscreen C, Growth Curves USA, Piscataway, NJ) at 37°C with gentle agitation and the OD600 was measured every 30 min for 24 h. Results were analyzed using Prism 9 Software (GraphPad, San Diego, CA). At least four independent experiments with four technical replicates in each experiment were performed. After 11 h of growth at 37°C with shaking at 275 rpm, serial dilutions of each strain were plated on BG agar plates to determine CFU/mL and to confirm the expected colony morphology and hemolytic phenotype.
RNA extraction of Bordetella bronchispetica strainsFor each strain, a single colony was inoculated in 14 mL polystyrene round-bottom tubes (Corning Falcon, Glendale, AZ) containing 2 mLs SS broth supplemented with 40 μg/mL streptomycin and grown overnight at 37°C with shaking at 275 rpm. Overnight cultures were then diluted to an OD600 of 0.5 in a 250-ml flask containing 10 mL SS broth supplemented with 40 μg/mL streptomycin and with or without 50 mM MgSO4 and incubated for 11 h at 37°C with shaking at 275 rpm. Four biological replicates were prepared for each strain and grown in non-modulating (Bvg+) conditions and in modulating (Bvg-) conditions. For RNA extraction, bacteria were pelleted by centrifugation at 4,000 × g at 4°C for 10 min. Supernatant was decanted, and bacteria were resuspended in TRI reagent (ThermoFisher Scientific, Waltham, MA), incubated at room temperature for 5 min, then stored at-80°C until RNA isolation. RNA was extracted from samples using the Direct-zol RNA Miniprep Kit (Zymo Research, Irvine, CA) following manufacturer’s instructions. On-column DNase treatment was performed using the RNase-free DNase set (Qiagen, Germantown, MD). RNA samples were then further processed using an RNA Clean & Concentrator kit (Zymo Research, Irvine, CA) following manufacturer’s instructions. To remove residual prokaryotic rRNA, the DNA-free total RNA samples were treated with the Ribo-Zero Gold Epidemiology Kit (Illumina, San Diego, CA) according to manufacturer’s instructions. Removal of rRNA was assessed using the Agilent 2,100 Bioanalyzer RNA 6000 Pico kit (Agilent Technologies, Santa Clara, CA). Samples were submitted to the Iowa State University DNA Facility in Ames, IA for library preparation using the Stranded Total RNASeq library preparation kit (Illumina, San Diego, CA). Libraries were sequenced on two flow cells using the Illumina HiSeq 3,000 platform to generate 150-nucleotide single-end reads on high output mode.
Gene expression analysisThe expression analysis approach consisted of multiple open-source software. Sample read quality was checked using FastQC (Blankenberg et al., 2010) prior to alignment which was performed using BWA-MEM (Li and Durbin, 2010). Unnormalized (raw) read counts and QC based on a minimum quality score of 20 and only unique mapping reads were performed using FeatureCounts with final expression values being determined using DeSeq2 (Liao et al., 2014; Love et al., 2014). Data was organized by mutant vs. wildtype modulated, mutant vs. wildtype non-modulated, and non-modulated vs. modulated. An FDR cut-off of ≤0.1 was used to filter the expression data based on a KM22 GenBank assembly file (accession number CP022962.2) to create a GFF formatted file for annotation. The data was based on the reverse-strand counts and genes showing an FDR of 0.00E+00 were included as this value is inserted by the software due to the floating point for p-values in R having a max value of ~1E-308.
Expression visualization and analysisThe gene list along with the annotations from RAST and the KM22 locus tags were used to create GCT 1.2 formatted files for heatmap visualization and hierarchical clustering analysis. The GCT file is a tab-separated text file. The file has the GCT version on the first row, the “# of rows of data,” and the “# of the number of columns” with numerical data on the second row. The third row starts the data columns, with the first column being row names (ex. gene Id’s) and the expression values for each group (header) in subsequent columns. The number of columns must match the value on the second row of the GCT 1.2 file. The GCT file was then used as input for the expression matrix visualization program MORPHEUS. Within MORPHEUS, hierarchical clustering of the expression values was carried out using a distance method metric of 1-Pearson correlation and complete linkage. Clustering was performed on columns and rows. For heatmaps, all duplicate gene names and all genes with an “NA” value were removed. All hypothetical and putative KM22 locus genes were also removed and annotation based on KM22 locus tags using MG-RAST were added (Keegan et al., 2016). Filtering of these ambiguous tags reduced the gene list from 4,807 KM22 locus tags to 2,337 unique gene descriptions from RAST.
Statistical visualizationTreatment and control group samples were compared across expression values to examine the presence or lack of collinearity among the samples. Statistical analysis of collinearity was performed using the Variables exploration package in Galaxy. A correlation matrix was obtained and visualized as a PCA plot (Supplementary Figure S2) using R packages ggplot2 and ggfortify (Wickham, 2009; Tang et al., 2016). The PCA plot demonstrated that the different groups clustered together discretely based on the treatment classes used in each comparison.
cDNA preparation and qPCRrRNA depleted and DNA-free RNA (1 μg 150 ng per 20 μL RT reaction) from each biological replicate was reverse transcribed using 300 ng of random oligonucleotide hexamers and LunaScript RT SuperMix Kit (New England Biolabs, Ipswich, MA) according to the manufacturer’s protocol. The resulting cDNA was diluted 1:1,000, and 1 μL of this dilution was used in qPCR reactions containing 250 nM primers and Luna Universal qPCR Master Mix (New England Biolabs, Ipswich, MA) using a QuantStudio 3 real-time PCR detection system (Thermo Fisher Scientific, Waltham, MA). Primers were designed using Geneious Prime (Biomatters Ltd., Auckland, New Zealand) and listed in Supplementary Table S1. To confirm the lack of DNA contamination, reactions without reverse transcriptase were performed. Dissociation curve analysis was performed for verification of product homogeneity. Threshold fluorescence was established within the geometric phase of exponential amplification and the Ct value for each reaction was determined. Fold-change in transcript level was determined using the relative quantitative method (ΔΔCT) (Livak and Schmittgen, 2001) with the recA amplicon used as the standardization control.
Extraction of c-di-GMP and GMPNucleotide extractions for all B. bronchiseptica strains were performed as previously described with slight modifications (Monds et al., 2010; Newell et al., 2011; Sisti et al., 2013; Jia et al., 2014). Briefly, a single colony from each strain was inoculated in SS broth supplemented with 40 μg/mL streptomycin and grown overnight at 37°C with shaking at 275 rpm. Overnight cultures were then diluted to an OD600 of 0.025 in 20 mLs SS broth supplemented with 40 μg/mL streptomycin and incubated for 24 h at 37°C with shaking at 275 rpm. Bacteria were pelleted by centrifugation at 10,000 × g at 4°C for 5 min. Prior to centrifugation, 100 μL of culture was removed for serial dilutions in PBS and then plated on blood agar plates to determine colony forming units (CFU)/mL counts. After centrifugation, supernatant was decanted, and bacteria were resuspended in cold 5 mL extraction buffer [methanol:acetonitrile:water (40:40:20) plus 0.1 M formic acid at −20°C], and 25 μL of 25 nM of 8-Bromoguanosine 3′,5′-cyclic monophosphate sodium salt (8-Br-cGMP/internal standard) (Millipore Sigma, Burlington, MA) was added. Samples were then incubated for 30 min at −20°C. Insoluble material was then removed by centrifugation at 20,000 × g at 4°C for 10 min and the supernatant containing the nucleotide extract was saved. The extraction procedure was repeated two more times on the retained cell pellet. Combined supernatants were then incubated overnight in SpeedVac using low heat and the residue containing extracted nucleotides was resuspended in 100 μL of water and stored at-80°C until quantified using liquid chromatography–tandem mass spectrometry (LC–MS/MS) analysis. Stock solutions of c-di-GMP (Biolog Life Science, Bremen, Germany) and GMP (Cayman Chemical, Ann Arbor, MI) were prepared and diluted for use as standards. 25 nM of 8-Br-cGMP was added to all standards. A minimum of four extractions were performed for each strain and final c-di-GMP and GMP concentrations were expressed as nmol/1×109 CFU. Results were analyzed for significance using Prism 9 Software (GraphPad, San Diego, CA). Means were compared using a one-way analysis of variance (ANOVA) with a Dunnett’s multiple comparison post-test. A 5% level of significance (p < 0.05) was considered significant.
Quantification of c-di-GMP by LC–MS/MSNucleotide extracts were submitted to the W.M. Keck Metabolomics Research Laboratory (Office of Biotechnology, Iowa State University, Ames IA). LC separations were performed with an Agilent Technologies 1,290 Infinity II UHPLC instrument coupled to a 6,470 triple quadrupole mass spectrometer with an electrospray ionization (ESI) source (Agilent Technologies, Santa Clara, CA). All solvents were LC–MS grade and were obtained from Fisher Chemical (Thermo Fisher Scientific Waltham, MA). Running solvents consisted of A: 0.1% formic acid in water with 1% methanol and B: 0.1% formic acid in 70% acetonitrile with 25% methanol and 5% water. The flow rate was 0.75 mL/min starting at 0% B and time 0 which was increased on a gradient to 25% B at 8 min, which was maintained until 12 min before returning to 0% B at 15 min runtime, a 5-min post run equilibration was preformed after each sample injection. The mass spectrometer was equipped with an electrospray ion source and was operated in positive and mode. Target molecules were detected using electrospray ionization in positive ionization mode. Nitrogen was used as the service gas for the ion source with a drying gas flow rate of 12 L/min at a temperature of 350°C, a nebulizing pressure of 40 psi, and a sheath gas flow of 11 L/min at 400°C. The capillary, nozzle, and fragmentor voltages were 4,000, 0, and 135 volts, respectively. The mass spectrometer was operated in multiple reaction monitoring (MRM) mode with MS/MS transitions targeting selected molecules (Table 2).
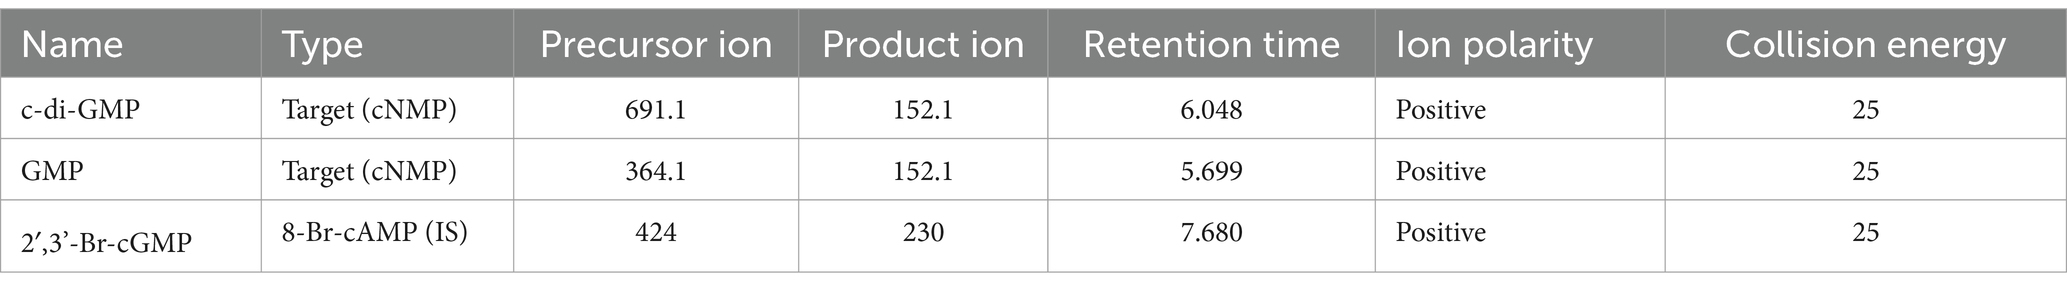
Table 2. LC–MS/MS parameters for the measured transitions of cyclic nucleotide monophosphates (cNMPs) and internal standard (IS).
LC–MS/MS analysis was based on previously published methods (Jia et al., 2014). Fifty microliter of liquid chromatography (LC) running solvent B was added to 100 μL of each extract and filtered with 0.2-micron centrifugal filters (Millipore Sigma, Burlington, MA) immediately prior to LC–MS/MS analysis. The samples were maintained in the autosampler chamber at 10°C. A volume of 20 μL of each sample was injected into the LC system and separated on a SphereClone 5 μm ODS(2) 80 A, LC Column 250 × 4.6 mm (Phenomenex, Torrance, CA), at 25°C, and an electrospray ion source operated in positive mode. LC–MS/MS peak quantification was accomplished using Agilent MassHunter Quantitative Analysis (version 10.0) software (Agilent Technologies, Santa Clara, CA) with all target analyte reported amounts calculated relative to the standard curve for each analyte and to the internal standard (2′,3’-Br-cGMP) for each sample.
Soft agar swimming motility assayMotility assays were performed as previously described (Nicholson et al., 2012a; Sukumar et al., 2014). Briefly, plates were prepared with Stainer-Scholte medium (SSM) containing 0.35% agarose, supplemented with or without 50 mM MgSO4 and marked with a cross to divide each plate into four quadrants. For each strain, a single colony was stab inoculated into each quadrant of a SSM plate and an SSM + MgSO4 plate and incubated at 37°C for 48 h. Motile organisms display outward migration from the point of inoculation and the diameter of the migration zone was measured at 24 and 48 h. Four experiments were performed. Results were analyzed for significance using Prism 9 Software (GraphPad, San Diego, CA). Means were compared using a two-way analysis of variance (ANOVA) with a Dunnett’s multiple comparisons test to compare differences among strains for each time point. A 5% level of significance (p < 0.05) was considered significant.
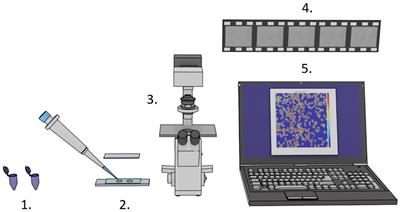
Microtiter plate assay for static biofilm formationA static biofilm assay was performed using crystal violet was performed as previously described (Nicholson et al., 2012b; Sukumar et al., 2014; Waack and Nicholson, 2018). Briefly, a single colony for each strain was inoculated in SS broth supplemented with 40 μg/mL streptomycin and grown overnight at 37°C with shaking at 275 rpm. Overnight cultures were then diluted to an OD600 of 0.250 in SS broth supplemented with 40 μg/mL streptomycin. Hundred microliter of culture for each strain (biological replicates) was transferred into 10 wells (technical replicates) of a U bottom, non-tissue-culture treated, 96-well polyvinyl chloride microtiter plate (BD Falcon, Corning, Kennebunk, ME). Plates were incubated statically for 24 h in a humidified 37° C incubator. The cultures were aspirated from the plate wells and each well was washed 3 times with 200 μL sterile PBS. Biofilms were fixed by the addition of 200 μL 100% ethanol and dried for 10 min. Biofilms were stained by the addition of 200 μL 0.1% crystal violet (CV) (Sigma, St. Louis, MO) to each well and incubated for 15 min. CV was removed and the wells were washed 3 times with 200 μL sterile PBS and the plate allowed to dry overnight. Bound CV dye was eluted by incubation for 10 min with 200 μL 100% ethanol. One hundred and twenty five microliter of the eluted CV was transferred to a new 96-well plate and biofilm biomass was quantified by measuring the absorbance at 595 nm (A595) in a microplate reader (SpectraMax M5, Molecular Devices, Sunnyvale, CA). Six independent experiments were performed. Results were analyzed for significance using Prism 9 Software (GraphPad, San Diego, CA). Means were compared using a one-way analysis of variance (ANOVA) with a Dunnett’s multiple comparison post-test. A 5% level of significance (p < 0.05) was considered significant.
Data availability statementAll raw sequencing reads have been deposited in the Sequence Read Archive (SRA) at under the BioProject accession number PRJNA1018256.
ResultsTo characterize the transcriptional responses governed by BvgR, RisA, and RisS, mutants harboring an in-frame deletion in each of the genes encoding these proteins were constructed in KM22. Additionally, an aspartate to asparagine mutation at D60 (D60N) in RisA was constructed to abolish the phosphorylated form of RisA, allowing the role of phosphorylation in transcriptional regulation to be evaluated (Chen et al., 2017). Growth of each mutant, along with KM22, was monitored for 24 h in non-modulating (Bvg+) conditions (Supplementary Figure S1A) or in modulating (Bvg-) conditions with 50 mM MgSO4 (Supplementary Figure S1B). No differences in growth kinetics were observed among strains grown in the same culture condition (Supplementary Figures S1A,B), indicating that each mutation did not produce a defect in growth rate. Additionally, 11 h was chosen as the optimal time-point to collect bacteria for RNA extraction because all isolates were in the exponential stage of growth (Supplementary Figures S1A,B). Similar CFU levels were then recovered from KM22 (WT) and all mutants after 11 h of growth in non-modulating (Bvg+) conditions and similar, yet higher CFU levels, were recovered from all strains grown in modulating (Bvg-) conditions (Supplementary Figure S1C). RNA-seq analyses were performed on KM22 (WT) and all mutants grown in non-modulating (Bvg+) conditions or grown in modulating (Bvg-) conditions to fully delineate the differential expression of each mutant in both conditions. A PCA plot based on correlation matrix of expression values for all genes in the experiment shows that the samples were positively correlated within the conditions they were treated (Supplementary Figure S2). The comparison of WT grown in non-modulating (Bvg+) conditions versus modulating (Bvg-) conditions was used to establish the full spectrum of vags and vrgs and included for reference in all comparisons for each mutant evaluated. In accordance with tradition, genes more abundant or upregulated in non-modulating (Bvg+) conditions were considered vags. Conversely, genes less abundant or downregulated in non-modulating (Bvg+) conditions were considered vrgs.
BvgR in non-modulating (Bvg+) conditionsWhen ΔbvgR was compared to WT in non-modulating (Bvg+) conditions, 126 genes were upregulated in ΔbvgR and 61 genes were downregulated (Supplementary Table S1). Of the genes upregulated in ΔbvgR, 98 were vrgs and include capsule genes and chemotaxis/ motility genes [Figure 1A (clusters a and b); Supplementary Table S1 (clusters a and b)]. The transcriptional profile of these genes indicated that they are repressed by BvgR in non-modulating (Bvg+) conditions. These genes can be further divided into vrgs that either maintained (cluster a) or lost (cluster b) an expected vrg transcriptional response, i.e., repressed or downregulated in non-modulating (Bvg+) conditions. Vrgs upregulated in ΔbvgR and maintained a classical vrg transcriptional response when ΔbvgR grown in non-modulating (Bvg+) conditions was compared to modulating (Bvg-) conditions include flaA and other chemotaxis/ motility genes [Figure 1A (cluster a); Table 3; Supplementary Table S1 (cluster a)]. The transcriptional profile of these genes indicated that although they were repressed by BvgR in non-modulating (Bvg+) conditions, BvgR is not required for modulation. In contrast, no significant change in gene expression was observed for 61 vrgs when ΔbvgR grown in non-modulating (Bvg+) conditions was compared to modulating (Bvg-) conditions. The no significant change in gene expression observed between non-modulating (Bvg+) and modulating (Bvg-) conditions by these vrgs indicated that they lost the expected vrg transcriptional response of repression or downregulation during non-modulating (Bvg+) conditions in the absence of BvgR. Genes within this cluster include wcbA and other capsule genes [Figure 1A (cluster b); Table 3; Supplementary Table S1 (cluster b)]. The transcriptional profile of these genes indicated that they were repressed by BvgR in non-modulating (Bvg+) conditions and BvgR was required for modulation.
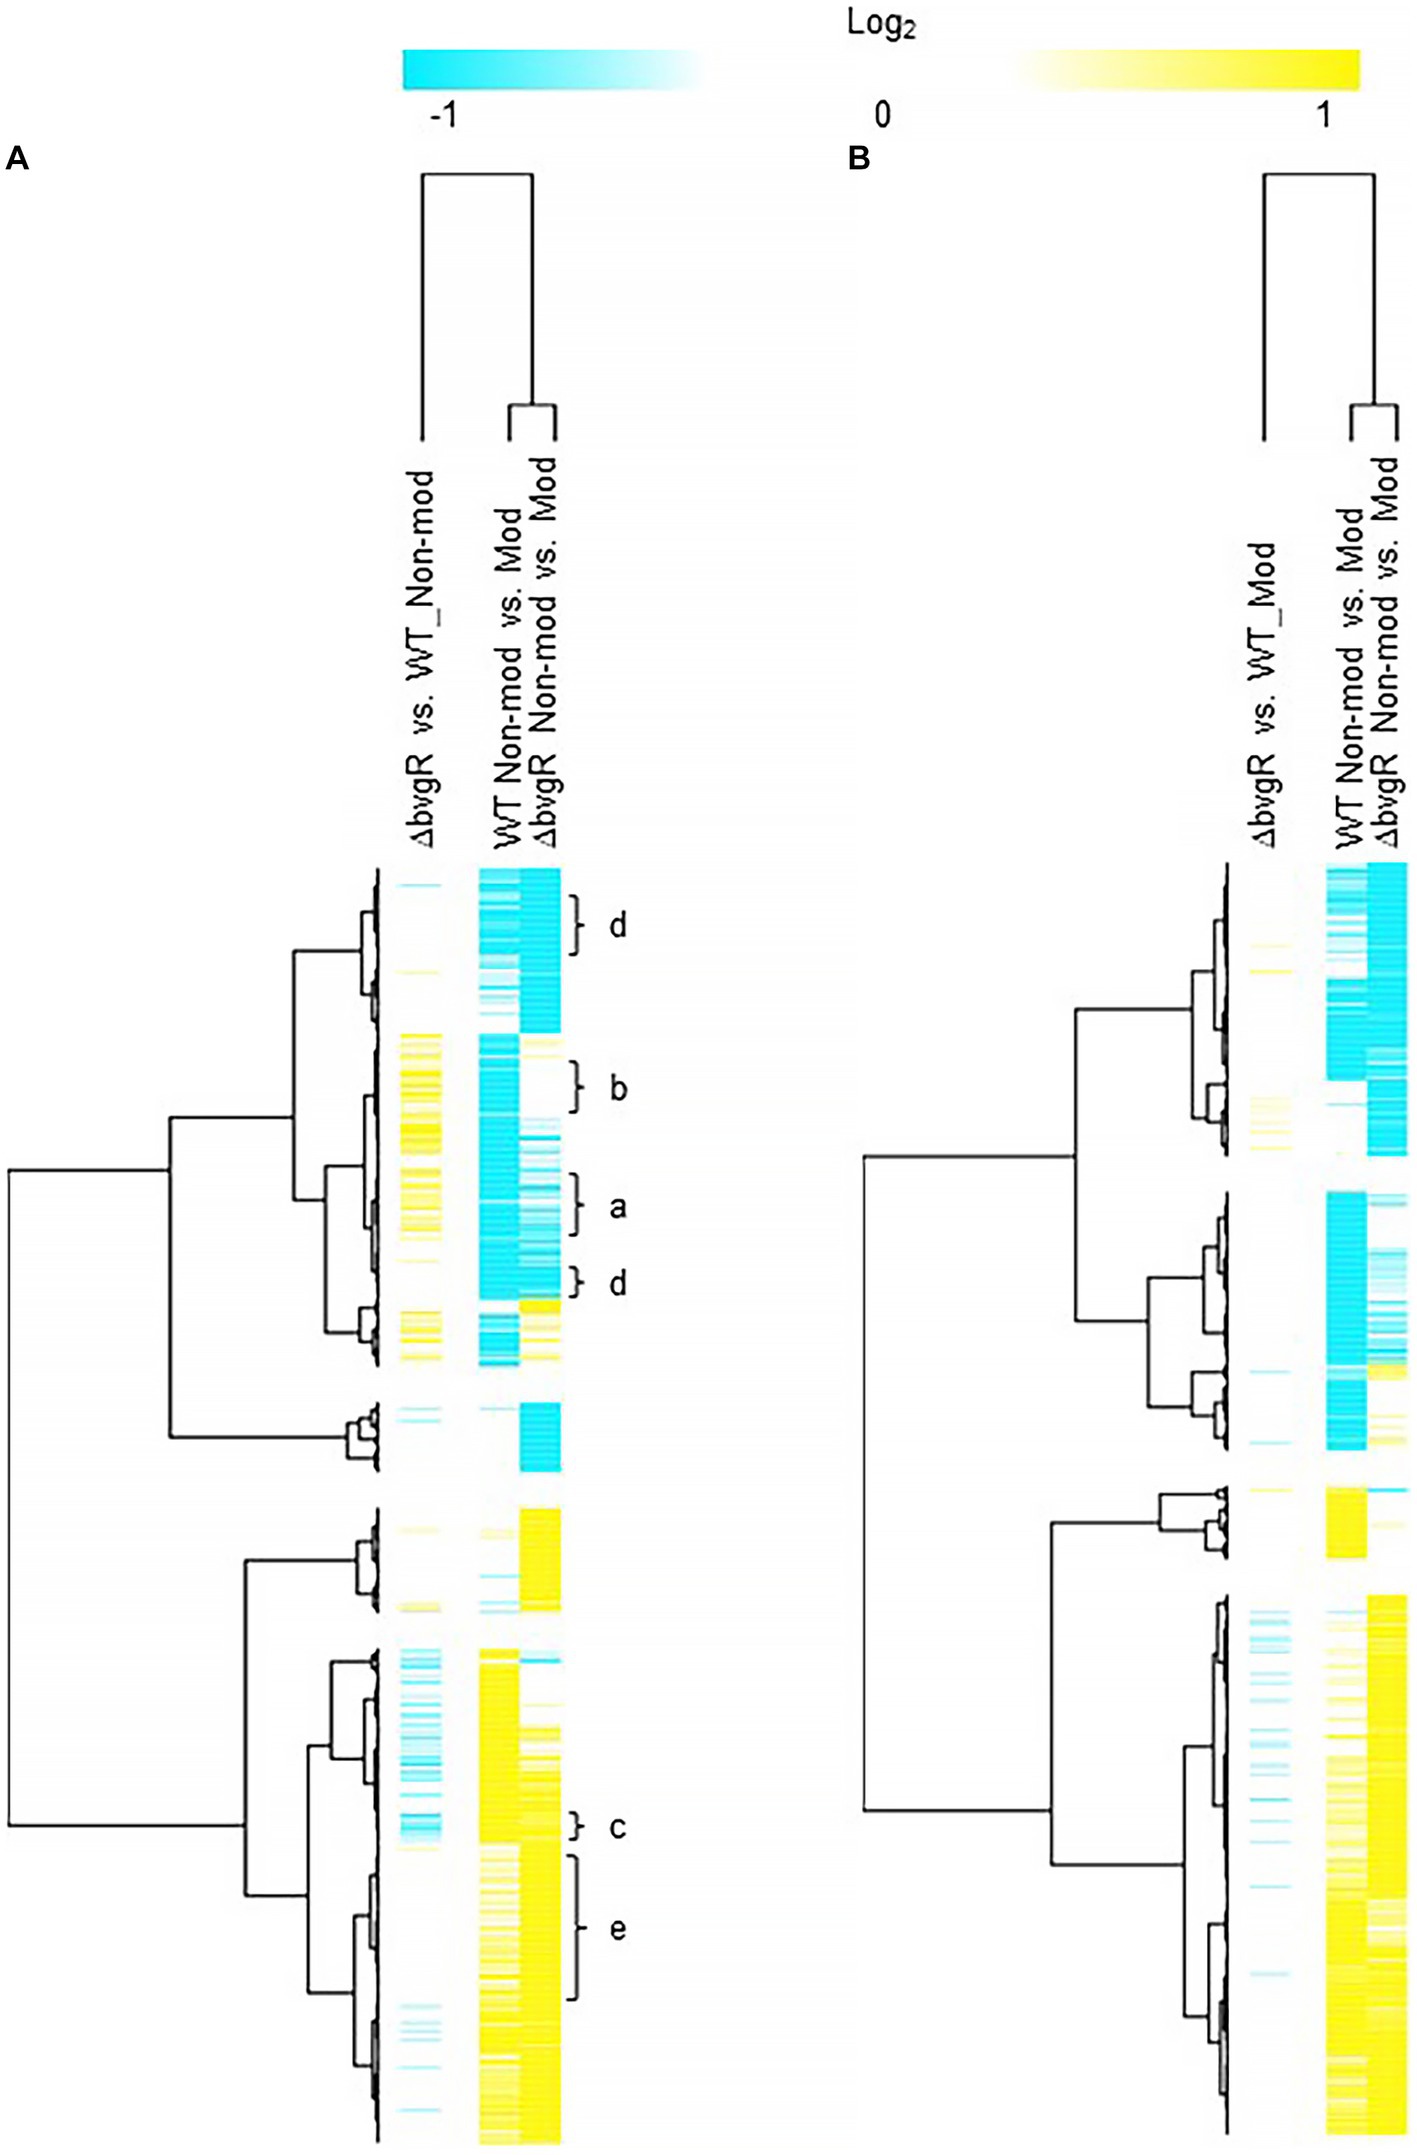
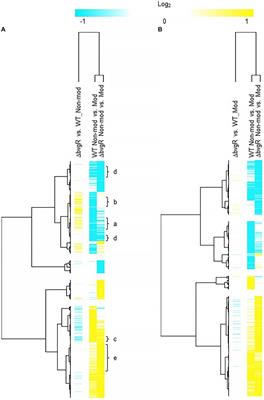
Figure 1. Hierarchical cluster heatmap displaying the transcriptional response of ΔbvgR in non-modulating (Bvg+) conditions and modulating (Bvg-) conditions. (A) Hierarchical cluster heatmap displaying the transcriptional response of ΔbvgR in non-modulating (Bvg+) conditions. (B) Hierarchical cluster heatmap displaying the transcriptional response of ΔbvgR in modulating (Bvg-) conditions. Hierarchical clustering of the expression values was carried out using a distance method metric of 1-Pearson correlation and complete linkage. Clustering was performed on columns and rows. Dendrograms are on the left side and on top of the heat map. Isolates names and specific comparisons are provided at the top of the heat map. All expression profiles of genes are in row and are represented using the color scale at top. Yellow, indicates increased gene expression; blue, decreased gene expression; white, no significant change in gene expression. Letters represent clusters of genes with similar transcription pattern.
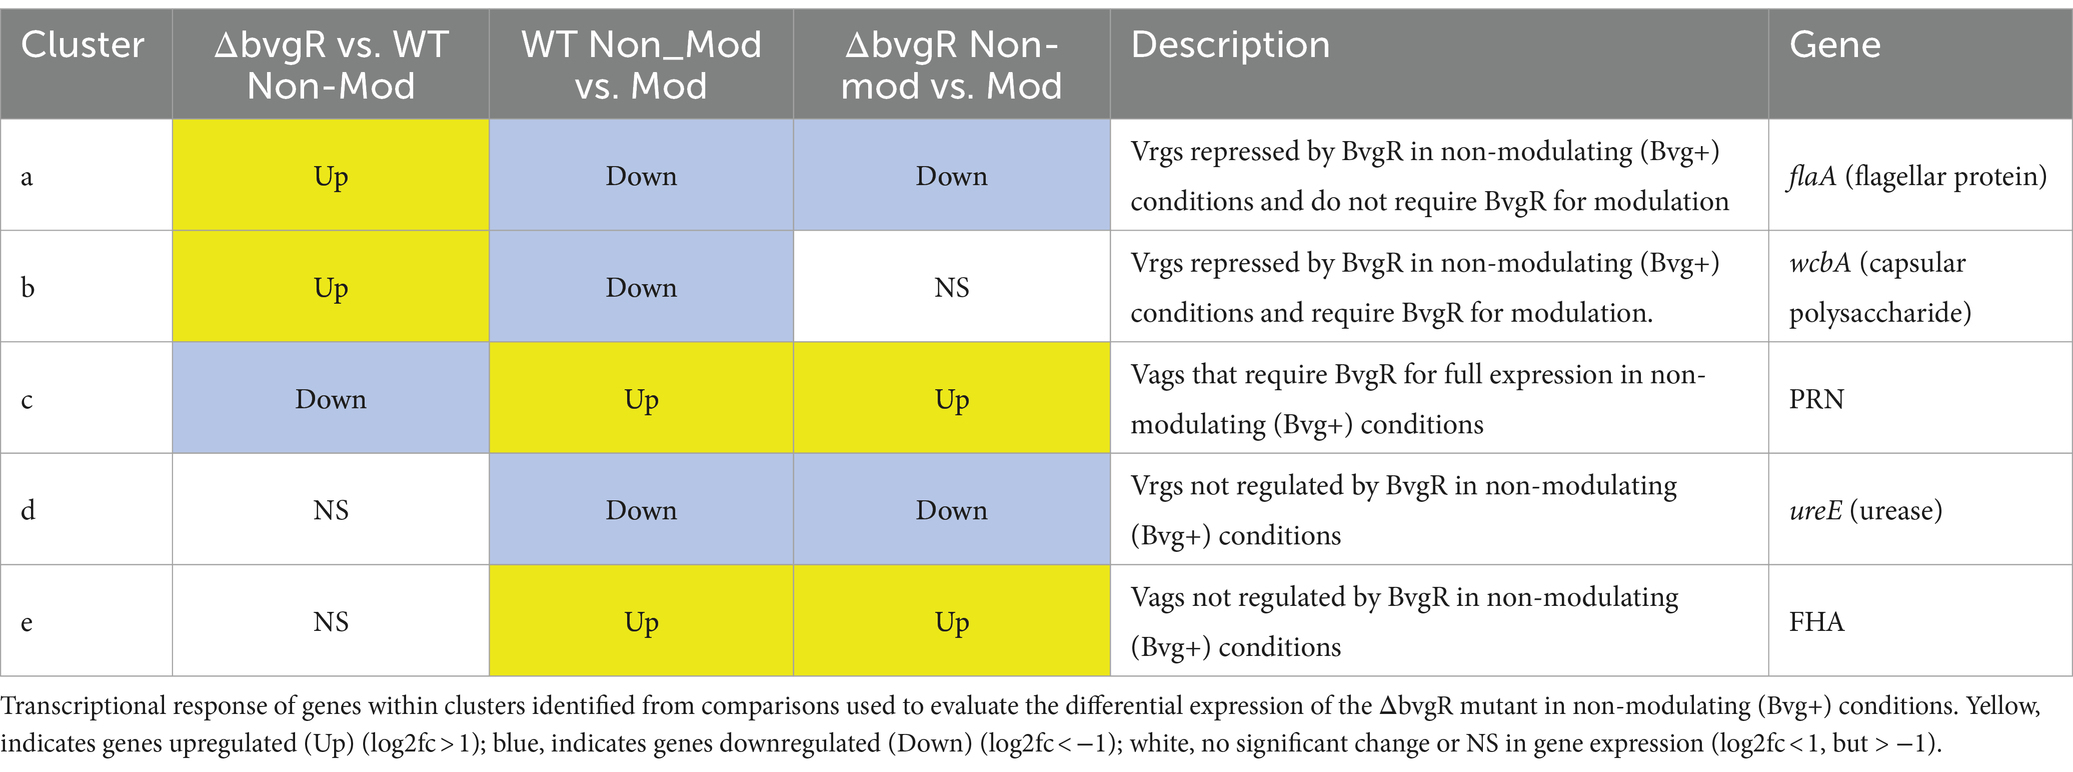
Table 3. ΔbvgR in non-modulating (Bvg+) conditions.
Thirty-four vags were downregulated in ΔbvgR when ΔbvgR was compared to WT in non-modulating (Bvg+) conditions and maintained a classical vag transcriptional response when ΔbvgR grown in non-modulating (Bvg+) conditions was compared to modulating (Bvg-) conditions, i.e., they were upregulated in non-modulating (Bvg+) conditions. Genes that exhibited this transcriptional response include known virulence factors, such as PRN [Figure 1A (cluster c); Table 3; Supplementary Table S1 (cluster c)]. The transcriptional profile of these genes indicated that BvgR is required for full expression in non-modulating (Bvg+) conditions.
Focusing on vrgs, 314 vrgs showed no significant change in gene expression between ΔbvgR and WT in non-modulating (Bvg+) conditions, indicating that these genes were not repressed by BvgR. One hundred and fifty eight of these vrgs were also downregulated in non-modulating (Bvg+) conditions and therefore maintained a classical vrg transcriptional response when ΔbvgR grown in non-modulating (Bvg+) conditions was compared to modulating (Bvg-) conditions. Genes that exhibited this transcriptional response include nutrient transport and metabolism genes, such as ureE [Figure 1A (cluster d); Table 3; Supplementary Table S1 (cluster d)]. The transcriptional profile of these genes indicated that they are not regulated by BvgR in non-modulating (Bvg+) conditions.
A total of 227 vags showed no significant change in gene expression between ΔbvgR and WT in non-modulating (Bvg+) conditions and maintained an expected vag transcriptional response when ΔbvgR grown in non-modulating (Bvg+) conditions was compared to modulating (Bvg-) conditions. Genes that exhibited this transcriptional response include most virulence factors, such as FHA and T3SS genes [Figure 1A (cluster e); Table 3; Supplementary Table S1 (cluster e)]. The transcriptional profile of these genes indicated that they are not regulated by BvgR.
BvgR in modulating (Bvg-) conditionsOnly a few genes were differentially regulated when ΔbvgR was compared to WT in modulating (Bvg-) conditions (Figure 1B; Supplementary Table S2). This result agrees with previous findings demonstrating that BvgR is a vag and functions as a repressor to vrgs during non-modulating (Bvg+) conditions.
RisA and phosphorylation of RisA in non-modulating (Bvg+) conditionsComparison of ΔrisA and ΔrisAS to WT in non-modulating (Bvg+) conditions resulted in 321 genes downregulated in ΔrisA and ΔrisAS compared to WT (Figure 2A; Supplementary Table S3). Of the downregulated genes, 232 were also downregulated in risAD60N compared to WT, indicating that the regulation of these genes is dependent on phosphorylation of RisA. In contrast, 83 genes that were downregulated in ΔrisA and ΔrisAS compared to WT exhibited no significant change in gene expression in risAD60N compared to WT, indicating that regulation of these genes is not dependent on phosphorylation of RisA (Figure 2A; Supplementary Table S3).
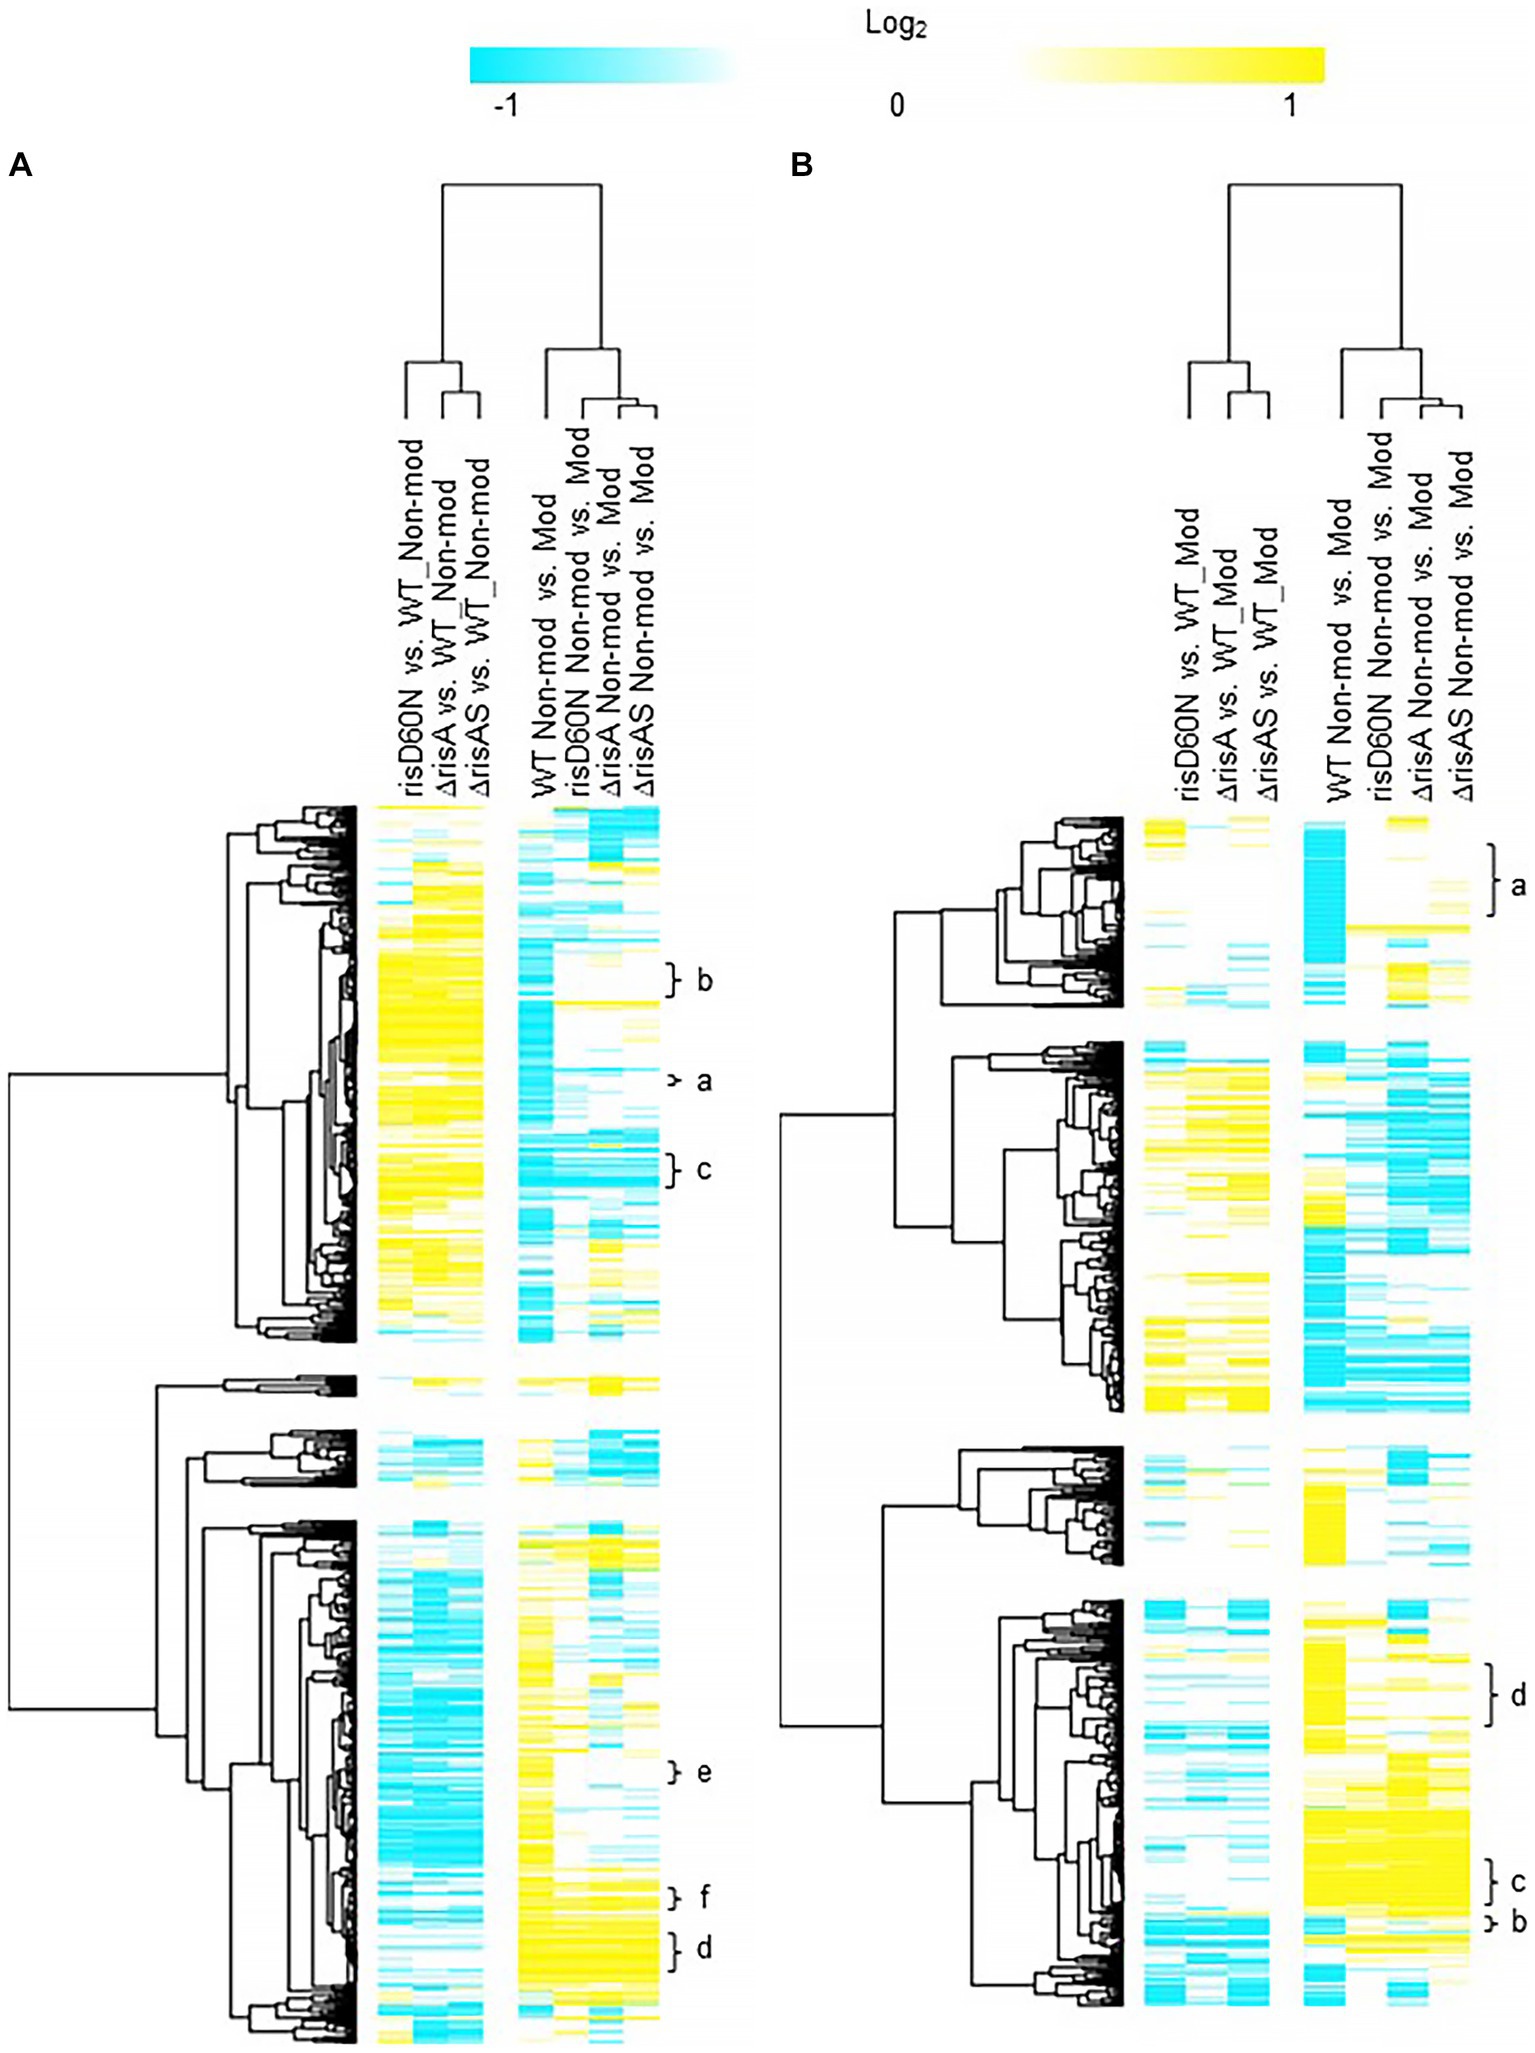
Figure 2. Hierarchical cluster heatmap displaying the transcriptional response of ΔrisA in non-modulating (Bvg+) conditions and modulating (Bvg-) conditions. (A) Hierarchical cluster heatmap displaying the transcriptional response of ΔrisA in non-modulating (Bvg+) conditions. (B) Hierarchical cluster heatmap displaying the transcriptional response of ΔrisA in modulating (Bvg-) conditions. Hierarchical clustering of the expression values was carried out using a distance method metric of 1-Pearson correlation and complete linkage. Clustering was performed on columns and rows. Dendrograms are on the left side and on top of the heat map. Isolates names and specific comparisons are provided at the top of the heat map. All expression profiles of genes are in row and are represented using the color scale at top. Yellow, indicates increased gene expression; blue, decreased gene expression; white, no significant change in gene expression. Letters represent clusters of genes with similar transcription pattern.
A total of 307 genes were upregulated in ΔrisA and in ΔrisAS compared to WT in non-modulating (Bvg+) conditions. Of these, 233 were also upregulated in risAD60N compared to WT, indicating that the regulation of these genes is dependent of phosphorylation of RisA, while 73 genes exhibited no significant change in gene expression in risAD60N and in WT, suggesting that regulation of these genes is not dependent on phosphorylation of RisA (Figure 2A; Supplementary Table S3).
Focusing on vrgs, 67 exhibited no significant change in gene expression in ΔrisA, ΔrisAS, and risAD60N when compared to WT in non-modulating (Bvg+) conditions and lost an expected vrg transcriptional response, i.e., they were not repressed or downregulated in non-modulating (Bvg+) conditions when growth in non-modulating (Bvg+) conditions was compared to modulating (Bvg-) conditions for each of these mutants. Genes that exhibited this transcriptional response include capsule genes and T6SS genes [Figure 2A (cluster a); Table 4; Supplementary Table S3 (cluster 3)]. The transcriptional response of these genes indicated that expression of these genes in non-modulating (Bvg+) conditions is not dependent on RisA, however RisA and phosphorylation of RisA is required for maximal expression in modulating (Bvg-) conditions.
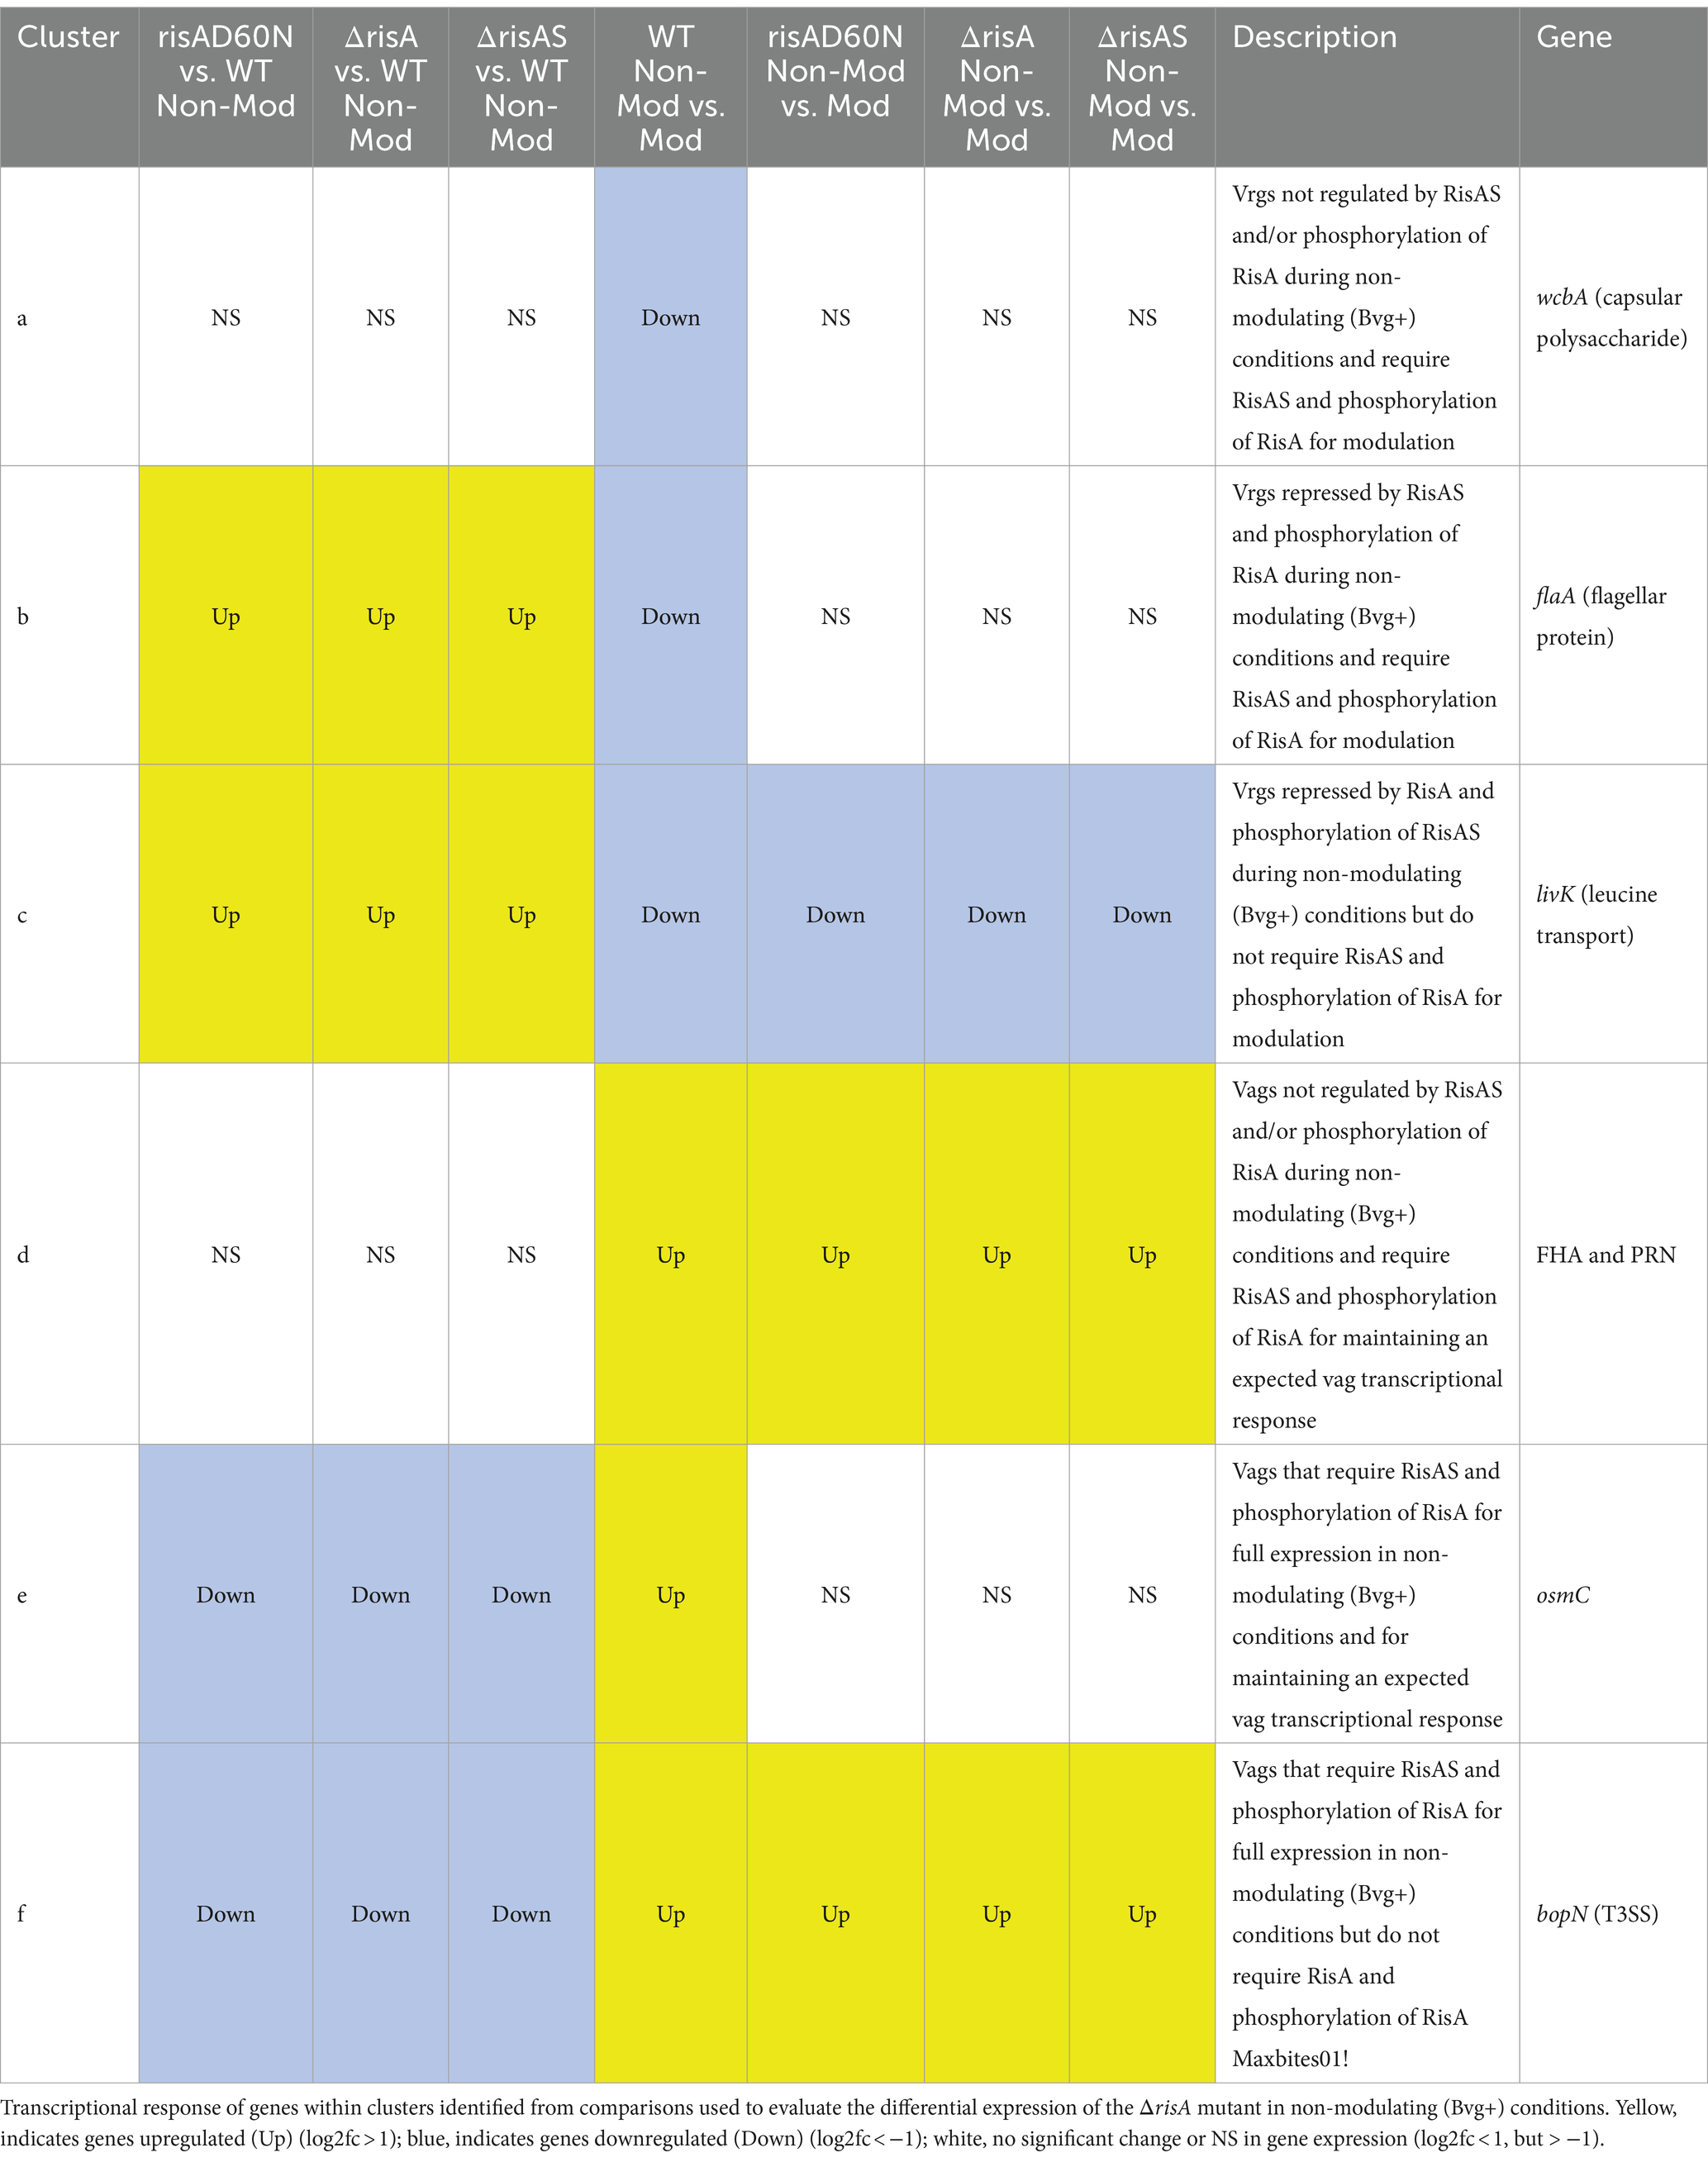
Table 4. ΔrisA in non-modulating (Bvg+) conditions.
A total of 178 vrgs were upregulated in ΔrisA and ΔrisAS compared to WT in non-modulating (Bvg+) conditions. Of these, 162 were upregulated in risAD60N compared to WT, indicating that the regulation of these genes is dependent on phosphorylation of RisA, while 16 genes exhibited no significant change in gene expression in risAD60N and WT, suggesting that regulation of these genes is not dependent on RisA phosphorylation (Figure 2A; Supplementary Table S3). Genes among the 162 vrgs identified as dependent on RisA phosphorylation include chemotaxis/ motility genes and four genes that contain predicted domains related to cyclic di-GMP metabolism domains [locus tags: CJ015_09185 (EAL domain), CJ015_16540 (HD-GYP domain), CJ015_16560 (PilZ, PilZN domain), lapD CJ015_18520 (EAL, GGDEF domain)] (Supplementary Table S3). One hundred and eleven of these vrgs lost an expected vrg transcriptional response, i.e., they were not repressed or downregulated in non-modulating (Bvg+) conditions when growth in non-modulating (Bvg+) conditions was compared to modulating (Bvg-) conditions for each of these mutants [Figure 2A (cluster b); Table 4; Supplementary Table S3 (cluster b)]. The transcriptional response of these genes indicates that they were repressed by RisAS and phosphorylation of RisA during non-modulating (Bvg+) conditions and required RisAS and phosphorylation of RisA for modulation. Genes that exhibited this transcriptional response include flaA and other chemotaxis/ motility genes [Figure 2A (cluster b); Table 4; Supplementary Table S3 (cluster b)]. In contrast, 21 vrgs were downregulated in non-modulating (Bvg+) conditions and therefore maintained a classical vrg transcriptional response when growth in non-modulating (Bvg+) conditions was compared to modulating (Bvg-) conditions for each of these mutants [Figure 2A (cluster c); Table 4; Supplementary Table S3 (cluster c)]. The transcriptional profile of these genes suggests that while they are repressed by RisA and phosphorylation of RisAS during non-modulating (Bvg+) conditions, they do not require RisAS and phosphorylation of RisA for modulation.
Eighty two vags exhibited no significant change in gene expression in ΔrisA, ΔrisAS, and risAD60N compared to WT in non-modulating (Bvg+) conditions and were upregulated in non-modulating (Bvg+) conditions and therefore maintained an expected vag transcriptional response when growth in non-modulating (Bvg+) conditions was compared to modulating (Bvg-) conditions for each of these mutants [Figure 2A (cluster d); Table 4; Supplementary Table S3 (cluster d)]. The transcriptional profile of these genes indicated that they are not regulated by RisAS and/or phosphorylation of RisA during non-modulating (Bvg+) conditions and they do not require RisAS and phosphorylation of RisA for modulation. Genes that exhibited this transcriptional response include virulence factors, such as PRN and FHA [Figure 2A (cluster d); Table 4; Supplementary Table S3 (cluster d)].
Seventy six vags were downregulated in ΔrisA, ΔrisAS, and risAD60N when compared to WT in non-modulating (Bvg+) conditions and lost an expected vag transcriptional response, i.e., they were not upregulated in non-modulating (Bvg+) conditions when growth in non-modulating (Bvg+) conditions was compared to modulating (Bvg-) conditions for each of these mutants [Figure 2A (cluster e); Table 4; Supplementary Table S3 (cluster e)]. Genes that exhibited this transcriptional response include osmC [Figure 2A (cluster e); Table 4; Supplementary Table S3 (cluster e)]. The transcriptional response of these genes indicated that RisAS and phosphorylation of RisA is required for full expression in non-modulating (Bvg+) conditions and for maintaining an expected vag transcriptional response.
Eight vags, including five T3SS genes, were downregulated in ΔrisA, ΔrisAS, and risAD60N compared to WT in non-modulating (Bvg+) conditions and were upregulated in non-modulating (Bvg+) conditions and therefore maintained a classical vag transcriptional response when growth in non-modulating (Bvg+) conditions was compared to modulating (Bvg-) conditions for each of these mutants [Figure 2A (cluster f); Table 4; Supplementary Table S3 (cluster f)]. The transcriptional response of these genes indicated that the expression of these genes is dependent on RisAS and phosphorylation of RisA in non-modulating (Bvg+) conditions, however, they do not require RisA and phosphorylation of RisA for maintaining an expected vag transcriptional response.
RisA and phosphorylation of RisA in modulating (Bvg-) conditionsWhen ΔrisA and ΔrisAS was compared to WT in modulating (Bvg-) conditions, 75 genes were downregulated in ΔrisA and ΔrisAS. Of these, 53 were also downregulated in risAD60N compared to WT, indicating that the regulation of these genes is dependent on RisA phosphorylation, while 22 genes were equally expressed in risAD60N and in WT, indicating that regulation of these genes is not dependent on RisA phosphorylation (Figure 2B; Supplementary Table S4). A total of 102 genes were upregulated in ΔrisA and in ΔrisAS compared to WT in modulating (Bvg-) conditions. Of these, 47 were upregulated in risAD60N compared to WT, indicating that the regulation of these genes is dependent on RisA phosphorylation, while 55 genes were equally expressed in risAD60N and in WT, suggesting that regulation of these genes is not dependent on RisA phosphorylation (Figure 2B; Supplementary Table S4).
Focusing on vrgs, 174 exhibited no significant change in gene expression in ΔrisA, ΔrisAS, and risAD60N compared to WT in modulating (Bvg-) conditions and lost a vrg transcriptional response, i.e., they were not repressed or downregulated in non-modulating (Bvg+) conditions when growth in non-modulating (Bvg+) conditions was compared to modulating (Bvg-) conditions for each of these mutants [Figure 2B (cluster a); Table 5; Supplementary T
留言 (0)