
記住我
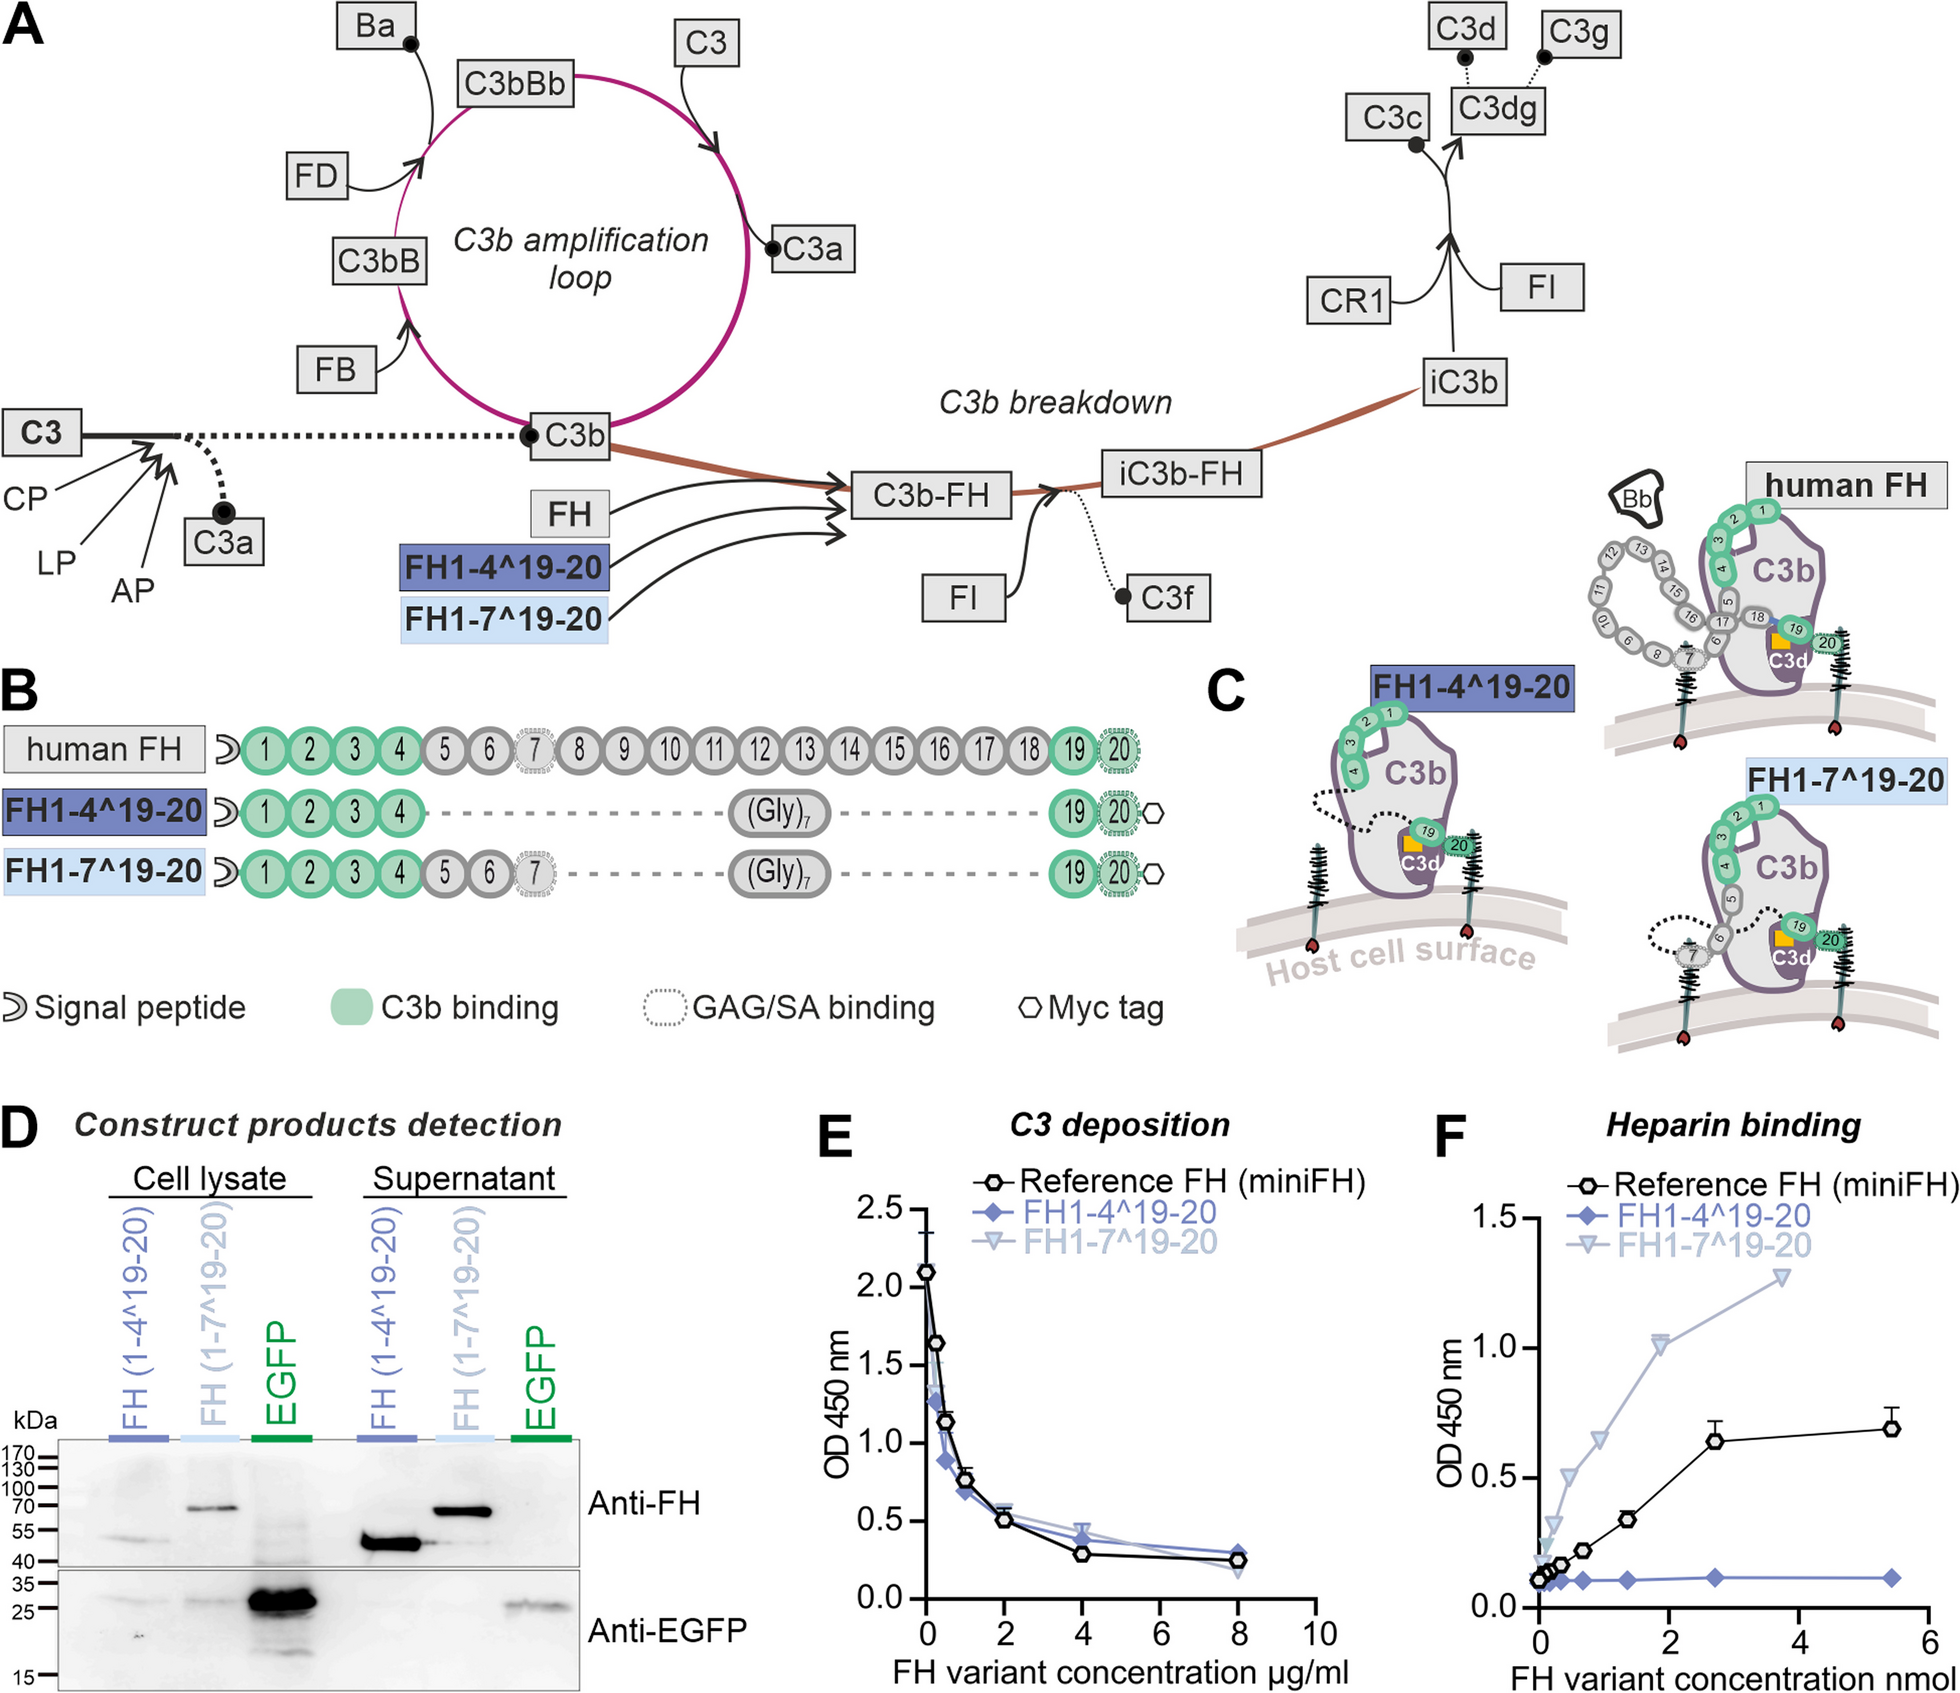


We modified the miniFH regulator, originally developed by Schmidt et al., for expression in mice [57]. This involved codon optimization and the addition of both a signal peptide and an epitope (myc) tag. MiniFH is derived from FH CCP1-4 and 19-20 domains of human FH (Fig. 1B). Replacement of the 14 middle domains with a polyglycine linker provided structural advantages but eliminated some functions, notably the GAG recognition of CCP6-7 domains. The importance of the CCP7 domain, which contains the Y402 locus, was underscored by its recent identification as critical for the antiangiogenic functions of FH in a choroidal neovascularization model [6]. Therefore, we introduced a second construct that combined the benefits of domain removal with the preservation of domains critical for tissue maintenance in AMD. Both truncated FH versions were within the loading capacity of an AAV. FH1-4^19-20 and FH1-7^19-20 were designed to exert important regulatory functions: CCP1-4 domains facilitated C3b binding and cofactor activity, whereas CCP6-7 and 19-20 domains ensured polyanion binding (Fig. 1B). The hypothesis was that these truncated FH variants mimic the regulatory functions of native FH by maintaining host cell recognition and competition for complement factor B (FB/Bb) binding sites on C3b (CCP1-4) (Fig. 1C).
Both variants were expressed using a mammalian expression system for the in vitro studies. FH1-4^19-20 and FH1-7^19-20 proteins were detected in cell lysates and supernatant of transfected HEK293 cells by Western blot and had the predicted sizes of 44 and 68 kDa, respectively (Fig. 1D). The control reporter protein, enhanced green fluorescent protein (EGFP) without signal peptide for secretion, was found mainly in cell lysates. This observation confirmed that the truncated FH proteins were actively secreted and not released by cell disruption (Fig. 1D, Additional file 1: Fig. S1). Evaluation of protein levels of the expressed truncated FH proteins compared with EGFP revealed that bicistronic mRNAs carrying the FH proteins and the EGFP reporter signal exhibited reduced expression under internal ribosome entry site (IRES) translational control than the single cistron in the EGFP control vector (Figs. 1D, 2B).
Fig. 2
Effectiveness of the expression cassette with regard to coupling to GFAP transcription and Müller cell specificity in vivo. A Experimental set up for in vivo studies: eyes of C57BL/6 J wildtype mice were exposed to hypoxic conditions by elevated intraocular pressure (IOP), resulting in ischemic tissue responses. Subsequently, AAV vectors carrying expression cassettes for regulatory truncated FH variants and an EGFP-only control were injected. Tissue samples were collected for evaluation at intervals of 3 and 14 days post injections (dpi). B Scheme delineating the viral constructs used in the present study. C Cryosections of the central retina showed that EGFP was present in Müller cells identifiable by their unique morphology spanning the whole tissue from the ganglion cell layer (GCL) to the outer border of the outer nuclear layer (ONL). This indicated a cell type-specific expression of the AAV construct mainly in Müller cells. D Immunohistochemistry (IHC) analysis of peripheral retinal flat mounts at 14 dpi at the level of the nerve fiber layer after ischemic injury and AAV application was performed to assess whether also astrocytes, that even in the healthy retina express high levels of GFAP, were transduced by the AAV. EGFP-positive cells co-expressed the Müller cell marker glutamine synthetase (Glul), but not high levels of GFAP. In contrast, highly GFAP-positive astrocytes were not highlighted by EGFP-labeling (also see Additional file 1: Fig. S2). E Quantitative real-time PCR of isolated Müller cells showed a decrease in Glul expression in ischemic Müller cells at 3 dpi (left panel). This reduction is attenuated by 14 dpi. In contrast, Gfap expression increased by 3 dpi and remained elevated until 14 dpi (right panel). Each data point per biological replicate (n = 3–4) is represented by a dot in the graph. F EGFP expression levels showed correlation to Gfap expression in all three treatment groups as determined by qPCR (14 dpi). Pearson’s correlation coefficients of Gfap (-)dCT vs EGFP (-)dCT were as follows: ρ(AAV_EGFP) = 0.8561, ρ(AAV_FH1-4^19-20) = 0.8561 and ρ(AAV_FH1-7^19-20) = 0.8534. Each data point per biological replicate (n = 3–4) is represented by a dot in the graph. G Representative microscopic images showing GFAP immunostaining on sections at 14 dpi (left panel). Quantitative analysis of mean fluorescence intensity encompassing the retina from the outer limiting membrane to the inner plexiform layer (right panel). The ganglion and nerve fiber layers were excluded from the analysis to eliminate signals from astrocytic GFAP expression. Each data point per biological replicate (n = 3–4) is represented by a dot in the graph
Previously, miniFH variants were reported to effectively inhibit human C3b deposition on cell surfaces, suggesting that they modulate the complement pathway [57]. Our matched FH1-4^19-20 and FH1-7^19-20 variants mirrored the dose-dependent ability of the reference miniFH to prevent complement accumulation in mice, as evidenced by the reduction of C3b deposition by mouse serum on a lipopolysaccharide-coated surface (Fig. 1E).
CCP7, which was previously found to bind GAGs [9], led to the expectation that FH1-7^19-20 would have an enhanced ability to recognize cell surfaces through GAG binding. This assumption was confirmed indirectly by a heparin-binding ELISA (Fig. 1F), in which FH1-7^19-20 showed the highest binding strength for heparin among all FH variants. In contrast, FH1-4^19-20 did not show any detectable interactions in this context (Fig. 1F). Because the structure of this protein is identical to that of the reference miniFH, with the exception of an epitope tag at the C-terminus, this lack of interaction was likely due to an obstruction in the CCP20 GAG-binding domain.
Expression system is Müller cell-specific and GFAP dependentAfter demonstrating that the recombinant FH variants retained most of the full-length functions of FH, with the exception of GAG binding of FH1-4^19-20 (Fig. 1), we tested the influence of the constructs in vivo using the acute ischemia/reperfusion retinal mouse model [49] (Fig. 2A). Note that the goal of our study was to focus on two distinct phases of retinal ischemia/reperfusion: the acute phase of maximal inflammation, possibly involving complement activation, at 3 days post injury (dpi), and a later phase at 14 dpi, characterized by tissue remodeling and restoration of tissue homeostasis after the initial injury [1, 36, 48, 49].
To protect retinal neurons from transgene expression and focus the response on the risk of impending retinal degeneration, we targeted the expression of the secreted factors to Müller cells. This was achieved by generating AAVs with the ShH10-capsid with reported tropism for Müller cells [31]. In addition, we aimed to link peak transgene expression to Müller cell gliosis by including an optimized version of the human glial fibrillary acidic protein (GFAP) promoter into the expression cassette (Fig. 2B). After ischemia induction, AAVs were injected intravitreally to access Müller cell end feed adjacent to the vitreous, which form the inner blood retinal barrier (Fig. 2A). It should be noted that astrocytes are also located in the nerve fiber layer and could potentially be easily transduced by AAVs injected intravitreally as well. Analysis of the pattern of EGFP expression in retinal sections (Fig. 2C) and flat mounts (Fig. 2D, Additional file 1: Fig. S2) confirmed: (i) widespread transgene expression throughout the retina from the central areas to the far periphery (Additional file 1: Fig. S2A), (ii) substantial transgene expression as early as 3 days after ischemia and AAV delivery (dpi) (Additional file 1: Fig. S2), (iii) GFAP expression in astrocytes, but also in Müller cells, even in control eyes, possibly due to the tissue stress caused by intravitreal delivery of AAV (Additional file 1: Fig. S2B), (iv) an EGFP expression pattern mainly restricted to glutamine synthetase (GLUL)-positive Müller cells, with few GFAP-positive astrocytes showing low levels of EGFP in control eyes, but a large number of transgene-positive Müller cells and many EGFP-positive astrocytes in the post-ischemic retina, and finally, (v) that the AAV constructs for both truncated FH variants resulted in detectable EGFP expression at 14 dpi (Fig. 2D).
For molecular validation of those findings, retinal samples were collected 3- and 14-days post-ischemia (dpi), and retinal cell types were separated by magnetic-activated cell sorting (MACS). Successful enrichment of each cell population was demonstrated analyzing the mRNA expression of known marker genes (Additional file 1: Fig. S3). The rise in Gfap transcript levels in control eyes, matching our immunolabeling results, suggests a temporary gliotic response from intravitreal AAV injection. This is consistent with reports from others demonstrating a temporarily confined gliotic response of both Müller cells and microglia in mouse eyes to intravitreal injections [59, 60]. We analyzed the effects of AAVs carrying the truncated FH variants on ischemia/reperfusion hallmarks in purified Müller cells by qPCR. A previously reported decrease in Glul levels after ischemia/reperfusion was reproduced in the present study (Fig. 2E). However, we observed no detectable treatment effect of AAVs on this Müller cell marker (Fig. 2E) [44, 65].
As a marker of Müller cell gliosis, Gfap levels increased at 3 dpi and decreased 14 days after injection of AAV_EGFP-control vector (Fig. 2E). After injection of AAV_FH1-4^19-20 or AAV_FH1-7^19-20, there were no significant shifts in Gfap expression between 3 and 14 dpi. However, a slight trend suggestive of reduced Gfap-upregulation at 3 dpi was observed in Müller cells from ischemic retinas treated with FH variants compared to those treated with EGFP alone, an effect that diminished at 14 dpi (Fig. 2E). This could be a hint of reduced gliosis and might indicate that the treatment is effective in mitigating the cellular response to the injury.
Furthermore, analysis of EGFP and Gfap transcript levels at 14 dpi revealed a significant relationship between Gfap dCT and EGFP dCT values of AAV_EGFP, AAV_FH1-4^19-20 and AAV_FH1-7^19-20 (Fig. 2F). This suggests that expression of the transgenes is indeed coupled to that of Gfap. Finally, GFAP concentrations determined from immunostainings intensity scores did not differ significantly between treatments or time points (Fig. 2G).
Positive staining of microglia in ischemic retinas after treatment with AAV_FHsIn the early phase of the observation period, specifically at 3 dpi, FH variant transcripts were detectable only in trace amounts in the Müller cell fraction of both ischemic and control eyes (Fig. 3A). However, after 14 dpi, mRNA levels of FH variants were increased in Müller cells, indicating not only robust expression but also interanimal variability (Fig. 3A).
Fig. 3
Expression of native and transgenic FH variants at transcript and protein levels. A Left, at 3 dpi, mRNA expression levels of regulatory CFH variants were already detectable in the Müller cell fraction, but at low levels. Right, after 14 days, a stronger expression of both FH1-4^19-20 and FH1-7^19-20 mRNA variants was observed in purified Müller cells. Bars represent the mean ± SEM of n = 3–4 biological replicates. Each data point is represented by a dot in the graph. Unpaired t-test: *P < 0.05. B IHC results from cryosections of control and post-ischemic retinas after AAV treatment delineating FH deposition and the localization of microglia/macrophages by a labeling for IBA1 at 3 and 14 dpi. FH, factor H. Scale bar, 50 µm
Following the ischemic injury, there was pronounced activation of microglia that spread through the whole retina (Fig. 3B). Interestingly, immunoreactivity with an antibody against FH was observed in retinas treated with AAV_FH1-4^19-20 and AAV_FH1-7^19-20 (Fig. 3B). It is important to note that although this antibody can also identify mouse FH, no microglia-specific staining was seen in eyes injected with the AAV_EGFP control. The microglia-specific FH signal was also evident at 14 dpi. Of note, blood vessels were also stained, likely due to nonspecific binding of the secondary antibody to endogenous mouse IgG, a phenomenon also observed in control staining with secondary antibody (Additional file 1: Fig. S4).
FH variants attenuate tissue damage in retinal ischemia/reperfusion modelThree days after ischemic injury, TUNEL staining revealed apoptosis and/or necrosis in approximately 13% of cells in the ganglion cell layer (GCL), 16% of cells in the inner nuclear layer (INL), and 11% in the outer nuclear layer (ONL) of AAV_EGFP injected eyes (Fig. 4A, B). At 14 dpi, these numbers decreased to less than 5% for the GCL and less than 1% of cells were TUNEL-positive in the INL or ONL. Despite a trend toward overall lower numbers of TUNEL-positive cells, the AAV_FH1-4^19-20 and AAV_FH1-7^19-20 treatments did not show a statistically significant effect in this analysis (Fig. 4B).
Fig. 4
Characterization of neuronal survival in the ischemia/reperfusion model following treatment with AAV_EGFP, AAV_FH1-4^19-20 and AAV_FH1-7^19-20 (n = 3–6). A Cryosections from the central retina revealed TUNEL-positive apoptotic/necrotic cells (left panel) and calretinine-positive amacrine and ganglion cells (right panel) in both non-ischemic control and ischemic eyes treated with AAVs. B Quantitative analysis of the percentage of TUNEL-positive cells in each retinal layer and treatment at 3 and 14 dpi. C Evaluation of the outer plexiform layer (OPL) and the inner plexiform layer (IPL) thickness to assess the integrity of the synaptic connections representing neuronal processes. Values were normalized to non-ischemic control eyes of the corresponding animals. D. Quantification of nuclei within the ganglion cell layer (GCL), the inner nuclear layer (INL) and the outer nuclear layer (ONL) per scan field. Data were normalized to non-ischemic control eyes of the corresponding animals. E To examine cell-specific neuronal loss in more detail, particularly given the susceptibility of inner retinal neurons to ischemia/reperfusion, we quantified calretinin-positive cells. Calretinin labels ganglion cells as well as displaced amacrine cells in the GCL and amacrine cells in the INL. B–E Each data point per biological replicate (n = 3–4) is represented by a dot in the graph. Unpaired t-test: *P < 0.05. C–E Dashed lines indicate the level of each parameter in the non-ischemic control eye.
Consistent with the TUNEL data, the ischemic episode resulted in severe disruption of the retinal architecture and substantial loss of cell nuclei in all nuclear layers in eyes receiving the AAV_EGFP control construct: approximately 54% in the GCL, 44% in the INL and 19% in the ONL, respectively (Fig. 4A, D). This degeneration appeared to progress after 3 dpi, as evidenced by even greater losses at 14 dpi especially in the ONL (Fig. 4D). In line with this, also the outer (OPL) and inner (IPL) plexiform layer thickness was significantly reduced at 14 dpi (Fig. 4C).
Although all morphometric parameters tested are closer to 1 (i.e., equal to the values in the non-ischemic control eye), the therapeutic benefits of AAV_FH1-4^19-20 and AAV_FH1-7^19-20 did not reach statistical significance compared to ischemic eyes treated with AAV_EGFP (Fig. 4C, D). It is important to note, however, that there was no significant progression of structural damage in the post-ischemic retinas treated with either of the FH variants, as was observed in the plexiform layers of the AAV_EGFP-treated controls (Fig. 4C). Consistent with these findings, the AAV_FH1-7^19-20 injected retinas not only exhibited significant improvement in neuronal survival in the INL, as evidenced by a 1.8-fold increase in nuclei count compared to the AAV_EGFP group at 14 dpi (Fig. 4D), but also demonstrated enhanced IPL thickness (Fig. 4C). Animals treated with AAV_FH1-4^19-20 also showed similar positive trends, though these were not statistically significant.
Previous studies have shown that amacrine and ganglion cells are particularly vulnerable to retinal ischemia [32]. In our study, we found a clear stratification into three distinct layers of calretinin-positive dendrites in the IPL, with calretinin-positive amacrine cell bodies being located in the INL and those of ganglion cells in the GCL (Fig. 4A, E). After 3 dpi, ischemia resulted in a loss of approximately 60% of ganglion and amacrine cells. The calretinin-positive cells of the AAV_FH-treated retinas showed higher, but not yet significantly improved, cell survival rates. However, it was observed that the treatments with both FH variants contributed to enhanced structural integrity of calretinin-positive dendrites in the IPL, maintaining the three characteristic layers (Fig. 4A), aligning with our earlier findings about the plexiform layer’s sensitivity to our treatment approach (Fig. 4C).
In summary, the morphometric data indicate that both FH variants may effectively mitigate or prevent secondary cell death. This reduction is likely attributable to the dampening of excessive inflammatory responses, which are partly driven by complement activation following the initial extensive cell loss from direct ischemic injury.
AAV_FH treatments modulate the pre- and post-ischemic complement transcriptomeComparison of control eyes treated with AAV_EGFP, AAV_FH1-4^19-20 and AAV_FH1-7^19-20 with their ischemic counterparts revealed marked differences in complement expression. These differences reflect the distinct ischemia-associated immunological phenotype previously described [49]. Increased C3 mRNA levels were observed in purified Müller cells of all ischemic treatment groups at 14 dpi and to some extent in the neuronal fraction at 3 dpi compared with their non-ischemic counterparts (Fig. 5A, Additional file 1: Table S3). The complement activating factors Cfd and Cfb showed increased expression in ischemic eyes in all treatment groups, although differences manifested in different cell fractions and time points (Fig. 5B, Additional file 1: Tables S1, S2). Of note, innate murine Cfh was consistently downregulated in Müller cells and neurons after ischemia, regardless of whether the animals received AAV_FH-treatment. In contrast, Cfi increased specifically in neurons at 3 dpi (Fig. 5C, Additional file 1: Table S3). Following ischemia, stabilizer of the alternative pathway C3 convertase Cfp was downregulated in Müller cells but upregulated in microglia as observed before (Fig. 5D, Additional file 1: Table S3) [49].
Fig. 5
Cell type-specific analysis of complement component expression in the murine retina 3 and 14 dpi. qPCR data are presented as negative delta Ct values, i.e. that high numbers represent higher transcript levels on a logarithmic scale. Neuronal, microglia and Müller cell fractions were analyzed for transcripts of (A) the central component C3, (B) complement components involved in activation Cfd and Cfb or (C) inhibition of the complement cascade Cfh and Cfi and (D) Cfp that is involved in the amplification of C3 cleavage. Each data point per biological replicate (equals the number of mice studied: n = 2–5) is represented by a dot in the graph. Unpaired t-test: *P < 0.05; **P < 0.01. (All statistical analyses are available in Additional file 1: Tables S1, S2, and S3.)
To identify the specific effects of AAV_FH gene addition therapy, we compared the expression levels of complement components in Müller cells, microglia and neurons from ischemic eyes with those receiving the AAV_EGFP control virus (Additional file 1: Tables S1, S2).
When examining the effects of the AAV_FH1-7^19-20 variant treatment, we observed notable differences in complement expression compared to the AAV_EGFP control group. Even when comparing within control eyes, these differences were apparent (Fig. 5A–C). These effects leaned towards complement downregulation, with lower transcript levels of complement activators (Fig. 5B) and higher levels of inhibitors (Fig. 5C). For instance, activators Cfb and Cfd were less expressed in neurons (Fig. 5B) and more Cfh transcripts were found in microglia (Fig. 5C). On the other hand, Müller cells of control eyes expressed higher levels of the central complement component C3 after treatment with AAV_FH1-7^19-20 (Fig. 5A). This was interesting, since C3 was downregulated three days after ischemia in microglia and neurons with AAV_FH1-7^19-20 treatment (Fig. 5A).
Post-ischemic neurons from retinas treated with AAV_FH1-7^19-20 showed less Cfh transcripts 3 dpi (Fig. 5C), which flipped to an upregulation 14 dpi. Similar to Cfh, the C3b protease Cfi was also downregulated 3 days after ischemia when treated with AAV_FH1-7^19-20. For AAV_FH1-4^19-20 treatment an upregulation of Cfi in Müller cells 14 days after ischemia was observed (Fig. 5C).
Transcript levels of the terminal pathway components C9 and C5 were also assessed. However, as demonstrated recently [49] these transcripts were mostly out of assay range and no valid comparison could be made (data not shown).
Post-ischemic retinas treated with AAV_FH constructs showed less C3 turnover and complement activationFH exerts a dual regulatory effect on the central complement factor C3, as shown in Figs. 1 and 6A. First, it accelerates the decay of the C3-convertase, leading to the displacement of FB/Bb and arresting the cleavage of C3 cleavage into C3b. Second, FH serves as a cofactor for FI and facilitates the conversion of C3b into its inactive cleavage fragments: iC3b, C3dg, and C3d (Figs. 1A, 6A). After ischemia/reperfusion, a change in the C3 cleavage pattern was observed compared with control retinas at 3 dpi (Fig. 6B, Additional file 1: Fig. S5, S6) but not at 14 dpi (Additional file 1: Fig. S7). This pattern after 3 dpi was modulated by gene addition therapy with the truncated FH variants AAV_FH1-4^19-20 and AAV_FH1-7^19-20 (Fig. 6B–H). Ischemic retinas had lower levels of intact, uncleaved C3ɑ chain compared with control retinas (Fig. 6C), suggesting that consumption of full-length C3ɑ chain is related to complement activation. Nevertheless, the level of activated C3b remained comparable in ischemic and non-ischemic samples (Fig. 6D, E). The increased ratio of C3b to C3 was a characteristic feature of ischemic retinas compared to untreated retinas (Fig. 6E). This was highlighted by a markedly increased amount of C3b/C3 fragments in AAV_EGFP-treated ischemic retinas compared with AAV_EGFP-treated control retinas, indicating complement activation in the ischemic retinas. In contrast, C3b/C3 levels in AAV_FH treated eyes of ischemic retinas were more similar to those of control retinas (Fig. 6E). These observations suggest that complement activation in the ischemic retinas was attenuated by increased FH-based regulatory activity introduced by the truncated FH variants AAV_FH1-4^19-20 and AAV_FH1-7^19-20, e.g. promoting the degradation and elimination of C3b fragments (Fig. 6F–H).
Fig. 6
Quantitative analysis revealed that truncated FH variants modulate C3 fragmentation in the ischemic retina. A Schematic representation of C3 cleavage. Numerical data indicate peptide sizes in kilodalton (kDa). The binding sites for complement receptors 1 and 2 (CR1 / CR2), FH, MCP and factor B (FB) are highlighted. C3 convertase cleaves C3 into C3b and C3a. With MCP, CR1 and FH as cofactors cleaves FI C3b into iC3b and C3f. Subsequent cleavage of iC3b by FI leads to C3c and C3dg, the latter being further converted to C3d. Modeled after [34]. B Representative Western blot of AAV treated retinas containing 70 µg total protein. Detection was performed by using a polyclonal antibody specific for C3d. (C3α + x corresponds to C3 α-chain covalently attached to glycoproteins via thioester group.) Original documentation of the blot is shown in Additional file 1: Fig. S5. C–H Quantitative analysis of Western blot band intensities normalized to total protein loading. Boxplots represent median, quartiles and mean (indicated by a dot) without outliers. The mean of each data set was compared with the AAV_EGFP ischemia data using Dunnett’s test for multiple comparisons. A significance level is indicated by *P < 0.05. Each data point per biological replicate (n = 3–4) is represented by a dot in the graph. Uncropped blots are summarized in Additional file 1: Fig. S6. I Immunolabeling with an antibody against C3d (labeling C3, C3b, iC3b, C3dg and C3d) showed co-staining with the Müller cell marker glutamine synthetase (GLUL) in the GCL of the ischemic retina. Application of AAV_FH1-4^19-20 reduced C3 intensity at 3 dpi compared with AAV_EGFP, whereas treatment with AAV_FH1-7^19-20 resulted in a reduction after 14 dpi. Each data point per biological replicate is represented by a dot in the graph. Unpaired t-test: *P < 0.05; **P < 0.01; ***P < 0.001
The peak concentration of iC3b, C3d and C3d was detected in the ischemic retinas treated with the AAV_EGFP control vector (Fig. 6F–H). In contrast, ischemic retinas treated with vectors expressing FH1-4^19-20 and FH1-7^19-20 had iC3b, C3dg, and C3d levels lower than in the ischemic AAV_EGFP control vector treated retinas. These results emphasize that both the decay acceleration function and the cofactor activity of the truncated FH derivates were functional in this model of retinal degeneration.
Immunolabeling of C3 showed co-localization with the Müller cell marker glutamine synthetase within the GCL. Quantitative intensity assessments showed that ischemic eyes had up to 20-fold higher levels than in their non-ischemic counterparts. Remarkably, treatment with AAV_FH1-4^19-20 showed the most marked reduction at 3 dpi, with intensity scores approximately four times lower than AAV_EGFP controls (Fig. 6I). Compared with intensity values at 3 dpi, the AAV_FH1-4^19-20 treatment showed an increase by day 14 dpi. Conversely, a decrease was observed in the AAV_FH1-7^19-20 treatment group during the same period.
Microglial/macrophage reactivity decreased after AAV_FH supplementationThe expression of allograft inflammatory factor 1 (Aif1 transcript) also known as ionized calcium-binding adapter molecule 1 (IBA1 protein) in immunoreactive microglia/macrophages increased sharply and peaks approximately 3 days after ischemic injury before decreasing after 7 days [26]. Our study showed that at 14 dpi, the mRNA levels of Aif1 were significantly lower in AAV_FH1-4^19-20 treated animals compared with the AAV_EGFP control (Fig. 7A).
Fig. 7
Microglia response to AAV_FH treatments following ischemia. A The expression of Aif1 mRNA (also known as IBA1) in control and ischemic retinas after AAV treatment was determined by qPCR. At 14 dpi, Aif1 levels were lower in AAV_FH1-4^19-20 treated retinas compared with AAV_EGFP ischemic controls (Unpaired t-test: **P < 0.01). B Quantification of IBA1-positive microglia/macrophages was performed in the respective retinal layers to detect cellular migration in response to the tissue damage (unpaired t-test). C Representative microscopic images of IBA1 immunostaining on retinal sections at 14 dpi. D Representative microscopic images of IBA1 and CD68 co-immunostaining on retinal sections at 14 dpi. E Mean fluorescence intensities of CD68, a lysosomal marker upregulated in activated microglia/macrophages, were measured in IBA1 + cells. Ordinary One-Way-Anova with Tukey’s multiple comparison: *P < 0.05; ***P < 0.001; ****P 0.0001. Colored asterisks indicate comparison of cells from ischemic retinas at 14 dpi versus 3 dpi of the same treatment group (as indicated by the color of the asterisk). Each data point per microglial cell (from 3–4 retinas per group) is represented by a dot in the graph. A, B Each data point per biological replicate (n = 3–4) is represented by a dot in the graph
In the ischemic retina, we observed increased numbers of IBA1-positive cells in all retinal layers compared with the non-ischemic control. By 14 dpi, these numbers converged to the non-ischemic level. Interestingl
留言 (0)