
記住我
The Swedish National March Cohort (SNMC) was initiated in September 1997 as a four-day fundraising event by the Swedish Cancer Society. The cohort consists of 43,865 women and men who responded to an extensive 36-page questionnaire with information about lifestyle factors and medical history, which were collected in almost 3600 cities and villages around Sweden. The study design has been described previously [19].
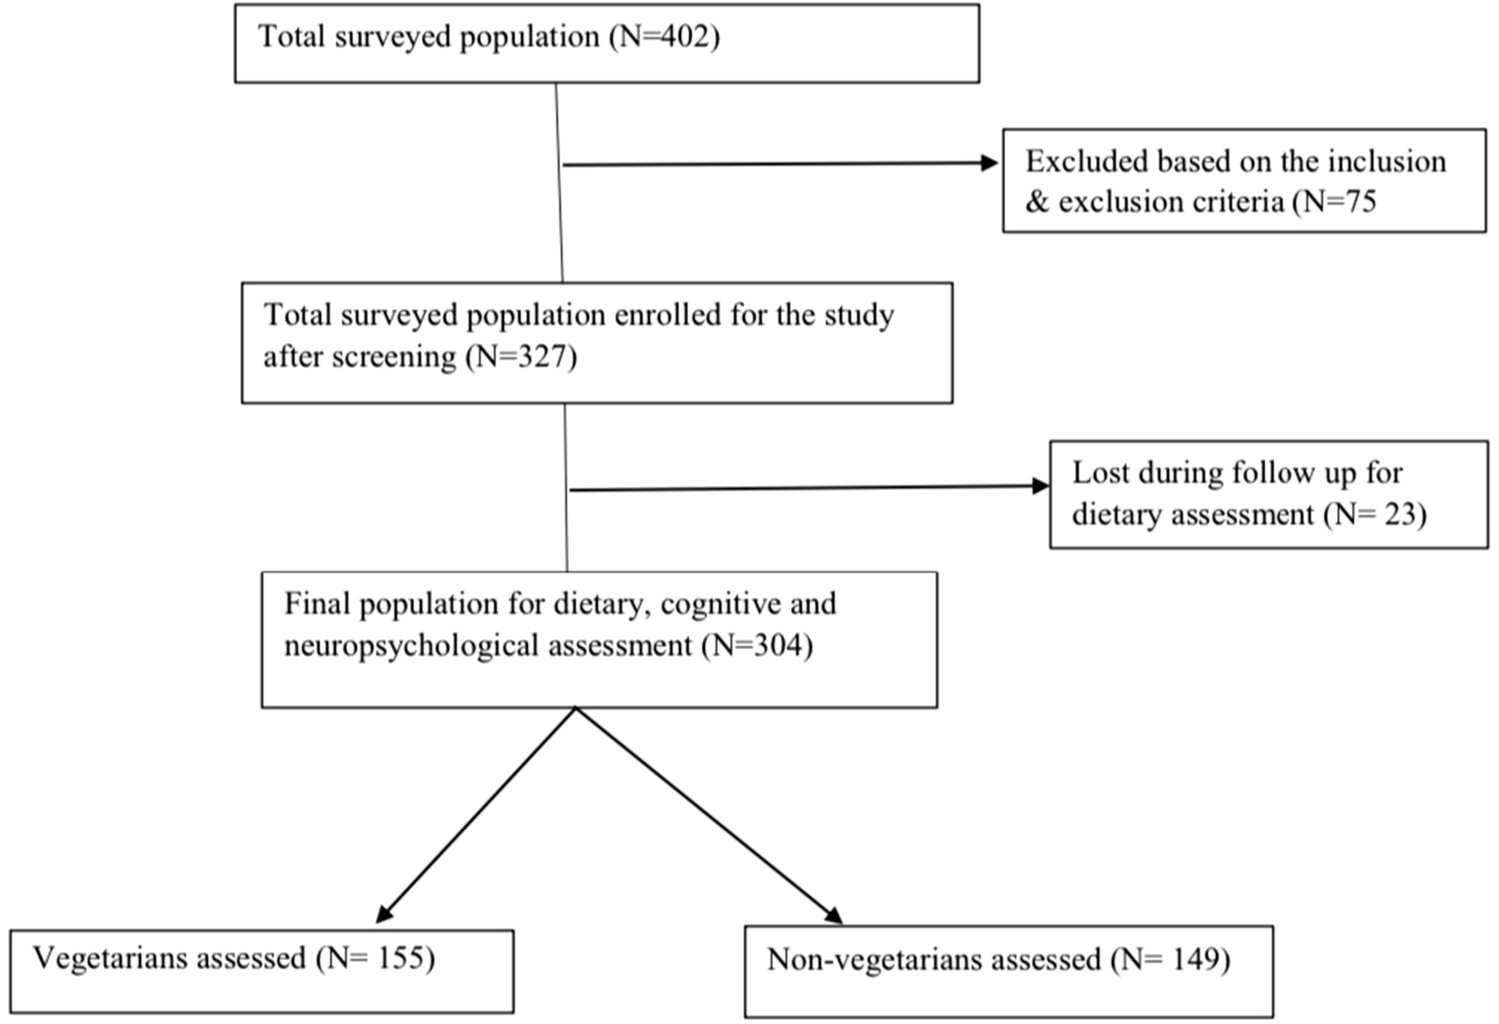
Inclusion and exclusion criteriaA total of 43,865 individuals gave informed consent and answered the questionnaire. We excluded individuals with an incorrect national registration number (n = 11), those younger than 18 years of age at enrollment (n = 1740), and those who had died (n = 8) or emigrated (n = 43) before the start of follow-up. This resulted in 42,063 eligible individuals. We further excluded individuals with a history of cardiovascular disease before the beginning of follow-up (heart failure, stroke, MI or CVD in general) (n = 4135) according to the International Classification of Diseases (ICD) versions 7 to 10 by linkage to the National Inpatient and Outpatient Register (ICD-7: 400–468; ICD-8: 330–334; ICD-9: 390–459; ICD-10: 100–199). Individuals with a previous cancer diagnosis other than non-melanoma skin cancer (n = 2677) were further excluded through linkage to the National Cancer Register (ICD-7:191 ICD-10: C44) before the start of follow-up. Finally, we excluded participants with missing food frequency questionnaire (FFQ) data (n = 17) or extreme values of total energy intake (± 3SDs from the mean value of the log-transformed energy intake) (n = 366) to ensure data quality. The final study sample for analyses included 34,898 individuals.
Baseline characteristicsBaseline characteristics were assessed at enrollment and included sex (female/male), age (years), weight (kg), height (cm), level of education (≤ 13 years or > 13 years), and smoking status (never, former, current). Body mass index (BMI) was calculated as kg/m2. Self-reported information on prevalent hypertension, diabetes, and lipid disturbance (yes/no) were also defined in the questionnaire as having ever been treated by a physician for these conditions. Total physical activity was calculated as total metabolic energy turnover (MET) hours per day for time spending from sleeping to more vigorous activities summed up to 24 h. Each MET value for each intensity level from 0.9 MET for the lowest activity level up to 8 for the highest activity level was used to calculate total MET-hour/day [20].
Adherence to the Nordic Nutrition RecommendationsDiet was assessed at baseline using a validated 85-item semi-quantitative FFQ [21]. Dietary supplements were not included. Participants were asked to report how often, on average, they consumed each item, by answering the question “How much on average do you eat/drink the following items”, with no specific time frame. Standard portion sizes were specified, and participants indicated frequency of consumption depending on the food item, from 0 to 7 or more servings per day, or as: 0, 1–3 times per month; 1–2, 3–4, 5–6 times per week or 1, 2, 3 or more times per day. The consumption of foods and beverages was then converted into nutritional data for daily intakes in grams or micrograms, including total energy, macro- and micronutrients, based on data from the Swedish Food Agency database (1998 version) [22]. Nutritional intakes were calculated once, and the same nutrient intakes were applied to calculate adherence to the four different NNR-scores, i.e. NNR1996, NNR2004, NNR2012, and NNR2023.
We estimated adherence to the NNR by creating a score based on 27 different nutrients and physical activity. In addition to a primary score based on the most recent NNR published in 2023 (NNR2023) [17], we also calculated NNR scores based on three previous versions, i.e., NNR2012 [16], NNR2004 [15], and NNR1996 [14]. The earliest version from 1996 (NNR1996) did not include physical activity. Our score with nine weighted groups (0–9 points), is based on the NNR–score that was originally developed by Fondell et al. [23], and later modified by Möller et al. [24]. The nine weighted groups were fat (including total fat, saturated fat, monounsaturated fat, polyunsaturated fat); protein; carbohydrates (including carbohydrates and sugar); vitamins (including 10 different vitamins); minerals (including 7 different minerals); fiber; salt; alcohol; and physical activity.
In the calculation of the NNR–scores we included total fat, i.e., saturated, mono-unsaturated and poly-unsaturated fat, carbohydrates, protein, and alcohol in energy percentage and daily intake of fiber and sodium, ten vitamins such as vitamin A, thiamine (vitamin B1), riboflavin (vitamin B2), niacin (vitamin B3), vitamin B6, folate, vitamin B12, vitamin C, vitamin D, and vitamin E, and seven minerals such as calcium, phosphorus, magnesium, potassium, iron, zinc, and selenium. All micronutrients were energy–adjusted on the log scale using the residual method for women and men separately [25], in order to remove extraneous variation by energy intake. The recommended intakes for all components included in the four different NNR–scores are shown in the Supplementary material, Table S1.
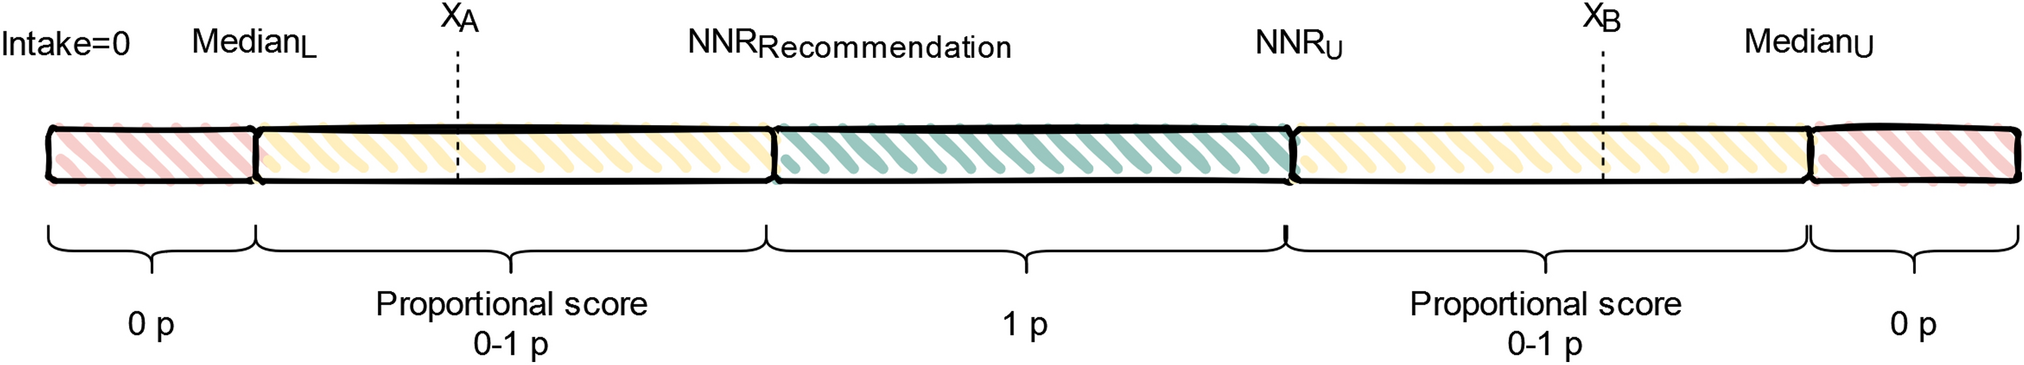
One point was given for perfect adherence, i.e., when the intake was within the daily recommended intake (RI) cut-off and the NNR upper (NNRU) level, see Fig. 1. For physical activity, adherence was defined as fulfilling the recommendation of moderate-to-vigorous physical activity of ≥ 150 min/week. Zero points were given for non-adherence, i.e. if the intake was above or below the median lower (MedianL) or median upper (MedianU) for the lowest and highest median percentiles for each nutrient and physical activity. A proportional score between 0 and 1 point was also calculated for intermediate adherence, i.e. intakes between the recommended intake and the median cut-offs according to Eqs. 1 and 2.
Fig. 1
An overview of the calculation of the Nordic Nutrition Recommendations (NNR) score for each nutritional component and physical activity. The daily recommended intake (NNRRecommendation) and NNR upper (NNRU) represent the range of the recommended intake and upper cut-off points defined in NNR. Intake between these levels gives one point (perfect adherence). Median lower (MedianL) and Median upper (MedianU) define the median within the lowest and largest percentiles in our study population i.e., the extreme cut-off points for lower and upper intakes, respectively. Intakes outside the median cut-offs points give zero points (non-adherence). A proportional score (0–1) was calculated for intakes between the NNRRI and the median cut-off (intermediate adherence) according to Eqs. 1 and 2. XA and XB corresponds to actual intakes within the range of the proportional score. Some of the nutrients have no defined upper limit. This figure is inspired by Möller et al. [23]
For intakes (or physical activity) below the recommendation, the score varied between 0 and 1:
$$} = \left( }_}} - }_}} } \right)/\left( }_}}} - }_}} } \right)$$
(1)
For intakes above the NNRU, the score varied between 0 and 1:
$$} = 1 - \left[ }_}} } \right. - \left. }_}} } \right)/\left( }_}} } \right. - \left. }_}} } \right)} \right]$$
(2)
XA and XB correspond to actual intakes within the range of the proportional score. Vitamin C, folate, vitamin B12, vitamin B1, vitamin B2, magnesium, potassium, zinc, and fiber had no NNRU defined in the NNR (MedianL was only used for the proportional score), while saturated fat, sugar, alcohol and sodium only had an upper limit, i.e., reverse recommendation (MedianU was only used for the proportional score).
Score components that included several individual recommendations (vitamins, minerals, fat, and carbohydrates) were summed and divided by the number of included recommendations to get equal weights for the nine variables in the final score. The points of the main nine variables were then summed into a total adherence NNR–score ranging between 0 and 9 points (0–8 points NNR1996). For the primary score NNR2023, low adherence was defined as < 6.3 points, moderate adherence as 6.3–7.2 points, and high adherence as > 7.2 points, to achieve a sufficient number of individuals in each group (corresponding to the 25% and 75% quartiles for the low and high and 50% for moderate) and to avoid to narrow intervals.
Outcome measures and follow-upThe main outcome was the first incident MI or stroke (defined as a first hospitalization) occurring between October 1, 1997 and December 31, 2016. Participants were censored in case of emigration or death during the follow-up period. The national registration numbers enabled the cohort to be linked to the Swedish National Inpatient and Outpatient Register to determine non-fatal events, Swedish Cause of Death Register for fatal events, and Swedish Population Register for information on emigration. The following ICD codes; 410 (ICD-9), and I21 (ICD-10) were used to identify incident cases of MI, and 430, 433, 434 and 436 (ICD-9) and 160, 161, 163.0–163–5, 163.8–163.9 and 164 (ICD-10) for stroke, in the National Inpatient and Outpatient Register and the Cause of Death Register.
Statistical analysisBaseline characteristics are reported as means (standard deviation) for continuous variables, given that all were normally distributed based in visual inspection, or as frequencies and proportions for categorical variables. We fitted Cox proportional hazards regression models to estimate hazard ratios (HRs) with the corresponding 95% confidence intervals (CI) for associations between adherence to the NNR and incident MI and stroke during follow-up. Adherence to the NNR was included in the models as both a continuous variable and as categorical, respectively, with low adherence as the reference for the latter. Ties in survival times were handled using the Breslow method and the proportional hazards assumption was assessed by using Schoenfeld residuals for all covariates. If the assumption was violated, we included a stratification term for the corresponding variable in the model. Indeed, we observed a deviance from this assumption with respect to sex in the MI model and the categorical exposure itself for the stroke model, and thus also performed stratified analysis.
We ran multivariable analysis for controlling for potential confounders based on known risk factors for stroke and MI, including age, sex (not included in models stratified by sex), BMI, smoking status, education level, physical activity level in total METh/day, total daily energy intake, as well as self-reported history of diabetes, lipid disturbance and hypertension. We created a new categorical variable based on the median of each of NNR-score group and fitted it as a continuous variable in the model to examine linear trends across the groups. We further conducted stratified analyses by sex and investigated potential interactions between the exposure and sex on the multiplicative scale using the likelihood ratio test comparing nested models. We performed a sensitivity analysis to reduce the risk of possible reverse causation by excluding cases of MI or stroke that occurred during the first two years of follow-up. The statistical analyses were performed with Stata version 17.0 (Stata Corporation, Collage Station, TX, USA).
Ethical approvalThis study was approved by the Regional Ethical Review Board at Karolinska Institutet, Stockholm, Sweden (Dnr: 97-205 and 2017/796-31). Informed consent was obtained from all individual participants included in this study.
留言 (0)