
記住我
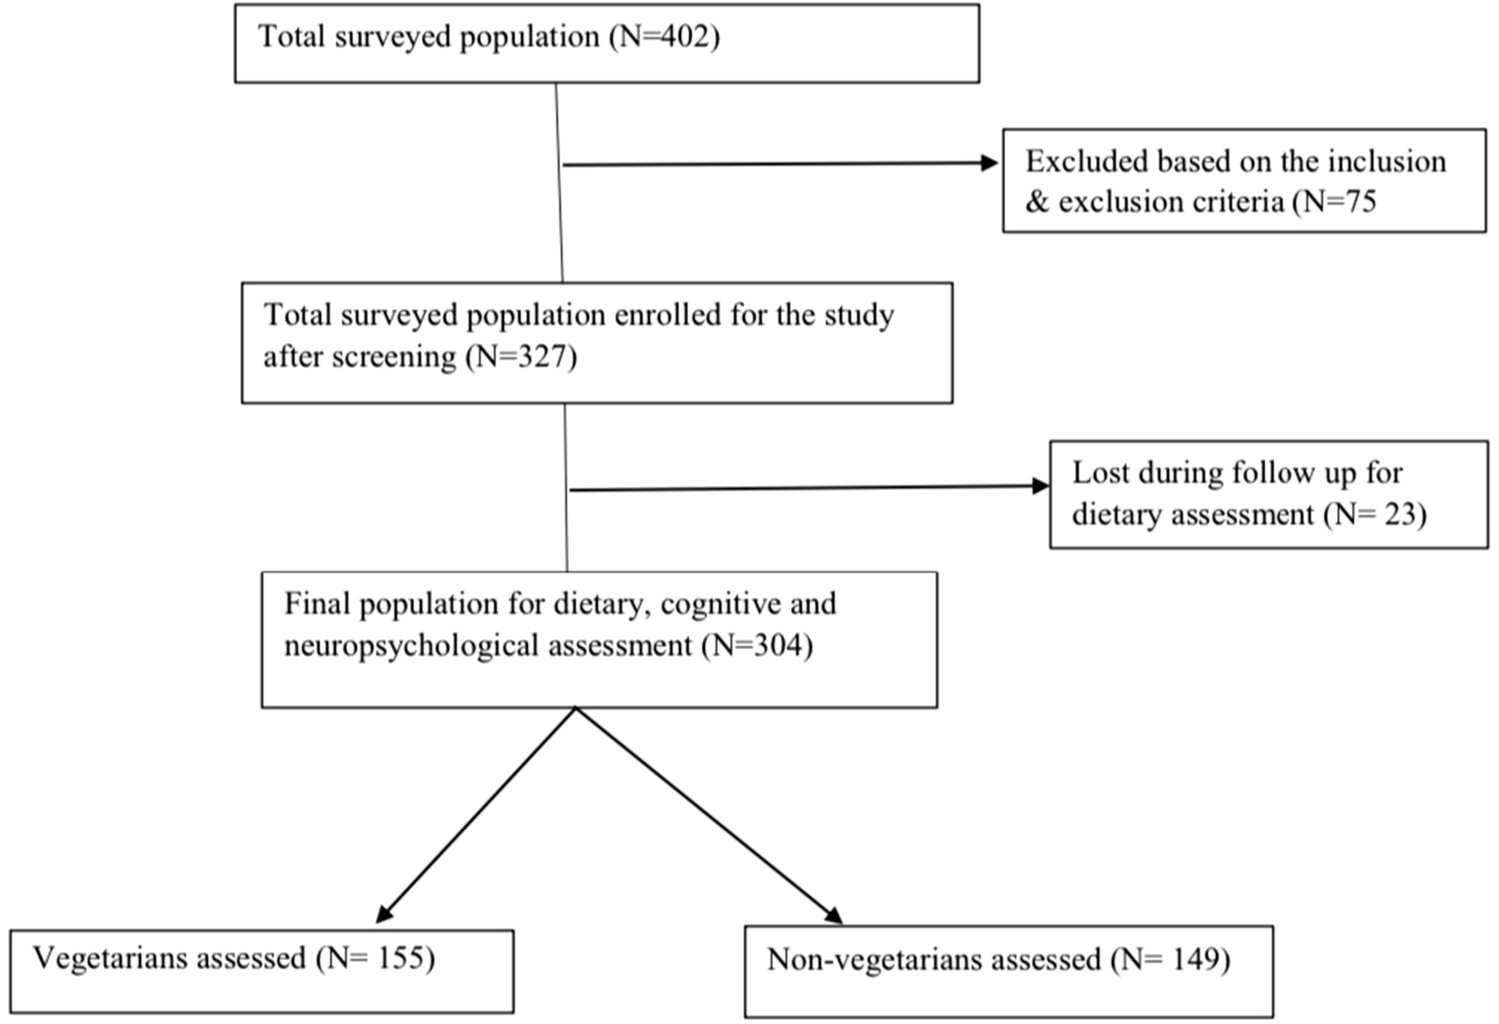
The study selection process is outlined in the flow diagram depicted in Fig. 1. The literature search within the three databases identified 6850 potentially eligible publications, which were reduced to 5901 articles when duplicates were removed. 5730 publications were excluded due to irrelevant titles and abstracts. In total, 171 articles were subjected to full text screening. Out of the 171, 155 were found not to be eligible due to different reasons, which are shown in Supplementary Material S6. Most of the reasons of non-eligibility referred to irrelevant exposures or lack of exposure-outcome investigations fitting the research question. Three SRs were excluded because of a “critically low” AMSTAR 2 rating [16,17,18] (Supplementary Material S7). All three SRs used only one database for their literature search. Additionally, Altorf-van der Kuil et al. [16] and Tielemans et al. [18] failed to conduct an adequate risk of bias assessment and Dong et al. [17] failed to provide a list of excluded studies. A total of 16 SRs were considered eligible to be addressed in this umbrella review. Details of these studies (outcomes, rating according to methodological quality, outcome-specific certainty of evidence) are found in Table 1, which subdivides the SRs into total protein, animal and plant protein and those which compared animal with plant proteins. The detailed results of the assessment of the methodological quality are shown in Supplementary Material S7 and of the outcome-specific certainty of evidence in Supplementary Material S8. The duration of the underlying primary RCTs ranged from one week to two years. Approximately 10% had a duration of one to four weeks, while around 20% had a study duration of at least one year. The sample size of these underlying primary RCTs ranged between seven and 419 participants, with approximately 10% having fewer than 22 participants, around 20% having more than 100 participants, and approximately 10% having more than 150 participants. There were only eight underlying primary cohort studies, with a follow-up duration of 1.5–11.3 years. Their sample size ranged from 272 to 80,426 participants. Two cohort studies investigated fewer than 1000 participants, while five cohort studies had participant numbers ranging between 1361 and 5880. One cohort study had a relatively large number of participants, specifically 80,426.
Fig. 1 Total protein studies
Ten SRs addressed total protein intake and BP [19,20,21,22,23,24,25,26,27,28] (Table 1A). Two of these SRs included prospective cohort studies and investigated the association between total protein intake and BP or hypertension [22, 25]. The other SRs analysed only RCTs [19,20,21, 23, 24, 26,27,28]. The SRs with RCTs usually included individuals of both sexes and healthy subjects, but also accepted original studies that were conducted with individuals with overweight, hypertension and diabetes. High-protein diets used in the RCTs typically contained more than 25 energy% (E%) proteins. The quantity of proteins in the control diets mostly ranged from 10 to 20 E%. The study of Rebholz et al. [19] analysed only RCTs in which carbohydrates were replaced by protein.
The two SRs including prospective studies did not find associations between protein and BP or hypertension [22]. The SR of Pedersen et al. [22] included two prospective cohort studies [29, 30], but also a SR with MA [31], that analysed cross-sectional studies, but also two prospective cohort studies, one with young adults [32] and another with children [33]. The prospective cohort study with young adults found inverse, but predominantly non-significant associations between protein intake and BP [32]. The SR of Mousavi et al. [25] meta-analysed five cohort studies and did not find a significant association between total protein intake and risk of hypertension.
Nine SRs of RCT reviewed or meta-analysed the effect of total protein intake on BP [19,20,21,22,23,24, 26,27,28]. Rebholz et al. [19] found a reduction in SBP and DBP when carbohydrates were replaced by protein. The SR of Santesso et al. [20] observed no effect of protein on BP when comparing the final values between the intervention and control group (21 RCTs), but reported a significant reduction in BP following protein intake (15 RCTs) when comparing the final and baseline values. The SR of Wycherley et al. included five RCTs on BP and did not find significant effects of high-protein diets on SBP and DBP [21]. Schwingshackl and Hoffmann [23], conducting an MA of 11 RCTs addressing a similar research question, reached the same conclusion, revealing no effect of protein intake on SBP or DBP, neither in the MA of all RCTs, nor in the subgroup of high-quality RCTs [23]. No conclusive effects of dietary proteins on BP were found in the SR of Pedersen et al. [22]. An insufficient control of ethnicity and body weight were given as reasons for this conclusion [22]. Clifton et al., who meta-analysed 19 long-term (> 12 months) weight loss RCTs, did not observe a significant effect of dietary protein in exchange for carbohydrates on SBP and DBP [24]. The SR of Lonnie et al. [26] included only one RCT that investigated the effect of total protein (mixture of pea protein, soy protein, milk protein, egg white protein) compared to maltodextrin or sucrose on postprandial BP [34]. This study found no protein effect on postprandial SBP. In contrast, DBP was significantly increased 60 min postprandial compared to maltodextrin, but not compared to sucrose intervention. The SR of Vogtschmidt et al. [27] included an MA of 25 RCTs and found high-protein diets (protein range: 20–36 E%) accompanied by a greater reduction in SBP than low-protein diets (14–23 E%), whereas the protein effect on DBP did not reach statistical significance. The SR of Hengeveld et al. [28], included four RCTs on protein intake and BP. None of these studies found an effect of an increased protein intake on SBP and DBP. The authors remarked critically that three of the four RCTs did not reach a sufficient statistical power to demonstrate an effect on BP.
The methodological quality assessed with AMSTAR 2 was graded as high for three SRs (all SRs of RCTs) [20, 23, 27], moderate for four SRs [22, 24, 25, 28] and low for three SRs [19, 21, 26] (Table 1A). The methodological quality of the SRs was independent of the publication date. The NutriGrade assessment included 23 entries separated according to the outcome investigated. Most of the ratings regarding the outcome-specific certainty of the evidence were low (n = 17). Only four exposure-outcome assessments were rated as moderate, and two assessments as very low. The list of studies being used in the SRs that demonstrate the potential study overlap is shown in Supplementary Material S2. The majority of RCTs on total protein were used also once (n = 44), while 29 RCTs were utilised multiple times (up to five times), mostly published between 2000 and 2005. Regarding cohort studies, there was only minor overlap (Supplementary Material S2B).
Animal protein studiesSix SRs addressed animal protein and BP, with two of them analysing RCTs with milk proteins [35, 36]. Of the remaining four SRs on animal protein, three included cohort studies [22, 25, 37], and one analysed RCTs that replaced carbohydrates by animal protein [19]. Pedersen et al. [22] who analysed two cohort studies did not find an association between animal protein intake and BP. The SR of Chalvon-Demersay et al. [37] found in three out of four prospective studies no link between animal protein and BP, and an inverse association in one study. The formally well-performed quantitative SR with MA of Mousavi et al. [25] including five cohort studies did not find animal protein intake associated with the risk of hypertension. The only SR with RCTs specifically addressing animal protein found that animal protein replacing carbohydrates led to significant reductions in SBP and DBP [19]. There are also two SRs of RCTs that addressed subtypes of animal proteins, in particular, proteins from milk. These were the SR of Hidayat et al. [35], who meta-analysed seven RCTs that investigated the effect of milk protein, in particular, whey protein and casein, on BP, and the SR of Badely et al. [36], who meta-analysed 18 RCTs that investigated the effect of whey protein on BP. Both SRs found a reduction in SBP and DBP following milk protein intake. The findings of these SRs are important with respect to health implications and dietary recommendations, but are not within the scope of the current review that aimed to investigate animal proteins in general. Thus, both SRs were not included in the evaluation of the overall certainty of evidence.
The outcome-specific certainty of evidence (NutriGrade rating) was rated four times as moderate and eight times as low, and the methodological quality (AMSTAR 2 rating) once as high [35], three times as moderate [22, 25, 37] and twice as low [19, 36]. The list of original studies being used in the SRs is shown in Supplementary Material S2C and S2D. The studies used by Pedersen et al. [22] were also used by Chalvon-Demersay et al. [37] and Mousavi et al. [25], but there was no overlap of studies in the SRs of Chalvon-Demersay et al. [37] and Mousavi et al. [25].
Plant protein studiesSix SRs addressed plant proteins and BP [19, 22, 25, 37,38,39] (Table 1C). One SR analysed RCTs that replaced carbohydrates by plant proteins [19], three SRs analysed observational studies including cohort studies [22,
留言 (0)