
記住我
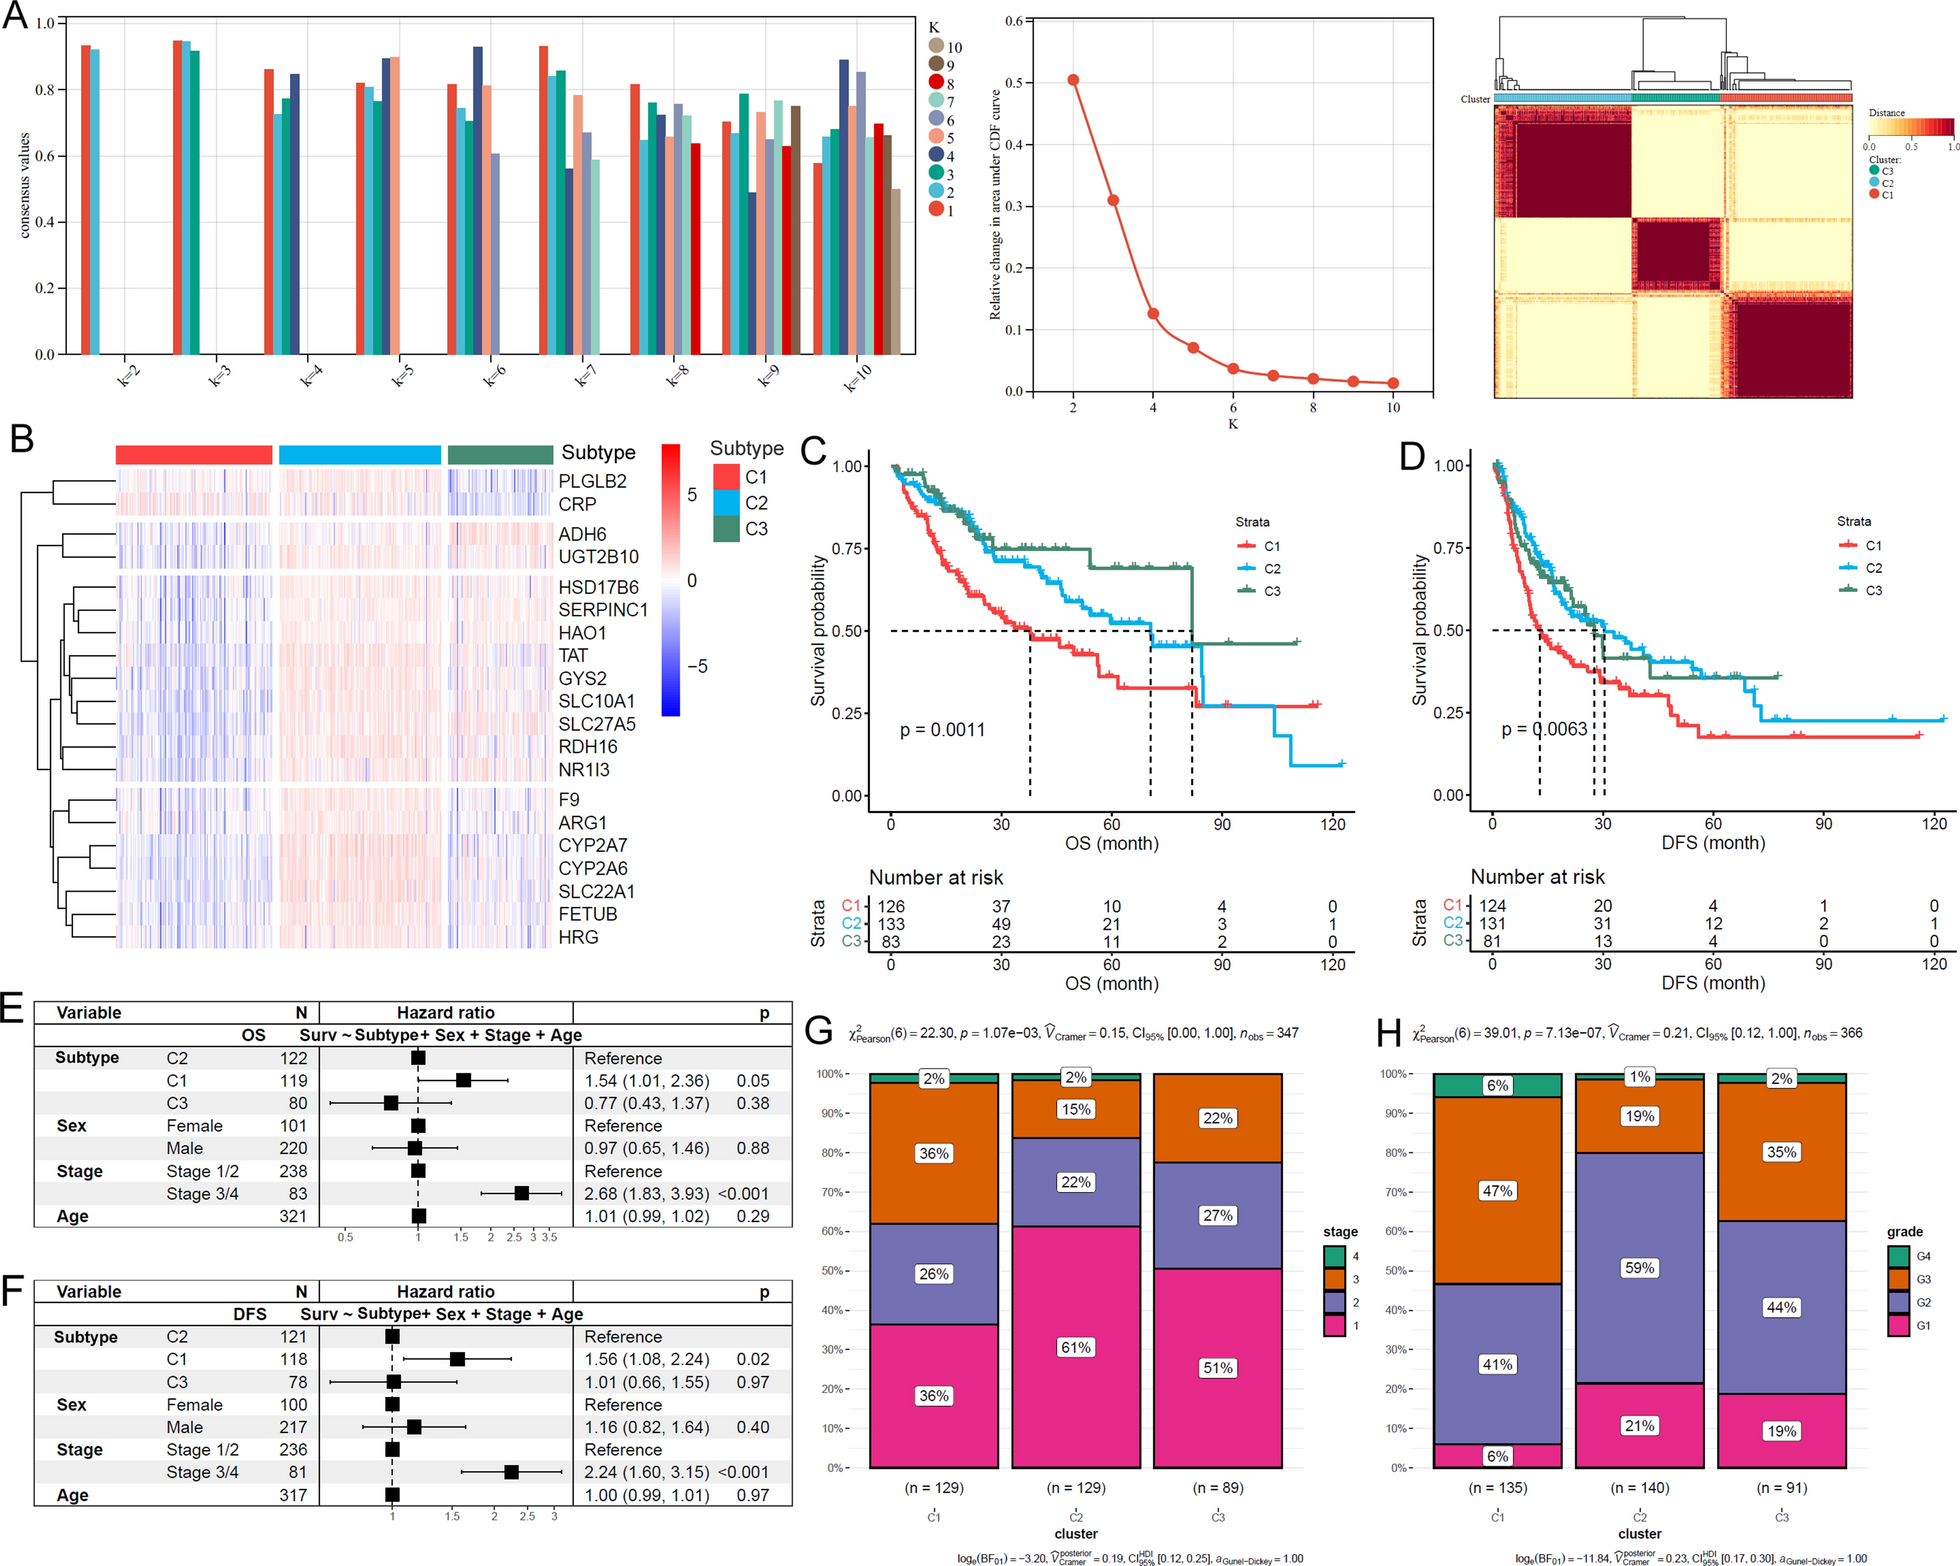


Compared with normal liver tissues, 80.4% (111/138) of the LSGs were lower expressed in TCGA-HCC tissues (Additional file 1: Table S2). Based on the LSG expressions, three HCC subtypes (clusters: C1, C2 and C3) were identified (Fig. 1A). Through Kruskal-Wallis test, 96.4% (133/138) of the LSGs presented significant expressional differences among the three subtypes (Additional file 1: Table S3). A representative gene expression profile heatmap of 20 LSGs of the TCGA-HCC subtypes was shown in Fig. 1B, indicating the obvious heterogeneity of LSGs in HCC. For their prognostic differences, C1 presented the shortest OS and DFS (Fig. 1C, D). Notably, with sex, stage, and age as the control variables, the unfavorable prognostic effects of the C1 subtype on HCC OS and DFS also existed (Fig. 1E, F). In addition, tumor stage (Fig. 1G) and grade distribution (Fig. 1H) were significantly different among the subtypes of HCC and the proportions of late stage (stage III/IV) and high grade (Grade 3/4) HCCs were highest in C1, indicating the association of HCC subtypes with HCC progression and differentiation.
Fig. 1
LSGs-based HCC subtypes and their differences in clinical characters. A Bases on LSGs expressions, HCCs were separated into three subtypes. B The expression profiles of 20 LSGs in TCGA-HCC. C, D Among the three subtypes, C1 HCCs presented shortest OS and DFS. E, F The unfavorable prognostic effects of C1 subtype on HCC OS and DFS were independent of age, sex, and tumor stage. G, H The comparisons of tumor stage and tumor grade among different HCC subtypes. Cluster analysis, Kaplan-Meier survival analysis with log-rank test, multivariable Cox regression analysis and Chi-square test were performed and p < 0.05 was considered statistically significant
Significant associations of HCC subtypes with HCC stemness, aging, liver function, and immune responseAs shown in Fig. 2, HCCs presented significantly lower LSGs score (Fig. 2A), higher stemness score (Fig. 2B), and lower aging score (Fig. 2C) than the normal liver controls, indicating the involvement of dysregulations of LSGs, stemness, and aging during HCC development. As the subtype identification was based on LSG expressions, it was not surprising to see the significant difference of LSGs score among different HCC subtypes and the C1 subtype with the poorest survival has the lowest LSGs score (Fig. 2D). The heterogeneity of stemness and aging level were also observed among the subtypes. C1 subtype presented the highest stemness score (Fig. 2E) and aging score (Fig. 2F), indicating the associations of HCC subtype with HCC stemness and aging. With regard to the relationship among the three parameters, as shown in Fig. 2G, H, LSGs score was significantly and negatively correlated with stemness and aging score in C3 HCC while no correlation was shown in C1 and C2 subtypes. However, all the three subtypes presented positive correlations between stemness score and aging score (Fig. 2I). The results indicated the complex interactions during HCC development. In addition, compared with C2 and C3 subtypes, C1 HCCs presented the highest MKI67 (Fig. 2J) and AFP expression (Fig. 2K). The highest ALB expression was shown in C2 HCCs, indicating the significant distinction of liver function among the different subtypes. The three HCC subtypes also presented differences in the microenvironment. As shown in Fig. 2M-O, compared with C1 and C2 HCCs, C3 had the lowest immune score, stroma score, and estimate score. As high estimate score indicated low tumor purity [24], the C3 were deduced to have the highest tumor purity among the three subtypes. The immune infiltration profiles in the subtypes were shown in Fig. 2P. Except for eosinophils and memory B cells, all of the other 26 kinds of immune cells were differentially infiltrated in the various HCC subtypes, with the lowest infiltration level in C3 HCCs of most of the immune cells (Additional file 2: Figure S1), consistent with the lowest immune score in C3.
Fig. 2
HCC subtype-specific pathways identified through GSEA analyses. A–C GSEA between C1 and C2, C1 and C3, and C2 and C3 subtypes, respectively. D The intersection of pathways among different HCC subtypes. E The HCC subtype-specific pathways comparing with other subtypes
HCC subtype-associated DEGs and their potential functionsAs shown in Additional file 2: Figure S2, 2030 genes were higher expressed while 772 genes were lower expressed in C1 than in C2. Compared with C3 HCCs, there were 3286 genes with higher expression while 715 genes with lower expression in C1 subtype. Additionally, 1329 genes were higher expressed while 545 genes were lower expressed in C2 than in C3. When the DEGs were intersected, there were 1812 C1-specific DEGs including 1445 highest expressed genes and 367 lowest expressed genes in C1 than in C2 and C3; 499 C2-specific DEGs (highest expressed: n = 290, lowest expressed: n = 209) and 1154 C3-specific DEGs (highest expressed: n = 244, lowest expressed: n = 910) were identified. The functions of the HCC subtype-specific DEGs were explored. Based on GO enrichment analysis, the C1-specific highest-expressed DEGs were significantly enriched in embryonic development related processes (Additional file 2: Figure S3A), while the C2-specific highest-expressed DEGs were associated with metabolic processes (Additional file 2: Figure S3B). For C3-specific highest-expressed DEGs, their associations with metabolic transport processes were obvious (Additional file 2: Figure S3C). Interestingly, similar to that of the C2-specific highest-expressed DEGs, the C1-specific lowest-expressed DEGs also presented significant associations with metabolic processes (Additional file 2: Figure S3D), which might partly account for the prognostic differences between the two subtypes. For the C2-specific lowest-expressed DEGs, their close relation to WNT signaling pathway was obvious (Additional file 2: Figure S3E). While for the C3-specific lowest-expressed DEGs, their associations with immune response and extracellular matrix organization were shown (Additional file 2: Figure S3F).
Through GSEA analyses, the pathways with significant correlation with HCC subtypes were identified. The top10 pathways positively (activated) or negatively (suppressed) associated with the gene expression differences between either two of the HCC subtypes were shown in Fig. 3A-C. Based on intersection of the pathways (Fig. 3D), we found that the subtype-specific processes which were consistently activated (up-regulated) or suppressed (down-regulated) in one of the subtypes contrasted sharply with that in the others (Fig. 3E). Among the three subtypes, the C1 subtype was positively correlated with six reactome pathways including o-linked glycosylation of mucins, GPCR ligand binding, extracellular matrix (ECM) organization, ECM proteoglycans, class B/2 secretin family receptors, and degradation of the ECM. Considering the crucial roles of ECM degradation in promoting cell migration, it indicated high potential of tumor metastasis in C1 HCCs. Various metabolic processes were negatively correlated with the C1 subtype, consistent with the GO terms “metabolic processes” enriched by the C1-specific lowest-expressed DEGs, indicating the weak liver function in C1 HCCs. As to the C2 subtype, its specific positive correlations with complement cascade, fatty acids, formation of fibrin clot clotting cascade, eicosanoids, arachidonic acid metabolism, and the binding and uptake ligands of scavenger receptors proposed its active metabolism and immune response. Most of the C2 subtype negatively-correlated pathways were about eukaryotic translation and cell cycle, suggesting its aberrant proliferation potential. For the C3 subtype, its positive relationships with porphyrins metabolism, substances (bile salts, organic acids metal ions and amine compounds), and heme degradation were consistent with the enriched GO terms “metabolic transport processes” of C3-specific highest-expressed DEGs. Moreover, similar to the GO terms enriched by C3-specific lowest-expressed DEGs, herein, the negative correlations of C3 subtype with extracellular matrix and immune response were also obvious.
Fig. 3
Different LSGs-based HCC subtypes presented differences in their stemness, aging and immune response levels. A–C Significant differences of LSGs score, stemness score, and aging score between HCC tumors and normal controls. D–F C1 HCCs presented lowest LSGs score while highest stemness score and aging score among the HCC subtypes. G The correlations between LSGs score and stemness score in HCC samples of different subtypes. H The correlations between LSGs score and aging score in HCC samples of different subtypes. I The significant positive correlation LSGs score and stemness score in HCC samples of different subtypes. J–L The expressional comparisons of MKI67, AFP, and ALB in HCC samples of different subtypes. M–O The comparisons of immune score, stromal score and tumor purity (negative correlated with estimate score) between HCC samples of different subtypes. P The heatmap of immune infiltrations in HCC samples of different subtypes. Wilcoxon test and Spearman correlation analyses were used and p < 0.05 was considered significant
The associations of LSGs methylation and risk factor compositions with HCC subtypesAs shown in Additional file 1: Table S4, most (558/668, 83.5%) of the CpG sites of the LSGs presented significant differences of their methylation levels among the HCC subtypes. The top-50 CpG site with significant differences were shown in Additional file 2: Figure S4 and the representative CpG sites with significant difference were visualized in Additional file 2: Figure S5. It was obvious that the C1 subtype with the poorest survival had the highest methylation levels, consistent with the lowest LSGs score of the subtype. Whilst, the risk factor compositions among different HCC subtypes presented no significant difference (Additional file 2: Figure S6). In addition, among the 138 LSGs, only 21 genes (21/138, 15.2%) presented significant differences of different risk factors (Additional file 1: Table S5), indicating that the impact of the risk factors on LSGs-based HCC subtypes was relatively small.
Validation of HCC subtypes in external datasetAmong the subtype-specific DEGs, with the threshold of |log2FC| >3 and adjusted p < 0.05, the top HCC subtype-specific DEGs (n = 159) were identified (Additional file 1: Table S6). The top specific DEGs for C1, C2, and C3 subtype were 64 (highest: 44, lowest: 20), 28 (highest: 20, lowest: 8), and 70 (highest: 41, lowest:29), respectively. As some genes were highest expressed in one subtype while lowest expressed in another subtype, there were 159 unique genes of all. With these genes as variables, based on SVM analysis, a discriminant model was constructed in TCGA-HCC dataset. The SVM model could discriminate 97.3% of the training set samples and 84.7% of the internal validation set samples, with an overall accuracy of 92.1% (Additional file 1: Table S7). When the model was applied to ICGC-HCC dataset, 93, 88, and 50 of the primary HCC samples were classified to be C1, C2, and C3 subtype, respectively (Additional file 1: Table S8). Based on Kaplan-Meier analysis and multivariable Cox regression analysis, the poorest OS outcome of C1 subtype in ICGC-HCC dataset was also shown (Fig. 4A) and the independent prognostic effects of C1 subtype was indicated (Fig. 4B).
Fig. 4
HCC subtype validation in ICGC-HCC dataset. A, B Prognostic effects of SVM-based HCC subtype on HCC OS. C, D Prognostic effects of NTP-based HCC subtype on HCC OS. F, G Comparisons of LSGs score, stemness score, and aging score in different ICGC-HCC subtypes. H–J Comparisons of LSGs score, stemness score, and aging score in different ICGC-HCC subtypes. K–M Comparisons of immune score, stromal score, and estimate score (tumor purity) in different ICGC-HCC subtypes
Considering the possible overfitting potential of SVM method, we also used NTP method for HCC subtype validation. Taking the top subtype-specific highest expressed DEGs as the subtype-specific genes, the TCGA-HCC samples could be classified with an accuracy of 82.2% (Additional file 1: Table S9). When the threshold was set to FDR < 0.05, 276 of 318 (accuracy: 86.8%) TCGA-HCC samples could be correctly discriminated. With FDR < 0.1, the accuracy was 85.5% (284 of 332). Herein, for the consideration of the accuracy and the sample size, we selected FDR < 0.1 as the threshold to evaluate the HCC subtypes in ICGC-HCC dataset. As shown in Additional file 1: Table S10, 204 of 231 (88.3%) ICGC-HCC samples met the criterion of FDR < 0.1 that 75, 72, and 57 HCC samples were classified into the C1, C2, and C3 subtypes, respectively. Through survival analysis (Fig. 4C, D), HCC patients of the HCC subtypes presented significant differences in their OS status and the C1 subtype tended to have the poorest outcome. The results were similar to that in Fig. 4A and B, in confirmation of the unfavorable effects of the C1 subtype in TCGA-HCC dataset. In addition, consistent with the results in TCGA-HCC dataset, the C1 ICGC-HCCs also presented the lowest LSGs score (Fig. 4E) and the highest stemness score (Fig. 4F) and aging score (Fig. 4G) among the three subtypes. In addition, MKI67 (Fig. 4H), AFP (Fig. 4I), and ALB (Fig. 4J) level, as well as the immune score (Fig. 4K), the stromal score (Fig. 4L), and the tumor purity (estimate score) (Fig. 4M), also showed the similar results to those in TCGA-HCC dataset.
The HCC subtype-related risk model for HCC prognosisThe LSGs and the HCC subtype-specific genes were investigated for their age, sex, and stage-corrected prognostic effects. Based on multi-variable Cox regression analyses, 64 genes were shown to be the prognostic indicators for TCGA-HCC OS, 22 of which were with p < 0.01 (Additional file 1: Table S11). As shown in Fig. 5A, the 22 genes were applied to LASSO Cox regression analysis and five (ADH4, PON1, PZP, MMP10, and NR0B1) of them were identified to be independent prognostic factors and were included in the risk model for HCC OS prediction. The risk model was as below:
Fig. 5
HCC subtype-related risk model and its correlations with HCC pathological features. A The tuning parameter lambda (λ) selection in LASSO Cox regression analysis using 10-fold cross-validation. B, C The risk model could effectively discriminate the 1-year, 2-year, and 3-year OS status of HCC patients in the training set (TCGA-HCC) and validation dataset (ICGC-HCC). D, E The independent prognostic effects of risk score in TCGA-HCC and ICGC-HCC datasets. F, G C1-HCCs presented the highest risk scores among all the HCCs in both TCGA-HCC and ICGC-HCC dataset. H, I The correlations of risk score with MKI67, CTLA4, PD1, and PD-L1 expressions in TCGA-HCC and ICGC-HCC samples
Based on ROC analysis, the risk model could discriminate 1-year, 2-year, and 3-year OS of TCGA-HCC patients with AUCs of 0.798, 0.722, and 0720, respectively (Fig. 5B). With the AUCs of 0.727, 0.666, and 0.688 in the discrimination of 1-year, 2-year, and 3-year OS of ICGC-HCC patients (Fig. 5C), the effectiveness of the risk model was confirmed. In Additional file 2: Figure S7, the higher risk score was shown to be significantly associated with the shorter survival in both TCGA-HCC and ICGC-HCC patients. Taking age, sex, and stage as control variables, the prognostic effect of the risk model was also valid (Fig. 5D-E), indicating the independent role of the risk score in predicting HCC OS. Additionally, when incorporating liver fibrosis, serum AFP, and the risk score into the survival analysis, only risk score was presented to be an independent prognostic indicator for HCC OS, while no significance of liver fibrosis and serum AFP was shown (Additional file 2: Figure S8). In Fig. 5F-G, among the three subtypes, C1 HCCs presented the highest risk scores in both TCGA-HCC and ICGC-HCC datasets. The expressional differences of the five genes among the HCC subtypes were evident and the heterogeneity was visualized in Additional file 2: Figure S9. Furthermore, the associations of the risk model with HCC proliferation and the immune check points were obvious. As shown in Fig. 5H-I, the HCC risk scores presented significant positive correlations with the proliferation marker MKI67, and two immune check point genes PD1 (PDCD1) and CTLA4. Nevertheless, no significant correlation between the risk score and PD-L1 (CD274) expression was discovered in the HCC tissues.
Expressional heterogeneity of the key genes in HCC cell linesAs shown in Fig. 6, significant differences of the key gene expressions among the HCC cell lines were shown. Both SNU449 cells and HCCLM3 cells presented a lower expression of ADH4 (Fig. 6A) than the well-differentiated Huh7 cells and HepG2 cells, indicating the positive associations of ADH4 with HCC differentiation. For PON1, its expressional differences among the four cell lines were obvious and Huh7 cells presented the highest expression of PON1 (Fig. 6B). Although no significant difference of PZP expression was shown among the cell lines, a tendency of lower level of PZP was indicated in HCCLM3 and HepG2 than in Huh7 cells (Fig. 6C). With regard to MMP10 expression (Fig. 6D), among the four cell lines, the lowest level was shown in Huh7 cells. Noticeably, SNU449 cells with low-moderate differentiation and HCCLM cells with high metastasis presented higher expression of MMP10 than the well-differentiated Huh7 cells and HepG2 cells, indicating the association of MMP10 with HCC metastasis and malignancy. For NR0B1, its expressional differences were indicated in the four cell lines, with the highest expression in highly metastatic HCCLM3 cells. The results represented the expressional heterogeneity of the key genes among different HCC cell lines, indicating the variation of the key gene expressions might be associated with HCC progression.
Fig. 6
RT-qPCR analysis of the key gene expressions in different HCC cell lines. A Lower expression of ADH4 in SNU449 cells and HCCLM3 cells than Huh7 cells and HepG2 cells. B Significant higher expression of PON1 in Huh7 cells than SNU449 cells, HCCLM3 cells, and HepG2 cells. C Expressional comparisons of PZP in Huh7 cells, SNU449 cells, HCCLM3 cells, and HepG2 cells. D Expressional comparisons of MMP10 in Huh7 cells, SNU449 cells, HCCLM3 cells, and HepG2 cells. E Expressional comparisons of NR0B1 in Huh7 cells, SNU449 cells, HCCLM3 cells, and HepG2 cells
Single-cell investigation of key gene expressions in HCCA total of 67,970 cells originated from tumor and normal tissue were classified into 47 clusters (Additional file 2: Figure S10A). Based on the gene expression profiles of different clusters (Additional file 2: Figure S10B), the single cells were grouped into eight major cell types (Fig. 7A). The expression profiles of the representative makers of the cell types and the key genes in the risk model were shown in Fig. 7B. Notably, ADH4 and PON1 were prominently expressed in hepatocyte-originated cells (named hepatocytes in this study) while the other three key genes were generally low expressed in all of the cell types. The significant expressional differences of the five genes were visualized in Additional file 2: Figure S11 and four of them presented the highest positive expression rate in hepatocytes. To investigate the expressional heterogeneity of the key genes, the hepatocytes were focused for further study. Adopting the UMAP method, the hepatocytes were divided into 23 subclusters (subcluster 0–22) (Fig. 7C) and their proportions in different tissues were significantly different (Additional file 1: Table S12). As shown in Fig. 7D, in contrast to the compositions (hepatocyte subclusters) of normal liver tissues (three major subclusters and one minor subcluster), metastatic lymph nodes (two major subclusters), and portal vein tumor thrombus (three major subclusters and one minor subcluster), the hepatocytes in the primary tumors indicated the highest heterogeneity of the hepatocytes.
Fig. 7
The expressional heterogeneity of the five key genes in hepatocyte-originated cells. A Cell types of liver and HCC tissues at single-cell level. B Marker gene and key gene expression profiles in different cell types. C Subclusters of hepatocytes in liver tissues and HCC samples. D The proportions of different hepatocyte subclusters in liver and HCC samples. E–I The expressional profiles of the five key genes in different hepatocyte subclusters. NT, non-tumor liver; PT, primary tumor; MLN, metastatic lymph nodes; PVTT, portal vein tumor thrombus
To visualize the key gene expression profiles in different tissues and subclusters, the 23 subclusters were divided into different groups according to their proportions, with their highest proportion in the tissues as their tissue group. The expressional profiles of ADH4, PON1, PZP, MMP10 and NR0B1were presented in Fig. 7E-I. ADH4 was commonly expressed in the three subclusters of normal livers while it was rarely expressed in some subclusters of primary tumors and all the subclusters in metastatic lymph nodes and portal vein tumor thrombus (Fig. 7E). For PON1, in contrast of its positive expression in hepatocyte subclusters of normal livers, metastatic lymph nodes, and primary tumors, its negative expression was shown in portal vein tumor thrombus (Fig. 7F). With regard to PZP (Fig. 7G), its positive expression was shown in only a small part of the subclusters while negative in the others. For MMP10 (Fig. 7H) and NR0B1 (Fig. 7I), their positive expression was only shown in tumor tissues, especially in the metastatic lymph nodes and portal vein tumor thrombus, indicating their associations with HCC metastasis. Furthermore, as shown in Additional file 2: Figure S12, all the five genes presented significant differences in the hepatocyte subclusters of the primary tumors. The other tissues also presented expressional heterogeneities of the genes (normal livers: ADH4 and PON1; metastatic lymph nodes and portal vein tumor thrombus: PON1 and NR0B1) in their hepatocyte subclusters. The expressional heterogeneities of the genes might, to some extent, account for the outcome distinction of the HCC patients.
Dysregulations of the key genes at protein levelCompared with the paired normal tissues, ADH4, PON1, and PZP were significantly down-regulated in early-stage HCCs (Fig. 8A–C). In contrast, NR0B1 presented higher positive expressions in HCC tissues than in the normal controls (Fig. 8D). As shown in Fig. 8E, F, significant negative correlations of ADH4 and PON1 with MKI67 expression was obvious, indicating their negative association with HCC proliferation. However, no significant correlation of PZP and NR0B1 expressions with MKI67 was presented (Fig. 8G, H). As to their associations with HCC invasion, ADH4 and PON1 appeared to be negatively correlated with HCC microvascular invasion (Fig. 8I, J). In contrast, in the HCC tissues concerning microvascular invasion, high proportion of positive NR0B1 expression was obvious, indicating its positive association with HCC invasion (Fig. 8L). However, no significant correlation of PZP expression with HCC microvascular invasion was shown (Fig. 8K). For MMP10, at protein level, its contribution to HCC tumorigenesis and its elevated expression at HCC initiation has been reported in previous studies [25, 26].
Fig. 8
Dysregulations of ADH4, PON1, PZP, and NR0B1 in HCC at protein level. A–C ADH4, PON1, PZP were lower expressed in HCC tissues than their paired normal liver controls. D NR0B1 positive expression was higher in HCC tissues than their paired normal liver controls. E–G Spearman correlations of ADH4, PON1, PZP, and NR0B1 with MKI67 expression in HCC samples. I–L Comparisons of ADH4, PON1, PZP, and NR0B1 expressions between HCC samples with and without microvascular invasion. Wilcoxon test, Spearman correlation analysis, and Char-square test were used and p < 0.05 was considered significant
The associations of ADH4, PON1, PZP, MMP10, and NR0B1 with anti-tumor drug sensitivities of HCC cell linesAs shown in Additional file 1: Table S13, ADH4 expression was found to be negatively correlated with the IC50 of 17-AAG, AZD6244, PD-0325901, AEW541, TAE684, Panobinostat, and RAF265 in HCC cell lines, indicating the positive association with HCC sensitivities to these anticancer drugs. Additionally, the negative correlation of PON1 with the IC50 of AEW541, ZD-6474, Lapatinib, and PD-0325901, and the negative association of PZP expression with the IC50 of Lapatinib, 17-AAG, Panobinostat, and AZD6244 in HCC were presented. For MMP10, its significant positive correlation with the IC50 of RAF265 in HCC were obvious. These representative significant correlations were visualized in Fig. 9A–M. Although none of the 24 anticancer drugs IC50s was shown to be statistically correlated with NR0B1 expression in HCC, there was a tendency of positive correlation (0.05 < p < 0.1) between NR0B1 expression and the IC50s of PLX4720, Panobinostat, and Topotecan (Fig. 9N–P).
Fig. 9
Correlations of the key gene expressions with anti-cancer drug sensitivity in HCC cell lines. A–D Significant negative correlation of ADH4 expression with IC50s of anticancer drugs in HCC cell lines. E–H Significant negative correlation of PON1 expression with IC50s of anticancer drugs in HCC cell lines. I–L Significant negative correlation of PZP expression with IC50s of anticancer drugs in HCC cell lines. M Significant positive correlation of PON1 expression with IC50 of RAF265 in HCC cell lines. N–P Positive correlation trend of NR0B1 expression with IC50 values of PLX4720, Panobinostat, and Topotecan in HCC cell lines. IC50s, half maximal inhibitory concentrations. Spearman correlation analysis was used and p < 0.05 was considered as statistically significant
The protein-drug and protein chemical interactions of ADH4, PON1, PZP, MMP10, and NR0B1As shown in Fig. 10, seven protein-drug interactions and 288 protein-chemical interactions of the five proteins were obtained. These drugs and chemicals might provide new clues and hints for the treatment and theraputic mechanism research of HCC.
Fig. 10
The protein-drug and protein chemical interactions of ADH4, PON1, PZP, MMP10, and NR0B1
留言 (0)