
Remember me


Thirty-six patients, nineteen females and seventeen males with an average age 33 years (range from 19 to 47), were included in this study. They were chosen from the Outpatient Clinic in the Oral and Maxillofacial Surgery Department, Faculty of Dentistry, Mansoura University, Mansoura, Egypt, for replacement of non-restorable maxillary anterior and 1st premolar teeth (esthetic zone) by immediate implant. The Institutional Review Board (IRB) of the Faculty of Dentistry, Mansoura University, Mansoura, Egypt, approved the current study in compliance with the seventh revision of the Helsinki Declaration in 2013 (A0103023OS). The study was following CONSORT guidelines for clinical trials. The study was listed on www.clinicaltrials.gov with registration number (NCT05878392) on 26/05/2023. All of the participants gave their written informed consent.
Sample size calculationThe total sample size was determined to be 10 implants in each group using G*power version 3.0.10 to calculate sample size-based t test = 2.31, 2-tailed, α error = 0.05 and power = 90.0% with effect size (2.63). To account for potential attrition by 20%, two additional implants were added to the total sample size (12 implants in each group). This calculation was based on a previous study by Oates and colleagues [22].
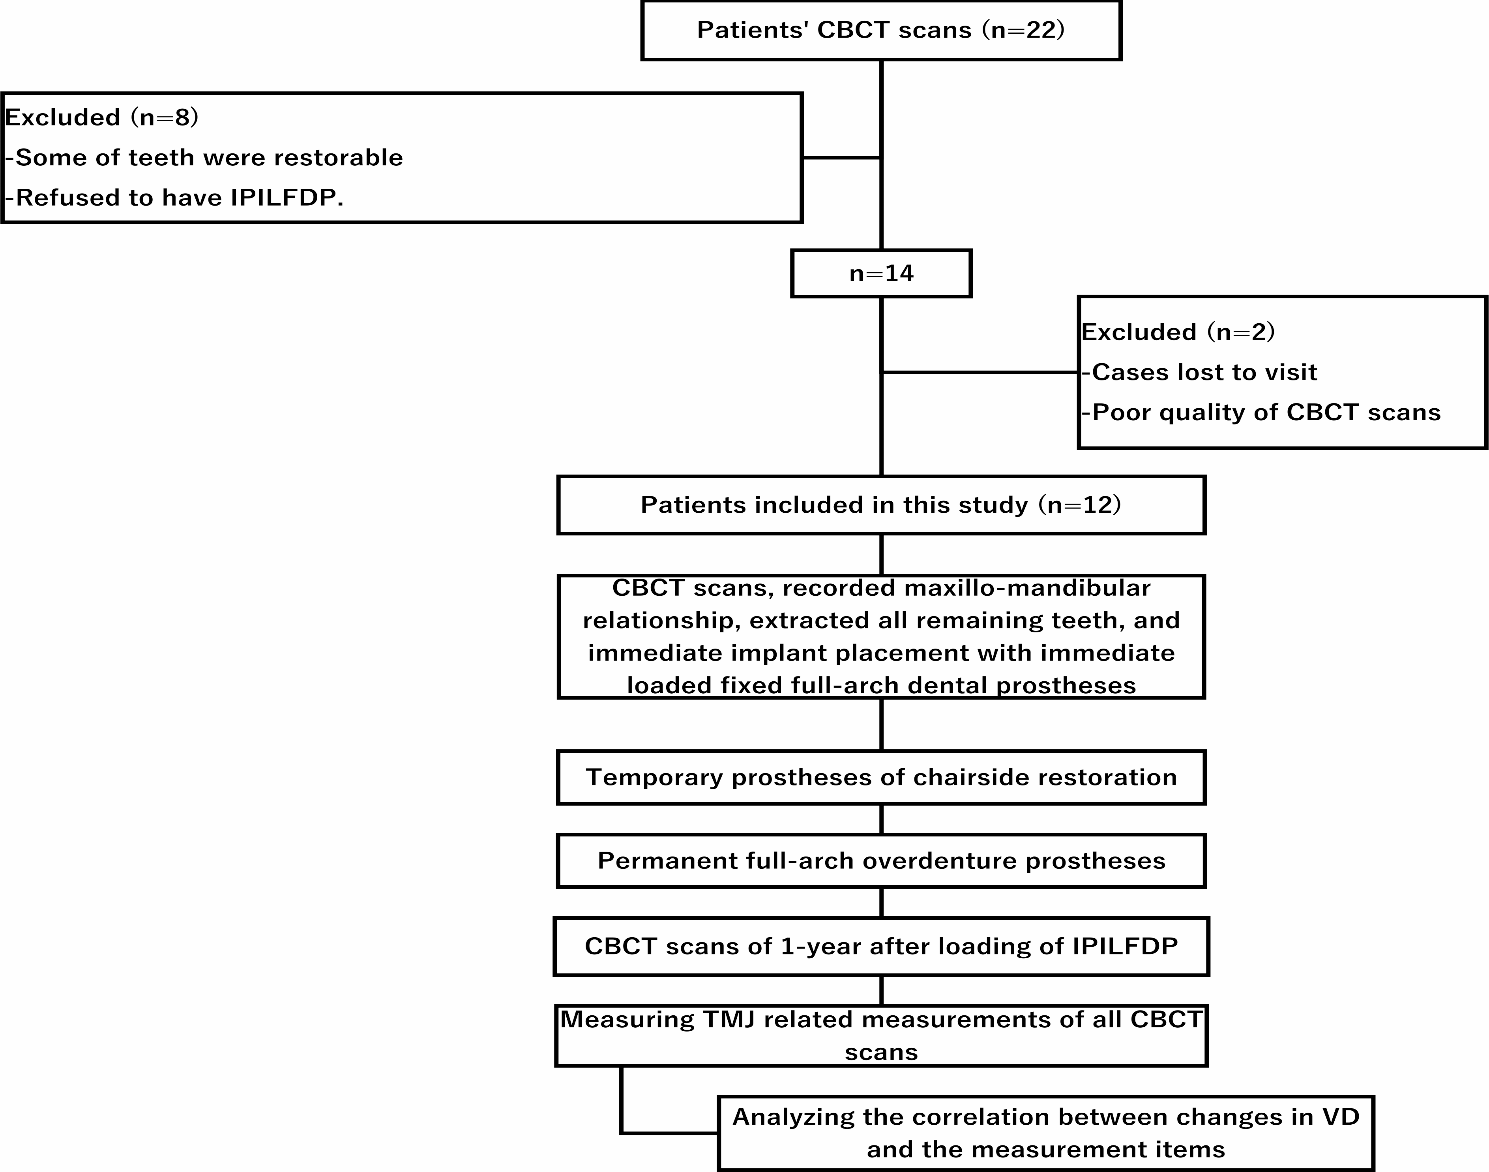
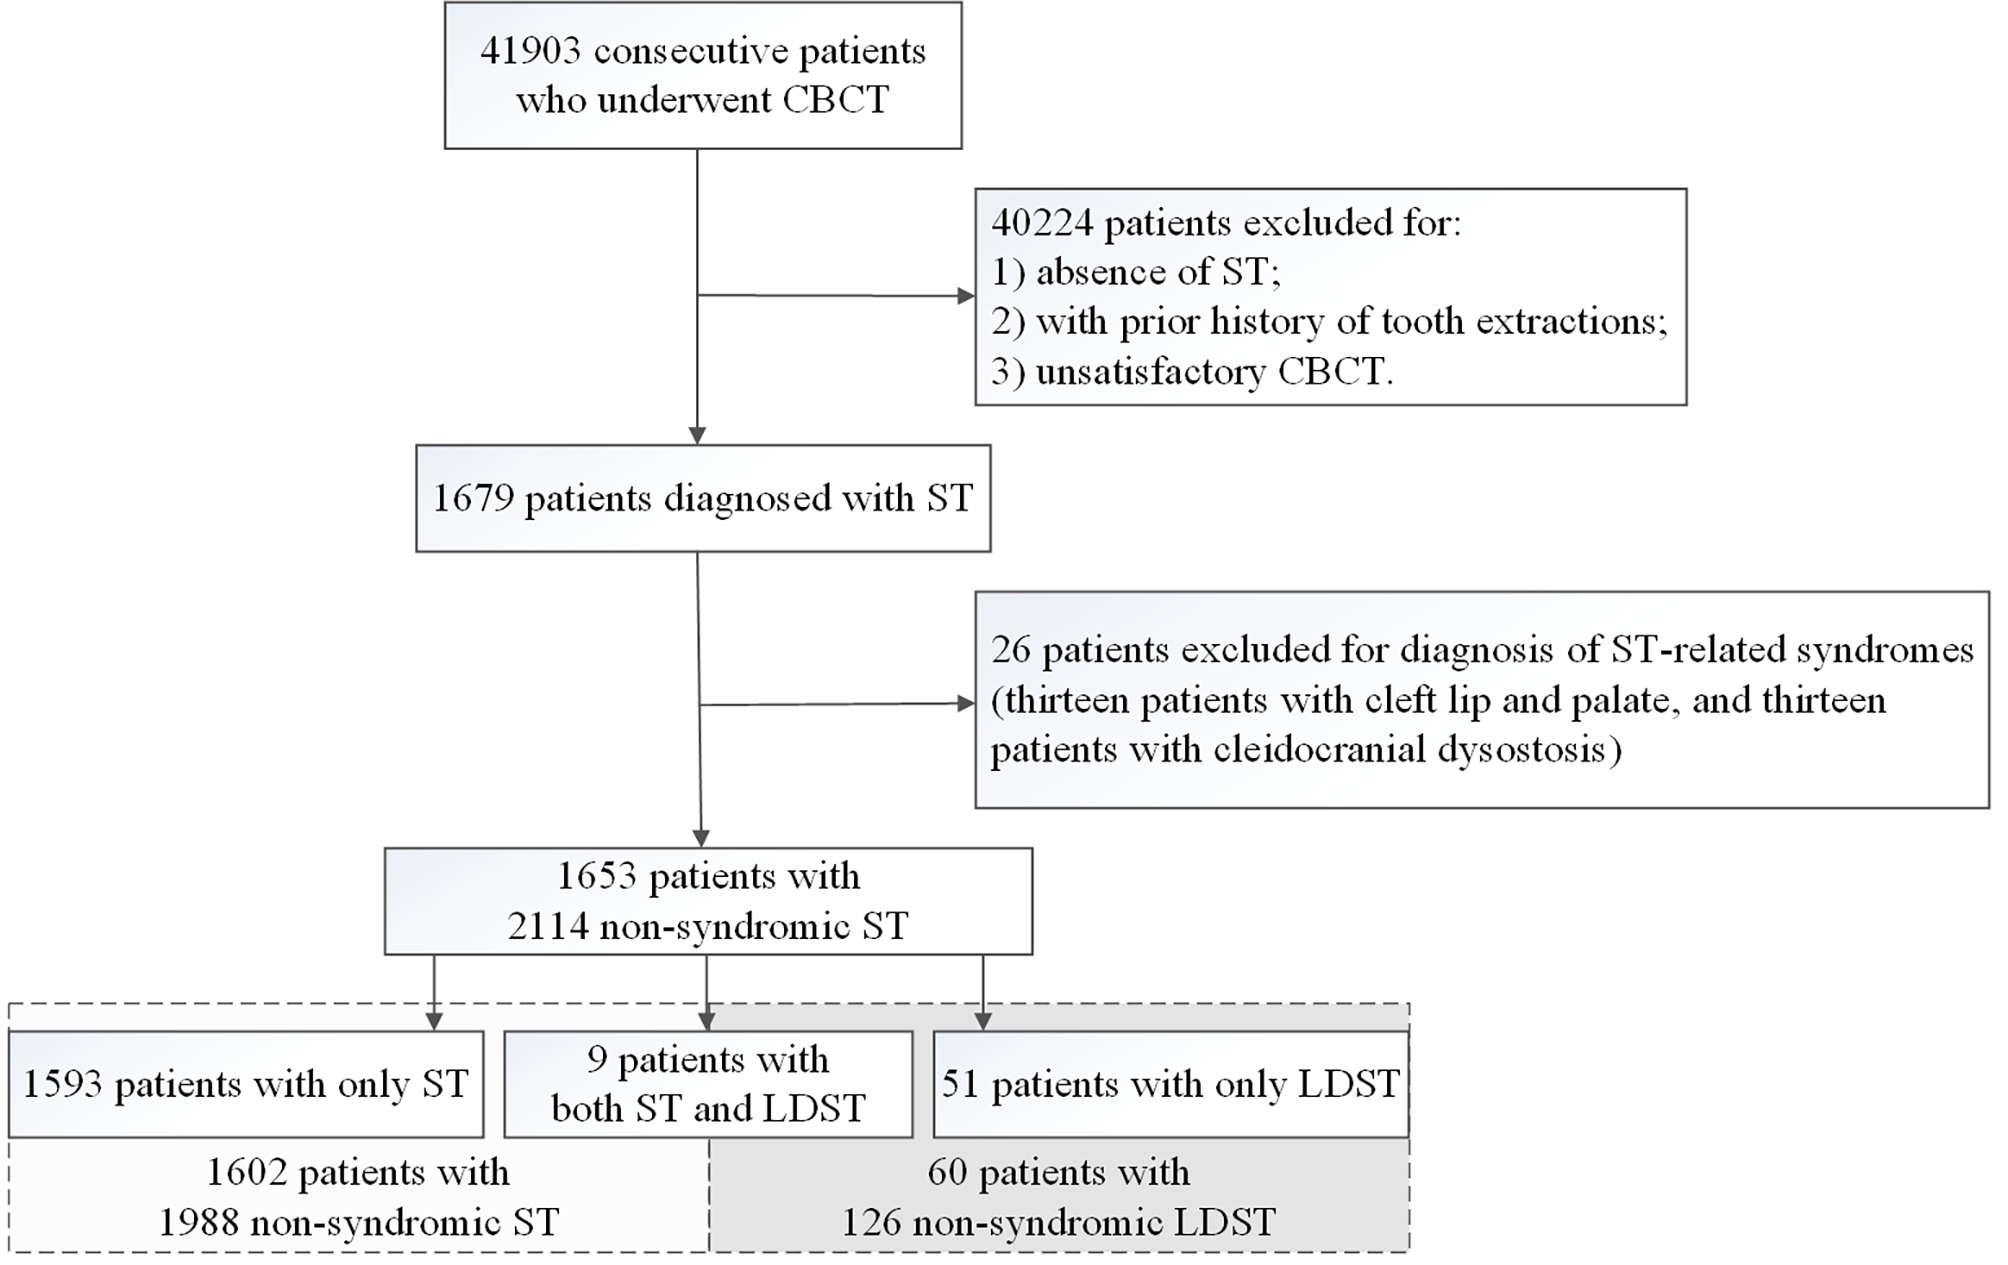
RandomizationOne of the department's senior residents, who was not involved in the study and was not aware of any relevant treatment protocols, carried out the randomization. 36 candidates were randomly distributed into three equal groups, 12 implants for each by using a computer-generated randomization list (SPSS v25.0). The distribution of the groups was Group 1 received PRF into the jumping distance, Group 2 received Xenograft into the jumping distance and Group 3 received Alloplastic bone grafting material into the jumping distance. The study design can be seen in Fig. 1.
Fig. 1
Flowchart representation of groups distribution
BlindingIt was impossible to blind the operator and the operator was not involved in either the distribution or evaluation processes. Furthermore, all patients were unaware of which group they were in. Throughout the follow-up times, the assessor carried out each evaluation step while being entirely unaware of the treatment protocol. Likewise, statisticians were unaware of treatments and groups.
Criteria for patient selectionInclusion criteria
Exclusion Criteria
1. Patient medically free from systemic diseases
1. A medical condition that would prevent implant surgery
2. Age above 18 years
2. Existence of non-treated generalized progressive periodontitis
3. A single maxillary anterior or 1st premolar tooth that couldn’t be restored
3. Smoker patients
4. Intact socket walls after tooth extraction
5. No acute infection was present
6. Jumping gap more than 2 mm in size
7. Free from history of bruxism
Preoperative measuresFor all patients, panoramic radiographs were taken to assess the mesiodistal width, the amount of bone above the apex and the root angulation (Figs. 2A and 6A). Two days before surgery, a prophylactic antibiotic regimen of 500 mg of amoxicillin (Emox, Egyption Int. Pharmaceutical Industries Co., E.I.P.I.C.O., A.R.E.) was prescribed every six hours. Before surgery, the patients were rinsed with Chlorohexidine HCl (0.12%) (Hexitol, the Arab Drug Company, Cairo, A.R.E.) for 1 min.
Fig. 2
PRF Group A A preoperative panoramic radiograph showing badly decayed upper left 1st premolar. B A photograph showing badly decayed upper left 1st premolar. C Extraction socket after flap reflection. D Tooth after atraumatic extraction
Fig. 3 Surgical procedures
Following administration of local anesthesia (Mepivacaine HCL 2% with Levonordefrin 1:20,000. Alexandria Co. for Pharmaceuiticals and Chemical Ind., Alexandria, Egypt.), a three-line incision was made, and the mucoperiosteal flap was reflected. Atraumatic extraction of the tooth/root was then initiated by using a periotome (Helmut Zeph, Medizintechnik GMBH, Seitingen-Oberflacht, Germany) to sever the periodontal ligament attachments and preserve the socket walls followed by using suitable extraction forceps (Figs. 2B, C, D and 6B). After tooth extraction, the socket was checked for the integrity of its four walls. If the buccal bone was fractured during the extraction or there was fenestration/dehiscences, the patient was excluded from the study. To remove any granulation tissue that might have been there, the socket underwent a cautious, thorough curettage. For tension-free primary closure, a periosteal release incision was made.
The final decision regarding the size of the implant was made after assessing the dimensions of the socket. Drilling was done in the right direction at 600 to 800 rpm. Depending on the implant size, sequential drilling with abundant irrigation was done until the ideal dimensions were achieved. The sterile implant package was opened, and with gentle, steady finger pressure, the implant was placed in its proper location with a manual ratchet (40 Ncm of torque) (Figs. 4A and 5A). In order to achieve primary stability, the implant was installed 2–3 mm beyond the apex and 1–2 mm below the alveolar crestal bone.
Fig. 4
PRF Group. A Immediately placed implant with horizontal critical-sized gap. B PRF after filling the gap around the dental implant. C The collagen membrane after its application. D The complete gingival healing after 1 month. E An immediate postoperative cross-sectional CBCT image. F A cross-sectional CBCT image taken 18 months postoperative
Fig. 5
Xenograft Group A Palatally positioned dental implant following tooth extraction. B Xenograft filling the jumping gap. C The collagen membrane after its application over Xenograft. D A cross-sectional CBCT image taken 18 months postoperative
The implants used in this study were double-threaded, two-piece, tapered body titanium dental implants with SLA surface. (Dentium® System, Superline, Seoul, Korea.)
After implant placement, the buccal jumping gap was measured using periodontal probe to make sure that the distance from the implant surface and the buccal plat was more than 2 mm.
RFA was used to test implant stability with an Osstell Mentor device. (Osstell, Integration Diagnostics, Savadaled, Sweden). The smart peg (type 7) was attached to the dental implant. The outcomes were presented as the implant stability quotient (ISQ).
The buccal jumping gap in Group 1 was packed using PRF. Platelet-rich fibrin preparation, around 5–10 ml of whole venous blood was collected in each of the two sterile vacutainer tubes without anticoagulant. The vacutainer tubes were then placed in a centrifugal machine (Laboratory Centrifuge, Jiangsu, China) at 3000 rpm (800 gm) for 10 min, after which it settled into the following layers: red lower fraction containing red blood cells, upper straw coloured cellular plasma and the middle fraction containing the fibrin clot. The upper straw coloured layer was then removed and middle fraction was collected, 2 mm below lower dividing line, which was the PRF [23] (Fig. 3). The gap between the walls of the socket and the dental implant was filled with PRF, which was delicately placed and compressed around the implant (Fig. 4B). For Group 2, the buccal jumping gap was packed using Xenograft (Creos xenogain®, Nobel Biocare, Zürich-Flughafen, Switzerland) (Fig. 5B), while for Group 3, the buccal jumping gap was packed using Alloplastic β-tricalcium phosphate (R.T.R Syringe, β-TCP Synthetic granules, Septodont, France.).
Fig. 6
Alloplast Group. A The preoperative panoramic radiograph showing horizontal root fracture of upper right central tooth. B The tooth after extraction. C The collagen membrane after its application. D The primary closure of the flap. E An immediate postoperative cross-sectional image of CBCT. F A cross-sectional CBCT image taken 18 months postoperative.
The next step was to open the sealed package of the collagen membrane (Dentium® System, Resorbable membrane, Korea). The membrane was then trimmed to the size needed by the case. Care was taken to apply the membrane without wrinkling or buckling (Figs. 4C, 5C and 6C). Following the repositioning of the mucoperiosteal flap, the primary closure was completed with both mattress and interrupted 4/0 sutures (Figs. 4D and 6D). CBCT radiograph was taken to verify the final position of the implant.
Postoperative careFor seven days, 500 mg of Amoxicillin (Emox, Egyption Int. Pharmaceutical Industries Co., E.I.P.I.C.O., A.R.E.) was used as an oral antibiotic every six hours. A non-steriodal analgesic and anti-inflammatory medication called Diclofenac Potassium 50 mg tablets (Oflam, Mepha Pharma Egypt S.A.E.) was prescribed. Patients were advised to avoid chewing solid food, and to maintain good oral hygiene with Chlorohexidine HCl (0.12%) (Hexitol, the Arab Drug Company, Cairo, A.R.E.). Then, after one week, the sutures were removed.
Second stage surgerySix months later, a second stage surgery was carried out. The surgical cover screw was exposed and replaced by a healing abutment for 15 days.
Prosthetic rehabilitationTo create a working cast, an impression was made using an impression post and a laboratory analogue. Then the functional abutment replaced the healing abutment. Final restoration was made from porcelain fused to metal and cemented to the functional abutment.
EvaluationEvery patient was seen on a regular basis for evaluation immediate, 6 and 18 months postoperative.
A. Clinical evaluation 1. Implant stabilityAt the time of implant placement, 6 months and 18 months postoperative, implant stability was measured. RFA was used to measure implant stability with an Osstell Mentor device. The outcomes were presented as ISQ.
2. Peri-implant pocket depthA graduated probe was used to measure the distance between the base of the pocket and the gingival margin. The probe was introduced until its blunt edge made contact with the base of the pocket in a straight line with the implant's vertical axis. Around each implant, the pocket depth was measured at 4 different sites (mesial, buccal, distal and palatal). Measurements were taken and recorded to the nearest 0.5 mm.
B. Radiographic evaluationCBCT was used to provide radiographic evaluation immediately, 6, and 18 months postoperative. All CBCT scans were performed in the same radiology centre (Planmeca, ProMax® 3D Max, Helsinki, Finland) using the same parameters (89 kVp, 24 s, 10 mA and field of view 6 cm × 8 cm). For image processing and reconstruction, OnDemand3D was used.
1. Radiographic assessment of marginal bone lossThe implant was utilized as a reference for the measurement of marginal bone loss (MBL) from the cross-sectional view by adjusting panoramic long axis in its center and bisecting it (showing the buccolingual dimensions).
At the crest of the buccal plate of bone and ending at the apical level of the implant, a line was drawn directly parallel to the implant, and its height was measured in millimeters immediately, 6 months and 18 months postoperative. The measurement of the bone level at implant placement was considered as baseline. Radiographic MBL was calculated as the difference between the reading at 6 and 18 months postoperative and the baseline value.24 The same process was repeated from the palatal direction (Figs. 4E, F, 5D, 6E and F).
2. Radiographic assessment of changes in buccal bone thicknessA perpendicular horizontal measurement was taken from the implant crest to the buccal bone plate immediately postoperative. This measurement acts as a baseline. A similar measurement was taken 18 months postoperative and subtracted from baseline value to determine horizontal bone loss.25 (Fig. 4E, F, 5D, 6E and F).
Statistical analysisSPSS software, version 25 was used to analyze the data (SPSS Inc., PASW statistics for windows version 25. Chicago: SPSS Inc.). Quantitative data were described using mean ± standard deviation for normally distributed data after testing normality using Shapiro Wilk test. To compare more than two independent groups, the One Way ANOVA test was performed, and the Post Hoc Tukey test was utilized to identify pairwise comparisons. Significance of the obtained results was judged at the (≤ 0.05) level.
Comments (0)