
記住我

Hematopoiesis is a finely tuned developmental process regulated by cell-intrinsic (epigenetic, gene transcription) and extrinsic (cytokines, chemokines, and growth factors) mechanisms/molecules.1,2 Signals generated by Stem cell factor (Scf)-cKit axis3 and Erythropoietin-Receptor (EPO-R)4 are fundamental for hematopoietic stem/progenitor cell (HSPC) growth and for red blood cell (RBC) production, respectively, through the activation of shared pathways, such as ERK/MAP kinases, JAK/STAT and PI3K/AKT signaling cascades. The EPO-R signaling culminates in the activation of the transcription factor GATA14–6 which sustains erythroid cell viability,6,7 the switching from embryonic/fetal to adult globin chains,8 heme biosynthesis9 and supports also its own and Epo-R10 transcription.
Protein kinase CK2 is a Ser/Thr kinase constituted by a tetramer of 2 catalytic (α or α’)11 and 2 regulatory (β) subunits, with CK2β being essential for the assembly of the kinase in a tetramer and for the selection of phospho-targets.12 However, the α and β subunits exert also functions independently from the holoenzyme12 and, importantly, free β dimers can bind and stabilize other proteins.13 CK2 is involved in cell proliferation, resistance to stress, as well as many other processes.14 One main property of CK2 is to sustain cell viability, hampering apoptosis by inhibiting procaspase-2 and caspase 8 and regulating BCL-2 family members.15 In particular, CK2 prevents the activation of pro-apoptotic BID and enhances the expression of anti-apoptotic BCL-XL.16 In addition, this kinase positively regulates survival pathways, such as NF-κB (in which it activates p65/RelA through phosphorylation in S52917 and enhances IκBα18 degradation and PI3K/AKT (through the inhibition of the phosphatase PTEN19 and the activation of AKT20,21). We and others have demonstrated that CK2 is essential for acute myeloid leukemia (AML) and AML-derived leukemic stem cells,22,23 multiple myeloma24–26 and non-Hodgkin B cell lymphoma27–30 cell survival, proliferation, and resistance to several intrinsic and extrinsic stresses.31
Since literature has also widely reported the key role of CK2 in embryogenesis,32–34 we hypothesized that this kinase might also be essential for the ontogenesis of blood cells. In a recent article published by our group, we have demonstrated the importance of CK2 in B cell commitment towards follicular fate and in the germinal center reaction using mice bearing loxP-flanked CK2β alleles and expressing the Cre recombinase under the control of the CD19 promoter.35 In the present work, we crossed the same model of loxP mice with animals expressing the Cre recombinase under the control of the Vav1 promoter, thereby achieving CK2β KO in all the hematopoietic cells. We focused the analysis on the HSPC and erythroid compartments.
CK2β KO during hematopoiesis dramatically affected mouse HSPC numbers and function ex vivo and in vivo. Mechanistically, we provided evidence that CK2β influences the expression of multiple transcription factors implicated in HSPC biology. Also, by exploiting an in vitro model of erythroid differentiation, we showed that CK2β is an essential stage-specific regulator of RBC differentiation, proliferation, and viability and we unraveled a molecular crosstalk between this kinase and the transcription factor GATA1.
METHODS MiceC57BL/6 VAV1-CRE mice were purchased from Jackson Laboratory, C57BL/6 Csnk2b 2loxP mice were described in,34 C57BL/6 LY5.1 (CD45.1) mice were purchased from Charles River. Mice were kept in a pathogen-free colony at the animal facility of the Veneto Institute of Molecular Medicine, Padova, Italy. The University of Padova organization in charge for animal wellness approved the experimentation and declared that it fulfilled the National and European rules for animal studies. All the experimental procedures were authorized by the Italian Ministry of Health (Protocol N° 126-2015 and 205/2022-PR). For details on mice breeding, genotyping, and sample processing, see Suppl. Materials and Methods.
Repopulation assayIn competitive transplantation, CD45.1 mice were used both as recipient and competitor cells. Females, in synchronized gestations, were sacrificed at 14.5dpc; mixtures of equal amounts (1x10⁶ cells) of donor (either Vav1+/Cre control or Csnk2bfl/fl/Vav1+/Cre KO from CD45.2+ genetic background) and wild-type competitor (CD45.1+) total fetal liver cells were intravenously injected in lethally γ-irradiated (900rad) CD45.1+ recipient mice. In non-competitive transplantation assay, CD45.1 recipient mice were injected only with (1 × 10⁶ cells) CD45.2+ cells from either Vav1+/Cre control or Csnk2bfl/fl/Vav1+/Cre KO. Engraftment was assessed at 13/14 days for both experimental assays and after 1 month for competitive experiments in PB, BM, Spleen, Thymus, and Lymph Nodes. Repopulation efficiency of donor and competitor populations was investigated through fluorescence activated cell sorting (FACS) analysis after staining of PB or smashed hematopoietic tissues with Fc Block, anti-CD45.1, and anti-CD45.2 antibodies followed by erythrocyte cell lysis.
Cell culture and chemicalsG1E-ER cells, a kind gift of Prof. M. Weiss (St. Jude Childrens’ Hospital, Memphis, TN) were maintained as described in.36 Erythropoietin and 1-Thioglycerol were purchased from Sigma (Mo), SCF from Peprotec (UK). For cell treatment, β-estradiol (Merck) was used at 0.2 µM, CX-4945 (Activate Scientific GmbH) at 2.5 µM, Z-VAD-FMK (SelleckChem) caspase inhibitor at 5 µM, proteasome inhibitor bortezomib (SelleckChem) at 5 nM and cycloheximide (Merck) at 0.4 µg/ml.
RNA-SeqThe sequencing was performed on TER119+ cells purified from 14.5 dpc fetal livers by FACS sorting. The complete RNA-Seq data are available in the Gene Expression Omnibus (GEO) (http://www.ncbi.nlm.nih.gov/geo) under accession number GSE158665. For the complete list of differently expressed genes see Suppl. Tables S1 and S2. For further details on the analysis methods, see SDC file.
Statistical analysisData were analyzed with the 2-tailed unpaired Student’s t-test. Values were considered statistically significant at P values below *0.05, **0.01, ***0.001.
For further Materials and Methods, see the Supplemental Digital Content file.
Data availabilityAll data required to produce the results of this study are provided within the article, via supplemental files or with link to the dataset GEO with the accession number. Also included in supplemental file Suppl. Tables S3 - S7 reporting in order: list of primers for genotyping, qRT-PCR primers, antibodies for WB and flow cytometry, hemochrome of adult mice.
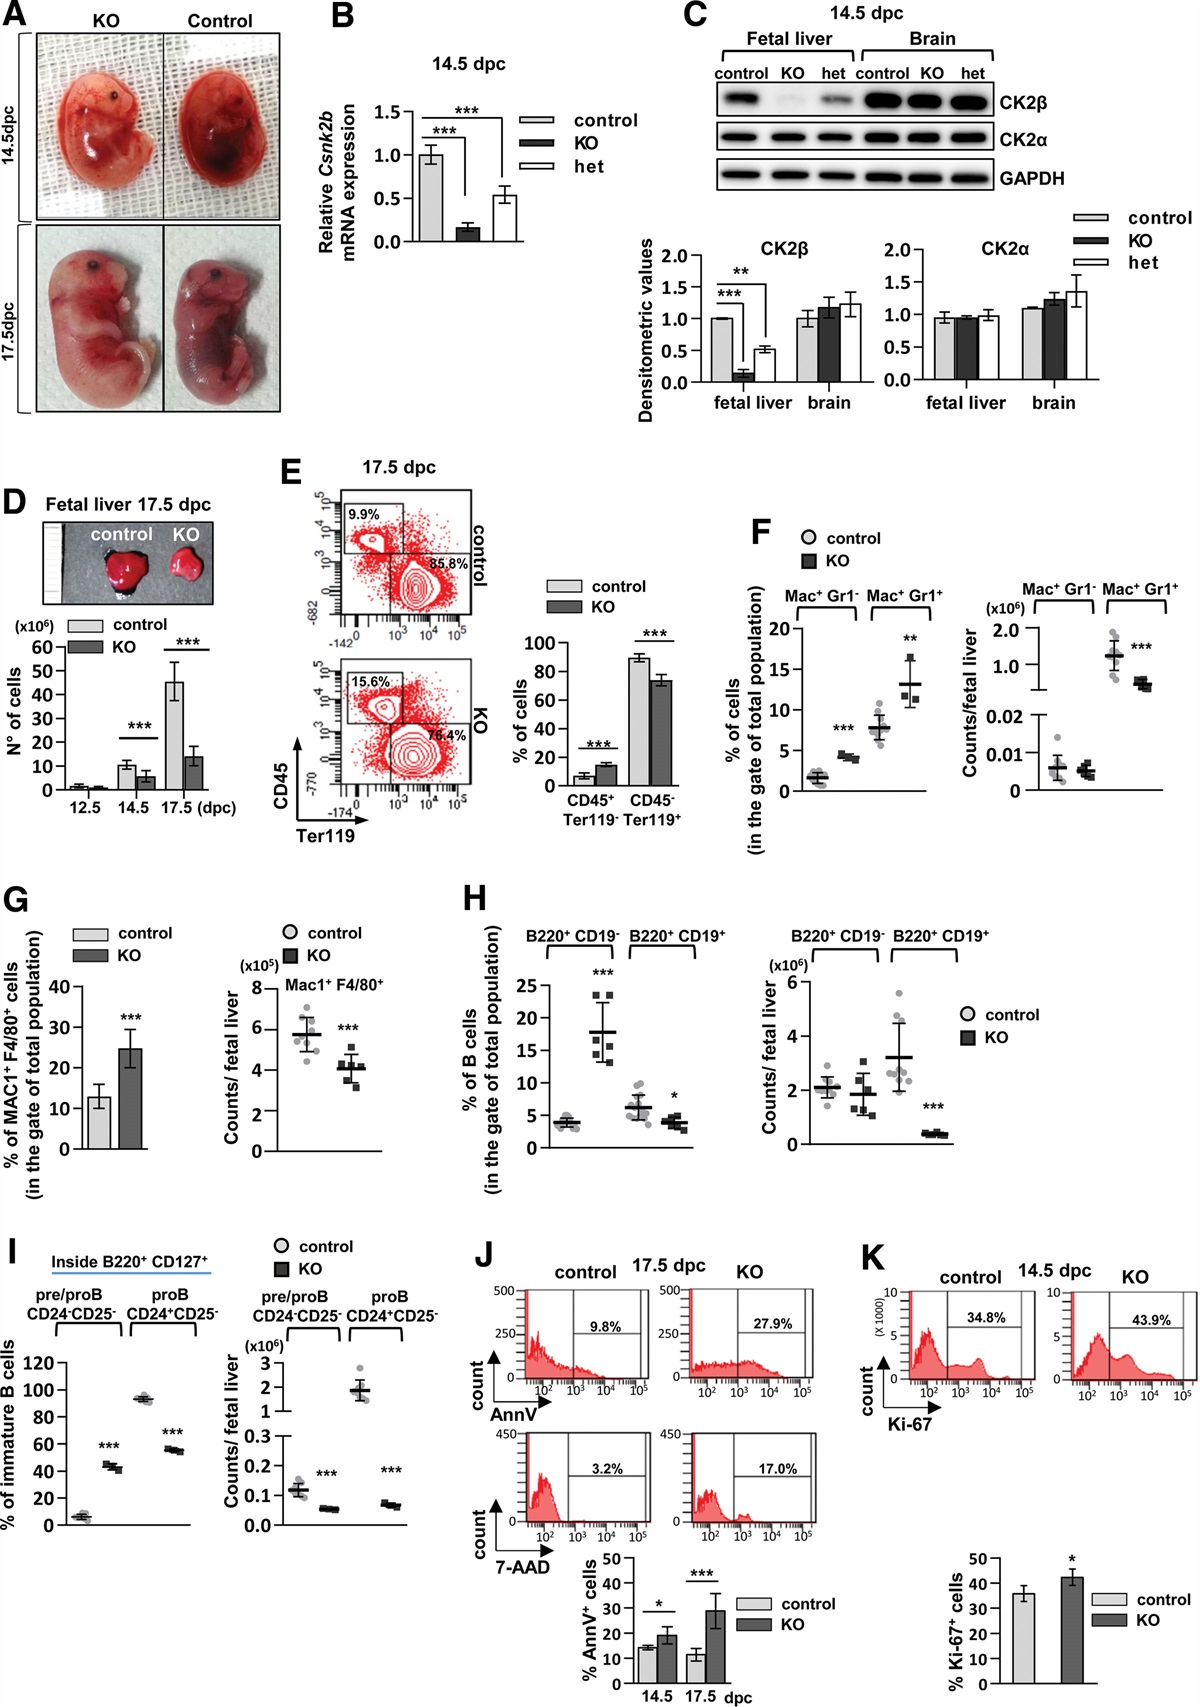
RESULTS CK2β loss in the hematopoietic compartment is embryonic lethal and alters hematopoietic cell number, viability, and proliferationWe generated conditional CK2β-deficient mice in Vav1-expressing cells. In utero lethality between 19.5 and 20.5 days post conception (dpc) was observed in 100% of CK2β KO embryos (Csnk2bfl/fl;Vav1+/Cre). Control mice (Csnk2b+/+;Vav1+/Cre) and CK2β heterozygous mice (Csnk2b+/fl;Vav1+/Cre) were viable and fertile. We therefore analyzed fetuses at 12.5, 14.5, and 17.5 dpc. CK2β KO fetuses were pale and hemorrhagic, in some cases with the appearance of hydrops fetalis, more evident at 17.5 dpc (Figure 1A). Analysis of CK2β mRNA (Figure 1B) and protein levels (Figure 1C) in the fetal liver, primary site of hematopoiesis at this stage,37 and in the brain from 14.5 dpc fetuses showed complete Csnk2b deletion restricted to the hematopoietic tissue. No significant changes were observed in CK2α protein levels (Figure 1C). CK2β-null embryos displayed smaller fetal livers with reduced cellularity as compared to controls (Figure 1D). FACS analysis of the CD45+ (leukocyte) and Ter119+ (erythroid) markers showed a reduction in the percentage of erythroid cells in the CK2β KO mice, while the percentage of leukocytes appeared slightly increased as compared to control littermates (Figure 1E). A deepened analysis of the white cell compartment revealed an accumulation in percentages of granulocytes and monocytes/macrophages in CK2β KO embryos (Figure 1F and 1G, left panels) that could account for the increased frequency of CD45+ cells; however, the absolute counts of Mac1+Gr1+ and Mac+F4/80+ populations in total fetal livers resulted to be reduced in the KO samples compared to the control ones (Figure 1F and 1G, right panels). Moreover, also the B cell compartment was altered in CK2β KO mice with accumulation in percentages of immature B cells (B220+ CD19-) (Figure 1H, left panel) and expansion of pre/pro B cells (Figure 1I, left panel). Also in this case the counts in the total fetal livers show discrepancies compared to the frequencies due to the reduced global cellularity of livers in KO embryos; indeed, there were no significant changes in B220+ CD19- absolute numbers (Figure 1H, right panel) and there was a decrease of pre/pro cells in KO embryos (Figure 1I, right panel). Annexin V (AnnV) and 7-Aminoactinomycin D (7-AAD) staining revealed a higher percentage of apoptotic cells in CK2β KO fetal livers that became more evident at 17.5 dpc (Figure 1J). However, analysis of Ki-67 expression showed a mild increase in cell proliferation in CK2β KO compared to control mice (Figure 1K).
 Figure 1.:
 KO of CK2β in the fetal hematopoietic system results in embryonic lethality with reduction in fetal liver cellularity and alteration in cell viability and proliferation. (A) Pictures of Csnk2b fl/fl/Vav1 +/Cre (KO) and Csnk2b +/+/Vav1 +/Cre (control) littermate fetuses at 14.5 and 17.5 days post conception (dpc). (B) Csnk2b mRNA levels evaluated by qRT-PCR at 14.5 dpc in control and KO fetal livers. Data are representative of 5 samples for each genotype. Gapdh was used as reference gene. (C) WB analysis of CK2β and CK2α protein expression at 14.5 dpc in fetal liver cells compared to non-hematopoietic tissue (brain); upper panel: WB image representative of 4 samples for each genotype; lower panel: densitometric analysis; GAPDH was used as loading control. (D) Upper level: representative image of control and KO fetal livers at 17.5 dpc; lower level: fetal liver cell count at different development time points (12.5 dpc: controls n = 9, KO n = 6; 14.5 dpc controls n = 17, KO n = 18; 17.5 dpc: controls n = 18, KO n = 21). (E) FACS analysis of the white population (CD45+) and erythroid cells (Ter119+) in fetal livers at 17.5 dpc: on the left representative contour plot, on the right histograms displaying the percentages of the 2 hematopoietic compartments (controls n = 8; KO n = 3). (F) Scatter plots representing percentages of cells (on the left; controls n = 11, KO n = 3) or absolute counts (on the right; controls n = 10, KO n = 6) after Gr1 and Mac1 staining and FACS analysis in 17.5dpc fetal livers. (G) FACS analysis of macrophages (Mac1+F4/80+) in 17.5 dpc fetal livers represented as percentage on the left (controls n = 3, KO n = 3) and as absolute counts on the right (controls n = 9, KO n = 6). (H) Graphs indicating the percentages (on the left) (controls n = 15, KO n = 6) and absolute counts (on the right) (controls n = 10, KO n = 6) of B cells in 17.5dpc fetal livers. (I) FACS analysis of precursors B cells in 17.5 dpc fetal livers: graphs indicating the percentages (on the left) and absolute counts (on the right) (controls n = 8, KO n = 3). (J) Evaluation of apoptosis at 14.5 and 17.5 dpc by FACS analysis, after staining with Annexin V (AnnV) and 7-AAD, performed on total liver population (at 14.5 dpc controls n = 4, KO n = 5; at 17.5 dpc controls n = 20, KO n = 6). (K) Analysis of Ki-67 expression in 14.5dpc total liver cells (controls n = 5, KO n = 3). In (C–K), graphs show means ± SD; Student’s t-test: *P < 0.05; **P < 0.01; ***P < 0.001. FACS = fluorescence activated cell sorting; KO = knockout; WB = western blot.
Deletion of CK2β affects hematopoietic stem and progenitor cell proliferation kinetics and transcriptional programsNext, we analyzed the immature hematopoietic compartment represented by stem (HSC) and progenitor cells (HPCs) evaluating the effects of Csnk2b ablation. FACS analysis of HSCs38 and HPCs39 revealed a significant increase in the percentages of HSCs (Lin- cKit+ Sca-1+ CD150+ CD48-) (Figure 2A and 2D), MEPS (Lin- cKit+ Sca-1- CD34- FcyRIII/II-), CMPs (Lin- cKit+ Sca-1- CD34+ FcyRIII/IIlow) and GMPs (Lin- cKit+ Sca-1- CD34+ FcyRIII/IIhigh) (Figure 2B and 2D) in KO fetal livers compared to controls with no significant changes in CLPs (Lin- IL-7R+ cKit+ Sca-1-/low) (Figure 2C and 2D). However, analysis of absolute counts in the total fetal livers confirmed in the KO samples a significant expansion limited to the LSK compartment and a trend to higher counts for GMPs (Figure 2E). Notably, the intensity of cKit expression, a receptor essential for HSC and precursor survival and self-renewal, was found substantially reduced (mean fluorescence intensity, MFI) in CK2β KO HSPCs (Figure 2F).
 Figure 2.:
 Absence of CK2β increases the amount of hematopoietic stem cells and precursors and perturbs their maturation program. Representative FACS dot plot of hematopoietic stem cells (HSCs) (A), common myeloid progenitors (CMPs), megakaryocyte/erythrocyte progenitors (MEPs), granulocyte/monocyte progenitors (GMPs) in 14.5 dpc fetal livers (B), common lymphoid progenitors (CLPs) (C); the representative dot plots show the percentage of cells; 1x10⁶ and at least 4 × 10⁵ events were acquired for LT-HSCs and the other progenitors respectively. (D) Histogram summarizing the percentages of each population (for HSC controls n = 5, KO n = 4; for the other precursors: controls n = 9, KO n = 6). (E) Graphs representing absolute cell counts of LSK, MEPs, CMPs, and GMPs populations referred to the total fetal liver (controls n = 3, KO n = 3). (F) Histograms exhibiting mean fluorescence intensity (MFI) in HSCs and each precursor sub-population (controls n = 9, KO n = 6). (G) BrdU proliferation assay in 14.5 dpc fetal livers cells: cell cycle was analyzed inside the LSK (Lin-Sca-1+cKit+) fraction after staining with anti-BrdU and 7-AAD. Left panel: representative contour plots and gating strategy; right panel: histograms summarizing the percentages of the cells in each stage (controls n = 4, KO n = 4). (H) qRT-PCR showing the relative mRNA expression of Scl/Tal1, Bmi-1, Runx1, Jun, Pu.1, Cebpa, Gata1, Gata2 genes in HSCs (controls n = 3, KO n = 3), CMPs (controls n = 4, KO n = 5), GMPs (controls n = 4, KO n = 5) and MEPs (controls n = 4, KO n = 5) purified through sorting from 14.5dpc fetal livers. Gapdh was used as reference gene. In all panels (D–H) the graphs report mean ± SD values; Student’s t-test: *P < 0.05; **P < 0.01; ***P < 0.001. CLPs = common lymphoid progenitors; CMPs = common myeloid progenitors; FACS = fluorescence activated cell sorting; GMPs = granulocyte/monocyte progenitors; HSCs = hematopoietic stem cells; KO = knockout; LSK = Lin-Kit+Sca1+; MEPs = megakaryocyte/erythrocyte progenitors.
Since during blood cell development proliferation and differentiation must be tightly coordinated, we analyzed the cell cycle of LSK cells, using BrdU and 7-AAD staining and FACS analysis. As shown in Figure 2G, a higher percentage of cells was in G2/M, S, and sub-G0 phases and displayed a greater DNA content (gate >2n) in KO mice compared to controls.
We next inquired if CK2β loss could affect the expression of transcription factors important for HSC and HPC early lineage commitment. By qRT-PCR we evaluated the expression of specific mRNAs coding for transcription factors involved in cell maturation (Gata1,5,40Jun41) or in the maintenance of stem cell quiescence and self-renewal (Scl/Tal1,42Bmi-1,43Runx1,44,45Pu.1,46Cebpa,47Gata248), in FACS-sorted LSKs, CMPs, GMPs and MEPs (Figure 2H). In CK2β KO embryos, the LSK compartment exhibited a reduced expression of Scl/Tal1 and Pu.1 with no significant changes in Bmi-1 and Runx1 mRNA levels compared to controls. Loss of CK2β caused a decrease of Runx.1, Pu.1 and Cepba expression in CMPs and a decrease of Cebpa and Gata1 in GMPs. MEPs from KO mice showed alterations in almost all the genes analyzed with a significant reduction of Scl/Tal1, Bmi-1, Runx1, and Gata1 and an increase of Jun expression.
In summary, lack of CK2β causes an accumulation and increased proliferation of HSCs and an altered expression of transcription factors involved in the regulation of HSPC quiescence and commitment.
CK2β is essential for hematopoietic reconstitution capability in vitro and in vivoTo assess the differentiative potential of progenitors, we performed methylcellulose-based colony-forming assays of fetal liver HSPCs. Strikingly, KO cells displayed an impairment to generate erythroid and myeloid colonies at 3 and 6 days (Suppl. Figures S1A and S1B). In vivo competitive repopulation assays of 14.5 dpc fetal liver cell transplanted in C57BL/6 congenic mice expressing the differential leukocyte marker CD45.1 were then performed (Figure 3A).49,50 As summarized in Table 1, an almost complete restoration of hematopoiesis was obtained as early as 2 weeks after transplantation with comparable blood cell percentages between mice injected with both kinds of cell mix. To note, FACS analysis of peripheral blood revealed an equal contribution to hematopoiesis when control CD45.2+ and competitor CD45.1+ donor cells were injected, while the injection of CK2β KO CD45.2+ did not contribute to mature blood cells (Figure 3B). The same phenotype was observed after 4 weeks in all the hemo-lymphopoietic organs (Figure 3B–3D). We also evaluated the contribution to the generation of LSK and HSCs from CD45.1+ and CD45.2+ cell populations. Remarkably, in recipient mice injected with the competitive KO transplant there was a complete absence of CD45.2 expression both in LSK (Figure 3E) and in HSCs (CD48-CD150+ in LSK gated cells)51 (Figure 3F). Since the lack of engraftment in the BM could be linked to a problem of homing of HSCs, we evaluated by FACS the expression of CXCR4 (a known key mediator of HSC homing to the bone marrow52) in LSK compartment of control and CK2β KO fetal livers (Figure 3G). Unexpectedly, CK2β KO embryos showed higher percentages of CXCR4+ LSK cells and higher MFI of this marker as compared to control counterpart, suggesting that the observed phenotype is likely not dependent on this molecule. To exclude the possibility that the lack of KO cell engraftment was due to the inability of CD45.2+ CK2β null LSK to compete with CD45.1 cells for the BM niches, we also performed non-competitive transplantation assays. As described in Suppl. Figure S1C, CD45.1 adult mice were irradiated and injected with only CD45.2 cells from control or KO fetal livers; 2 out of 5 mice injected with CK2β null CD45.2+ cells died at day 12, thus we anticipated the experimental end point at 13 days. In all the compartments analyzed (SP, BM, and spleen) we evidenced almost the complete absence of CD45.2 cells from KO samples (Suppl. Figure S1D). Moreover, analysis of CD45.2+ LSK frequencies and events in the BM (Suppl. Figure S1E) underlined that CK2β KO progenitors and stem cells were unable to engraft and sustain hematopoiesis.
Table 1 - Hemochrome of Transplanted Mice Parameters 2 wks 4 wks CTRL KO CTRL KO WBC (103/µL) 2.87 ± 0.70 2.60 ± 0.35 9.83 ± 1.53 7.17 ± 1.24** RBC (106/µL) 10.12 ± 0.32 8.11 ± 1.73 12.00 ± 1.87 10.80 ± 0.67 HGB (g/dL) 15.00 ± 0.53 11.80 ± 3.12 15.87 ± 2.13 14.73 ± 0.86 HCT (%) 42.33 ± 1.62 34.67 ± 9.27 49.30 ± 7.75 44.77 ± 2.78 MCV (fL) 41.90 ± 0.92 42.40 ± 3.00 41.05 ± 0.28 41.43 ± 0.29* PLT (103/µL) 1062.00 ± 419.24 650.00 ± 68.79 1842.67 ± 152.39 1764.00 ± 151.61 MPV (fL) 7.00 ± 0.66 8.90 ± 1.10 5.07 ± 0.38 5.07 ± 0.38 LYM% 51.73 ± 8.35 61.03 ± 3.65 75.80 ± 5.36 70.85 ± 5.59 MID% 10.07 ± 1.79 6.73 ± 1.94 9.55 ± 0.94 12.27 ± 2.37* GRA% 38.20 ± 6.56 32.23 ± 2.40 14.65 ± 5.99 16.88 ± 3.46*P < 0.05;
**P < 0.01 compared to mice injected with cells from control embryos.
CTRL = controls; GRA = granulocytes; HCT = hematocrit; HGB = hemoglobin; KO = knockout; LYM = lymphocytes; MCV = mean corpuscolar volume; MID = monocytes; MPV = mean platelet volume; PLT = platelets; RBC = red blood cell; WBC = white blood cell.
 Figure 3.:
 Fetal liver cell transplantation from KO fetuses in recipient adult mice results in the lack of hematopoietic reconstitution. (A) Transplant workflow: a mixed population with equal proportions of CD45.2 (donor from control or KO) and CD45.1 (competitor) fetal liver cells were injected in recipient CD45.1 adult mice after lethal total body irradiation (900 rads). The transplantation with CD45.2 cells from control embryos plus CD45.1 competitor cells is indicated as Mix Control; when CD45.2 cells were obtained from CK2β-null embryos plus CD45.1 competitor cells, the injected population is called Mix KO. Hematopoietic restoration was assessed at 2 and 4 weeks from irradiation. Injection of PBS was used as control of irradiation efficacy. Sample size: 7 mice injected with mix control, 7 with mix KO, and 2 with PBS. (B–F) Flow cytometry analysis of CD45.2 and CD45.1 relative amounts in (B) peripheral blood (PB), (C) bone marrow (BM), spleen (SP), and (D) lymph nodes and thymus, (E) inside the gate of LSK and (F) inside long term HSCs. On the left of each figure are depicted the representative dot plots and on the right are the histograms with CD45.1 and CD45.2; (G) Flow cytometry analysis of CXCR4 expression in 14.5 dpc fetal livers; upper panel: representative dot plots; lower panel: histograms representing the percentages and mean fluorescence intensities (controls n = 5, KO n = 3). Data in the graphs (B–G) are shown as mean ± SD, Student’s t-test: *P < 0.05, **P < 0.01, ***P < 0.001 comparing donor CD45.2 vs competitor CD45.1; °°P < 0.01, °°°P < 0.001 comparing CD45.1 population from KO mix vs that one of control mix; #P < 0.05, ##P < 0.01, ###P < 0.001 comparing CD45.2 population from KO mix vs that one of control mix. BM = bone marrow; HSCs = hematopoietic stem cells; KO = knockout; LSK = Lin-Kit+Sca1+; PB = peripheral blood; PBS = phosphate buffered saline; SP = spleen.
Erythropoiesis is defective in CK2β KO miceDeletion of CK2β in purified Ter119+ mature erythroid cells was complete (Figure 4A). The levels of the catalytic α subunit were found decreased and a CK2-specific kinase assay showed a 60% residual enzymatic activity (Figure 4A), likely attributable to the remaining α dimers. FACS analysis of CD71 and Ter119 markers in fetal livers at 14.5 and 17.5 dpc53,54 revealed that CK2β KO embryos had unbalanced frequencies of erythroid subfractions compared to control mice (Figure 4B). KO samples displayed accumulation of both CD71low/- Ter119- and CD71high Ter119- immature populations and, particularly at 17.5 dpc, depletion of the most mature Ter119+ CD71- fraction (Figure 4B, left and middle panels). Analysis on pellets of peripheral blood obtained from 17.5 dpc embryos confirmed a reduced amount of mature hemoglobinized cells in CK2β KO samples (Figure 4B). Furthermore, KO fetal liver cells presented a reduced expression of both Ter119 and CD71 (Figure 4B, right panels). Similarly to the HSPCs, the MFI of cKit expression was found reduced in CK2β-deficient CD71+Ter119-/low population mainly composed of CFU-E, BFU-E and pro-Erythroblasts (Figure 4C). Complete blood cell count analysis performed on peripheral blood of 17.5 dpc embryos pointed out a strong reduction of RBC counts in KO samples (Figure 4D). To further support the evidence of terminal erythroid maturation impairment, since the extrusion of the nucleus is one central step of erythrocyte production, we evaluated the amount of nucleated and anucleated erythroid cells within the gate of Ter119+ FSClow cells.55,56 The nuclear staining through Syto-16 tracker evidenced a higher percentage of nucleated cells (Syto-16+) with parallel reduction of enucleated cells (Syto-16-) in KO samples compared to controls (Figure 4E). Cytospin preparations of Ter119+ fetal liver cells (Figure 4F, upper panel) revealed dysplastic features with membrane irregularities and blebs (blue arrows) of immature erythroblasts in KO mice. Reticulocytes looked irregularly shaped with intracellular inclusions resembling in size and color (but not in number) the Howell-Jolly bodies (red arrows). Also, peripheral blood smears (Figure 4F, bottom panel) showed larger erythrocytes, which in some instances appeared swollen and vacuolized. Since these morphological alterations could rely on defects of red cell membrane properties, such as the ability to change shape under the effect of mechanical forces, we evaluated erythrocyte deformability capacity in 17.5 dpc embryos by means of an ektacytometer. As shown in Figure 4G, erythrocytes from peripheral blood of KO animals presented a significant reduction in the elongation index, thus less deformability, when they were exposed to a range of applied stress from 0.3 to 30 Pa.
 Figure 4.:
 Ablation of Csnk2b in the hematopoietic compartment causes ineffective erythropoiesis with red blood cell morphological alteration, impairment of cell viability, and unbalance in cell proliferation. (A) Top: WB analysis of CK2β and CK2α expression; bottom: CK2 kinase activity displayed as count per minute (CMP) in Ter119+ cells from 17.5 dpc fetal livers. (B) Study of erythroid maturation stages by FACS at 14.5 and 17.5 dpc, analyzing transferrin receptor (CD71) and glycophorin-associated protein Ter119. In detail: (B) left panel: representative dot plot with the gating strategy and sub-populations 1 (Ter119-CD71-/low), 2 (Ter119-CD71high), 3 (Ter119+CD71high) 4 (Ter119+CD71-/low) and representative pellets of peripheral blood samples from 17.5dpc embryos; middle panel: histograms summarizing percentages of each erythroid sub-population; right panel: peaks and graphs showing Ter119 and CD71 expression represented as mean intensity fluorescence (MFI). Sample size: n = 19 controls and 9 KO at 14.5 dpc; n = 20 controls and 6 KO at 17.5 dpc. (C) MFI of cKIT in the gate of Ter119-/low CD71+ cells (14.5dpc fetal livers; n = 16 controls and n = 7 KO). (D) Red blood cell counts (RBC) in the peripheral blood of 17.5 dpc embryos (n = 7 controls, n = 3 KO). (E) Evaluation of nucleated and enucleated erythroid cells through Syto-16 staining. Left, contour, and dot plots showing the gating strategy; right, graphs summarizing the percentages of nucleated (Syto-16+) and enucleated (Syto-16-) cells in control and KO erythroid cells. Sample size: n = 3 controls and n = 3 KO. (F) Upper panel: cytospin of Ter119+ cells purified from fetal livers; lower panel peripheral blood smears from 17.5 dpc fetuses. Samples stained with May-Grunwald Giemsa. Red arrows indicate cells with membrane blebs, and blue arrows indicate abnormal reticulocytes. Sample size: data are representative of 4 controls and 4 KO, at least 3 images were acquired for each sample. (G) Histogram representing the deformability of red blood cells in 17.5 embryos; test performed using Lorca ektacytometer on whole peripheral blood. Rigidity and plasticity are evaluated as Elongation Index (EI); deformability was assessed over a range of shear stresses between 0.3 and 30 Pa. Sample size: data are representative of 14 controls and 6 KO. Results were expressed as means ± SEM. Multiple t-tests were corrected with Holm-Sidak method: *P < 0.05, **P < 0.01, ***P < 0.001. (H) Evaluation of apoptosis at 14.5 and 17.5 dpc by flow cytometry analysis, after staining with Annexin V (AnnV) and 7-AAD; analysis was performed on erythroid sub-populations (CD71+Ter119-) and (Ter119+); top panel: representative dot plot, bottom panel: histograms showing cell percentages. Sample size: controls n = 8, KO n = 4 at 14.5 dpc; controls n = 9, KO n = 4 at 17.5 dpc. (I) WB of CASPASE-3, PARP, the anti-apoptotic BCL-xL, and the P53 downstream target P21 levels. Sample size: n = 4 controls and 4 KO at 14.5 dpc; 12 controls and 13 KO at 17.5 dpc). For BAX, MCL-1, and PUMA the sample size was composed of n = 3 controls and 3 KO at 14.5 dpc; n = 6 controls and 5 KO at 17.5 dpc. (J) Analysis of cell cycle stages in erythroid sub-populations after anti-BrdU and 7-AAD staining combined with Ter119/CD71 markers. Sample size: n = 6 controls and 5 KO. In (A–E) and (H–J), graphs report means ± SD. In (A) and (I) densitometric analysis, data were normalized over GAPDH and over the mean value of controls. Student’s t test: *P < 0.05,
留言 (0)