
Remember me

Relapsed/refractory (r/r) diffuse large B-cell lymphoma (DLBCL) poses a challenge in the clinical practice. Overall, 35%–40% of DLBCL patients are primary refractory or relapse following a first-line therapy.1 In recent years, chimeric antigen receptor (CAR)-T cell therapies targeting malignant lymphocytes by genetically modified autologous T cells expressing CD19-targeting CARs were introduced in the clinical practice.2,3 Currently, 3 CAR-T cell products are FDA licensed for r/r DLBCL: axi-cel (axicabtagene ciloleucel), liso-cel (lisocabtagene maraleucel), and tisa-cel (tisagenlecleucel).4–7 Treatment with axi-cel and liso-cel has achieved long-term remissions in about 40% of primary-refractory/early relapsed DLBCL patients following first-line therapy and both are approved in these settings.5,7 Tisa-cel is available for DLBCL patients relapsing after 2 preceding therapy lines.6
While an extensive expertise has been gathered in the field of CAR-T cell therapy and B-cell lymphoproliferative malignancies with systemic manifestations, still little is known regarding efficacy and side effects of CAR-T cell therapy in those patients presenting with central nervous system (CNS) disease.8–11
r/r DLBCL patients with CNS involvement represent an unmet clinical need. Commonly, high-dose methotrexate (MTX)-based and/or cytarabine (ARA-C)-based polychemotherapy penetrating the blood-brain barrier is administered. However, this therapy is accompanied by substantial side effects such as cytopenia, organ injuries (eg, kidney, liver, lung, mucosa), and leukoencephalopathy and efficacy is limited.12 Whole-brain radiotherapy represents another treatment option in this patient collective but is associated with relevant neurotoxicity occurring over a time course of months to years. By means of conventional immunochemotherapy, the outcomes remain poor with the median overall survival (OS) in secondary CNS lymphoma (SCNSL) accounting for 3.9 months only.13 Acknowledging the efficacy of CAR-T cell therapy in r/r patients with non-CNS DLBCL, the question arises whether this approach can be safely and effectively applied in r/r patients with CNS manifestations. Initially, patients with CNS manifestations were excluded from all pivotal CAR-T cell studies taking into consideration concerns about immune effector-cell–associated neurotoxicity syndrome (ICANS) and the capability of CAR-T cells to cross the CNS barrier. Thus, only few data exist regarding outcomes and toxicities of CAR-T cell therapy in patients with CNS manifestation. Within a recent phase 1/2 clinical trial with 12 relapsed patients with primary CNS lymphoma (PCNSL), tisa-cel resulted in a complete response (CR) rate of 50% being well-tolerated with no treatment-related deaths.14 In the previous study with liso-cel, 4 of 9 patients (44%) with SCNSL achieved an objective response post-CAR-T with low incidence of cytokine release syndrome (CRS) (1/9) and neurological events (1/9).15 Similarly, Ahmed et al. reported a CR rate of 85.7% among 7 patients with SCNSL who underwent CAR-T cell therapy. No grade 4 ICANS was reported in this subset of these patients.16 Along this line, CAR-T cells were shown to be able to cross the CNS barrier, as well as to expand and persist in CNS compartments.14,17,18
Aiming to further reveal the efficacy and toxicity of CAR-T cells in r/r DLBCL patients with CNS manifestation in a real-world setting, we analyzed all cases with CNS disease treated with CAR-T cells in our academic center. Furthermore, we compared the outcomes in CNS group with those receiving CAR-T cell therapy due to non-CNS B-cell malignancy.
METHODS Patient cohorts and study designThis retrospective study enrolled 80 consecutive r/r DLBCL patients with (n = 15) and without (n = 65) CNS manifestations treated with CAR-T cell therapy between January 2019 and August 2022 at the University Hospital/Inselspital, Bern, Switzerland. Both CAR-T cell products applied within this period in our center were considered: axi-cel and tisa-cel. Clinical data were gathered from the medical records, electronic patient files, and electronic database and supplemented by additional patient-related documents. The patients included in the analysis were divided into 2 cohorts for comparative analysis: with and without CNS involvement at the time point of CAR-T cell application. The study was approved by the local ethics committee (Kantonale Ethikkommission Bern, decision number 2022-00203 from May 4, 2022), and all patients signed informed consent and/or did not declare refusal to participate. All study procedures were performed in accordance with relevant guidelines, such as the Declaration of Helsinki, as well as local regulations.
Patient stratification, response assessment, infectious prophylaxis, and adverse event gradingPrevious to CAR-T cell administration, all patients received lymphodepleting chemotherapy with fludarabine (30 mg/m2 IV per day on days −5 to −3) and cyclophosphamide (300 mg/m2 IV on day −5 for tisa-cel; 500 mg/m2 IV on day −5 for axi-cel). CAR-T cell infusion was performed on day 0. Grading of CRS and ICANS was performed according to the American Society for Transplantation and Cellular Therapy consensus grading for CRS and ICANS.19 Response to CAR-T cell therapy was classified as CR, partial response (PR), stable disease, and progressive disease (PD). Overall response rate (ORR) was defined as the proportion of patients who achieved CR or PR, and complete response rate (CRR) as the proportion of patients with CR. CR for patients with synchronous (CNS and non-CNS) disease required CR for both CNS and non-CNS lesions. Response was assessed using common radiological criteria based on computer topographies and/or MRI performed 1 month after CAR-T cell infusion, as well as MRI and/or positron emission tomography and computed tomography performed 3, 6, and 12 months after CAR-T cell infusion.
Standard infectious prophylaxis was initiated irrespective of CNS disease status at the time of CAR-T cell therapy. Aciclovir (2 × 400 mg per day) and cotrimoxazole (2 × 960 mg twice a week or 3 × 960 mg per week) were mandatory for all CAR-T cell patients. Immunoglobulin replacement therapy was recommended for patients with serum IgG levels below 4 g/L and recurrent or severe infections. Primary prophylaxis with granulocyte colony-stimulating factors was administered if the absolute neutrophil count was decreasing below 1000/mm3. The use of antiepileptics was not used as a primary prophylaxis and was initiated only in symptomatic patients with CNS manifestations. The toxicity management guidelines were uniform irrespective of CNS manifestations. Particularly, there were no differences in management of CRS and/or ICANS such as timing of intervention with steroids and/or tocilizumab. Adverse events post-CAR-T cell therapy were assessed according to the recommendations of Common Terminology Criteria for Adverse Events (CTCAE), Version 5.0.20 Data cutoff for evaluation of outcomes was March 31, 2023.
Endpoints and statistical analysisThe primary end points of this study were ORR, progression-free survival (PFS), and OS in the CNS versus non-CNS cohorts. Secondary endpoints were incidence and severity of CRS and ICANS following CAR-T cell therapy in the CNS versus non-CNS cohorts.
For categorical data, Fisher exact test was used. The unpaired t test was applied for normally distributed metrical data. In case of not normally distributed metrical data, the Mann-Whitney U test was used. PFS and OS were analyzed by Kaplan-Meier method. For PFS calculations, events were defined as disease progression or death, whereas for OS death only was considered for event definition. P values less than 0.05 were considered significant. Descriptive statistics, Kaplan-Meier curves, the calculation of P values, and the creation of figures were conducted with GraphPad Prism 9.0.1 for Windows (GraphPad Software, San Diego, California, USA). Multivariable analysis was performed with R version 4.1.2.
RESULTS Patient baseline characteristicsPatient baseline characteristics are summarized in Table 1 for all patients and in detail in Suppl. Table S1 for those with CNS lymphoma. In total, 80 patients were included in the study. Of them, 15 (19%) had CNS (termed CNS group) and 65 (81%) had non-CNS manifestations only (non-CNS group). The frequency of secondary CNS manifestations (11/15, 73%) was significantly higher than primary CNS manifestations (4/15, 27%; 3 PCNSL, 1 DLBCL with synchronic peripheral and CNS manifestations) (P < 0.001). Parenchymal involvement was the most common CNS manifestation (15/15, 100%) followed by leptomeningeal (6/15, 40%) and central nerve lesions (3/15, 20%). The median time from diagnosis to CAR-T cell therapy was numerically shorter in the CNS group: 12 versus 24 months, P = 0.103. Otherwise, both cohorts were comparable regarding baseline clinical characteristics (gender, age, proportion of primary refractory patients, and those being refractory to the last treatment, Eastern Cooperative Oncology Group (ECOG) at CAR-T cell therapy) (Table 1). The median number of therapy lines before CAR-T cell treatment was 3 in both CNS and non-CNS groups (P = 0.631). In total, 6 of 15 patients (40%) from CNS group underwent MTX-containing prophylaxis of CNS relapse within first-line treatment: 4 with conventional triple intrathecal therapy (methotrexate/cytarabine/prednisone) and 2 with alternating intravenous MTX (Suppl. Table S1). Median time from indication of CAR-T cell therapy to treatment administration was similar among patients with CNS and non-CNS manifestations: 2.6 versus 2.5 months (P = 0.345).
Table 1. - Characteristics of Patients Preceding CAR-T Cell Therapy Parameters Pts with CNS Manifestation Pts without CNS Manifestation P Value All Patients Number of patients (%) 15 (19%) 65 (81%) - 80 (100%) Age (range) 61 (20–79) 68 (18–82) 0.670 63 (36–79) Gender, n (%) Male 8 (53%) 41 (63%) 0.513 49 (61%) Female 7 (47%) 24 (37%) 31 (39%) Diagnosis DLBCL in total, n (%) 15 (100%) 63 (97%) 0.057 78 (98%) -De novo 13 (87%) 36 (55%) 0.056 49 (61%) -PCNSL, n (%) 3 (20%) 0 (0%) 0.006 2 (3%) -PMBCL, n (%) 0 (0%) 2 (3%) 1.000 2 (3%) -Secondary 2 (13%) 28 (43%) 0.039 30 (38%) -Transformed FL 2 (17%) 18 (28%) 0.333 20 (25%) -Transformed MZL 0 (0%) 3 (5%) 1.000 3 (4%) -Transformed B-CLL/SLL 0 (0%) 5 (8%) 0.578 5 (6%) FL, n (%) 0 (0%) 2 (3%) 1.000 2 (3%) Description of CNS manifestation Primary CNS manifestation at diagnosis 4 (27%) - <0.001 - Secondary CNS manifestation at relapse/progress 15 (100%) - - - CNS sites affected Parenchymal lesions, n (%) 15 (100%) - - - Nerve lesions, n (%) 3 (20%) - - - Leptomeningeal, n (%) 6 (40%) - - - Median number of therapy lines before CAR-T, n (range) 3 (2–5) 3 (2–7) 0.631 3 (2–7) Prior autologous SCT, n (%) 9 (60%) 30 (46%) 0.398 39 (49%) Prior allogeneic SCT, n (%) 0 (0%) 0 (0%) - 0 (0%) Primary refractory, n (%) 9 (60%) 22 (34%) 0.080 31 (48%) Refractory to last treatment, n (%) 9 (60%) 46 (71%) 0.538 55 (69%) Median time from diagnosis to CAR-T, months (range) 12 (4–69) 24 (4–233) 0.103 19 (4–233) ECOG at CAR-T cell therapy (77/80 available) ECOG 0–2, n (%) 13 (87%) 57 (71%) 0.796 70 (88%) ECOG >2, n (%) 1 (7%) 6 (9%) - 7 (9 %) Time from CAR-T-indication to CAR-T cell therapy itself 2.6 (1–5) 2.5 (1–9) 0.345 3 (1–9)B-CLL/SLL = B-cell lymphocytic leukemia/small lymphocytic lymphoma; CAR-T = chimeric antigen receptor T cells; CNS = central nervous system; DLBCL = diffuse large B-cell lymphoma; ECOG = Eastern Cooperative Oncology Group; FL = follicular lymphoma; IPI = International Prognostic Index; MZL = marginal zone lymphoma; PCNSL = primary central nervous system lymphoma; PMBCL = primary mediastinal large B-cell lymphoma; Pts = patients; SCT = stem cell transplantation.
Disease features and characteristics of CAR-T cell therapy are presented in Table 2. Disease status before CAR-T cell therapy was most frequently PD and PR in both groups: 60% and 40% in the CNS group, and 45% and 42% in the non-CNS group, respectively (P > 0.05).
Table 2. - Disease Features and Characteristics of CAR-T Cell Therapy and Outcomes Among the Patients of the Study Parameters Pts with CNS Manifestation Pts without CNS Manifestation P Value All Patients Remission at CAR-T cell therapy, n (%) CR 0 (0%) 5 (8%) 0.580 5 (6%) PR 6 (40%) 27 (42%) 0.772 33 (41%) SD 0 (0%) 8 (12%) 0.347 8 (10%) PD 9 (60%) 29 (45%) 0.578 38 (48%) CAR-T cell product, n (%) All products 15 (100%) 65 (100%) 0.763 80 (100%) Axicabtagene ciloleucel (axi-cel) 4 (27%) 21 (32%) 0.764 25 (31%) Tisagenlecleucel (tisa-cel) 11 (73%) 44 (68%) 1.000 55 (69%) Cyclophosphamide/fludarabine lymphodepletion 15 (100%) 65 (100%) - 80 (100%) CRS after CAR-T cell therapy, n (%) Grade 0 1 (7%) 13 (20%) 0.450 14 (18%) Grade 1 9 (60%) 30 (46%) 0.400 39 (49%) Grade 2 4 (27%) 21 (32%) 0.766 25 (31%) Grade 3 1 (7%) 1 (2%) 0.342 2 (3%) Grade 4 0 (0%) 0 (0%) - 0 (0%) ICANS after CAR-T cell therapy, n (%) Grade 0 7 (47%) 46 (71%) 0.128 53 (66%) Grade 1 3 (20%) 4 (6%) 0.021 7 (9%) Grade 2 2 (13%) 6 (9%) 0.640 8 (10%) Grade 3 2 (13%) 6 (9%) 0.640 8 (10%) Grade 4 0 (0%) 4 (6%) 0.700 4 (5%) Treatment of CRS and/or ICANS, n (%) Steroids 11 (73%) 34 (52%) 0.161 45 (56%) Tocilizumab 11 (73%) 42 (65%) 0.763 53 (66%) Median time to best response, months (range) 1.1 (0.4–3.7) 2.7 (0.1–13.1) <0.001 2.7 (0.1–13.1) Detection of best response, n (%) CT 3 (20%) 19 (29%) - 22 (28%) MRI 11 (73%) 0 (0%) - 8 (10%) PET-CT 5 (33%) 44 (68%) - 49 (61%) CSF 1 (7%) 0 (0%) - 1 (1%) Bone marrow biopsy/MRD 0 (0%) 0 (0%) - 0 (0%) Best response after CAR-T cell therapy, n (%) Overall response rate (CR + PR), n (%) 12 (80%) 52 (80%) 1.000 64 (80%) CR 3 (20%) 27 (42%) 0.197 30 (38%) PR 9 (60%) 25 (38%) 0.310 34 (43%) SD 1 (7%) 0 (0%) 0.215 1 (1%) PD 2 (13%) 10 (15%) 1.000 12 (15%) Not available 0 (0%) 2 (3%) - 2 (3%) r/r disease following CAR-T cell therapy, n (%) 6 (40%) 27 (42%) 1.000 33 (41%) CNS lesions 3 (20%) 1 (2%) 0.020 4 (5%) Non-CNS lesions 2 (13%) 26 (40%) 0.071 28 (35%) CNS + non-CNS lesions 1 (7%) 0 (0%) 0.188 1 (1%) Median time to r/r disease following CAR-T cell therapy, months (range) 2.6 (1–9.1) 3.1 (0.4–27.3) 0.641 3.1 (0.4–27.3) Median time follow-up, months (range) 4.9 (1–39.5) 11.1 (0.1–44.9) <0.001 8.7 (0.1–44.9) Remission status at last follow-up, n (%) CR 4 (27%) 32 (50%) 0.310 36 (45%) PR 5 (33%) 12 (18%) 0.426 17 (21%) SD 1 (7%) 0 (0%) 0.342 1 (1%) r/r disease 6 (40%) 27 (42%) 1.000 33 (41%) Not available 0 (0%) 1 (2%) - 1 (1%) Survival status at last follow-up, n (%) Alive 7 (47%) 33 (51%) 1.000 40 (50%) Dead 8 (53%) 32 (49%) 40 (50%) Mortality reasons, n (%) r/r lymphoma 3 (20%) 16 (25%) 0.430 19 (24%) Not available 3 (20%) 4 (6%) 7 (9%) Nonlymphoma reasons 2 (13%) 12 (18%) 14 (18%) -Infection 1 (7%) 8 (12%) 9 (11%) -CRS/ICANS 0 (0%) 0 (0%) 0 (0%) -Thromboembolism 0 (0%) 2 (3%) 2 (3%) -Other reasons 1 (7%) 2 (3%) 3 (4%)CAR-T = chimeric antigen receptor T cells; CNS = central nervous system; CSF = cerebrospinal fluid; CR = complete remission; CRS = cytokine release syndrome; CT = computed tomography; ICANS = immune effector-cell–associated neurotoxicity syndrome; MRD = minimal residual disease; PD = progressive disease; PET-CT = positron emission tomography and computed tomography; PR = partial remission; Pts = patients; r/r = relapsed/refractory; SD = stable disease.
In the CNS group, 11 (73%) patients received tisa-cel and 4 (27%) were treated with axi-cel. In the non-CNS group, tisa-cel was the most common CAR-T cell product used (44/65, 68%) followed by axi-cel (21/65, 32%). Before CAR-T, all patients from the non-CNS group underwent a bridging therapy presented by immunochemotherapy, immunochemotherapy in combination with radiotherapy, or radiotherapy only. Of the patients from CNS group, 12 patients (80%) underwent any kind of bridging therapy following indication to CAR-T cell therapy: systemic treatment with MTX-containing regimen (42%; 5/12) followed by ibrutinib and steroids (17%; 2/12 for each) as well as radiotherapy (8%; 1/12). Two remaining patients (17%) received systemic immunochemotherapy for non-CNS lesions following indication to CAR-T treatment but experienced PD with new CNS lesions preceding CAR-T cell administration (Suppl. Table S1). Best objective response to the bridging therapy was PR and documented in half of the patients (50%), while the remaining patients (50%; 6/12%) failed to respond and entered CAR-T cell therapy with PD.
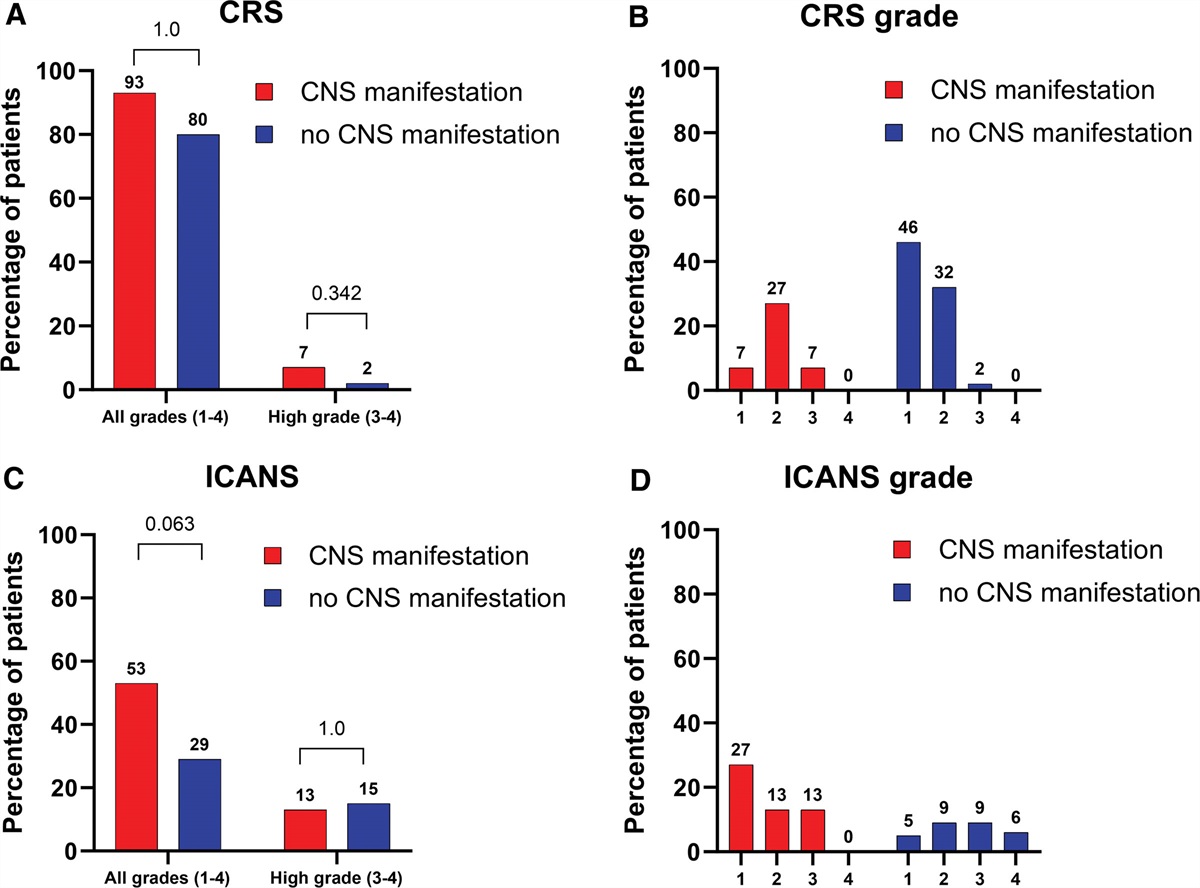
Feasibility and adverse events of CAR-T cell therapy in patients with CNS manifestations within first 100 days post-CAR-T CRS and ICANSThe frequency of CRS, ICANS and their severity are presented in Table 2, Suppl. Table S2, and Figure 1. The frequency of all CRS grades (grades 1–4) was comparable in the CNS and non-CNS groups: 93% versus 80%; P = 1.0 (Figure 1A). Grade 3 CRS was documented in 1 case in each cohort (7% CNS versus 2% non-CNS, P = 0.342), while grade 4 CRS did not occur (Figure 1B). There were no differences in CRS frequency and grading between both CAR-T cell products (axi-cel and tisa-cel) in the CNS group (Suppl. Table S2).
 Figure 1.:
 Comparison of adverse events from CAR-T cell therapy in cohorts CNS vs non-CNS. (A) Comparison of CRS incidence. (B) Visualization of CRS grade distribution. (C) Comparison of ICANS incidence. (D) Visualization of ICANS grade distribution. CAR-T = chimeric antigen receptor T cells; CNS = central nervous system; CRS = cytokine release syndrome; ICANS = immune effector-cell–associated neurotoxicity syndrome.
Numerically, ICANS (all grades) was more frequent in patients with CNS lymphoma manifestation, although the difference was not statistically significant (53% versus 29%; P = 0.063) (Figure 1C). Similarly, grade 3 ICANS was numerically slightly more frequent in the CNS group (13% versus 9%, P = 0.640). Yet, no grade 4 events were documented in the CNS group, while 6% (4/65) of patients in the non-CNS group experienced grade 4 ICANS (Figure 1D; P = 0.700). Again, the frequency and grading of ICANS in the CNS group did not depend on applied CAR-T cell product (axi-cel or tisa-cel) in the CNS group (Suppl. Table S2).
Application of corticosteroids was more frequently documented in patients with CNS manifestation (73% versus 52%; P = 0.161). Tocilizumab was applied in 73% (11/15) and 65% (42/65) of patients within the CNS and non-CNS cohorts, respectively (P = 0.763). No deaths occurred related to CRS or ICANS.
Feasibility and adverse events of CAR-T cell therapy beyond CRS/ICANSThe feasibility and adverse effects of CAR-T cell therapy beyond CRS/ICANS in patients with r/r DLBCL and CNS manifestations and who did not experience PD within first 100 days post-CAR-T (11/15) are presented in Suppl. Table S3. Three of 11 patients died due to nonlymphoma reasons: hemophagocytic lymphohistiocytosis, intestinal perforation, and infection, respectively. Of the remaining cases (8/11), only 1 patient (9%) presented with worse ECOG performance status (0→1) following CAR-T cell therapy. Following hematologic toxicities were observed: worsening of anemia in 36% of patients (4/11; grades 2, 3, and 4), of thrombocytopenia in 64% (7/11; grade 1, 2× grade 2, 1× grade 3, and 3× grade 4), and of leukopenia in 27% (3/11, 2× grade 2, 1× grade 3). The most common nonhematologic toxicity was infection documented in 9 of 11 patients with available data (82%): grade 1 in 9% (1/11), grade 2 in 36% (4/11), grade 3 in 27% (3/11), and grade 5 in 18% (2/11). One of the patients with grade 5 infection experienced intestinal perforation leading to peritoneal infection and death subsequently.
Treatment outcomesThe outcomes of CAR-T cell therapy are presented in Table 2, Suppl. Tables S1-S2, and Figures 2 and 3. Best responses following CAR-T cell therapy were achieved with medians of 1.1 and 2.7 months in CNS and non-CNS groups, respectively (P < 0.001). ORRs (80% versus 80%; P = 1.0) and CRRs (20% versus 42%; P 0.197) were comparable for both cohorts (Figure 2A and 2B). Within the CNS group, the type of CAR-T cell product (axi-cel or tisa-cel) did not impact response and survival outcomes (Suppl. Table S2). No significant differences were observed for estimated PFS (P = 0.157) and OS (P = 0.393). In the CNS group, median PFS (mPFS) and median OS (mOS) were 3.6 months (95% CI [confidence interval], 1.5-NR; P = 0.2) and 7.0 months (95% CI, 2.9-NR; P = 0.400), and in the patient population without CNS manifestation, 11 (95% CI, 5.1-27.3) and 30 (95% CI, 10.3-NR) months, respectively (Figure 2C, 2D).
 Figure 2.:
 Comparison of outcomes of CAR-T cell therapy in cohorts CNS vs non-CNS. (A) Comparison of ORRs and CR rates. (B) Distribution of best remission status. (C) OS. (D) Progression-free survival (PFS). CAR-T = chimeric antigen receptor T cells; CRR = complete response rate; CNS = central nervous system; ORR = overall response rate; OS = overall survival; PD = progressive disease; PR = partial remission; SD = stable disease.
Comments (0)