
記住我
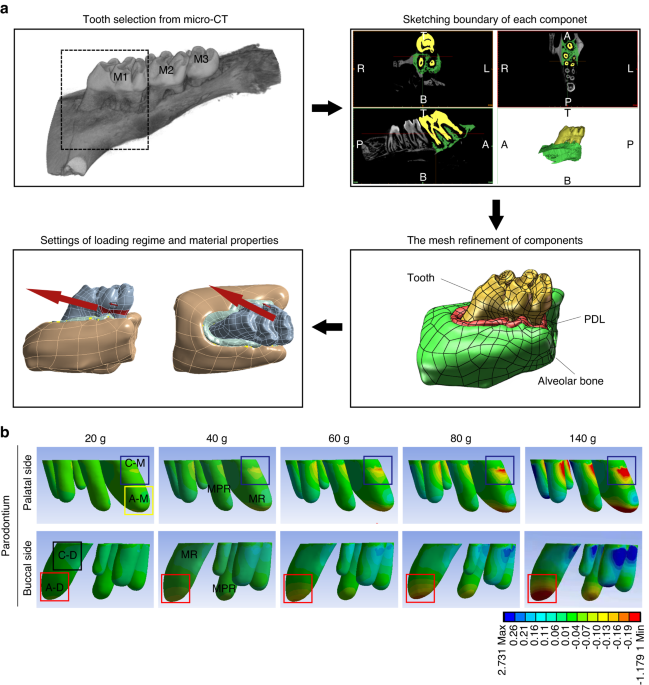
We isolated aDESCs from extracted apical buds of wild-type C57BL/6 mouse incisors by collagenase, dispase and trypsin-EDTA treatment and suspended the cells in Matrigel. First, we grew aDESCs in culture media used for taste bud organoids17, which contains essential factors for the culture of epithelial organoids, (Wnt3a, R-spondin1 and epidermal growth factor; Minimal in Table S1)18 with Noggin and Jagged1 (+NJ in Table S1). In this medium, aDESCs grew as organoids with a sphere appearance displaying a multilayered inner structure (Fig. 1a). Sectioning and histological staining by hematoxylin and eosin (H&E) staining revealed that the DEOs retained a stratified epithelial structure (Fig. 1b), a typical multilayered structure found in skin epidermis19. The epithelial basal cell markers, p63 and P-cadherin20,21,22 were specifically expressed in the outermost layers of the organoids (Fig. 1c, d). The expression of cytokeratin (Krt) 10, a marker of spinous layers19, was completely exclusive to p63 (Fig. 1c). E-cadherin was partially expressed compared to Krt10 in the suprabasal layers of the organoids (Fig. 1c, d).
Fig. 1
Establishment of a 3D culture system for murine dental epithelial organoids. a Differential interference contrast (DIC) images of dental epithelial organoids (DEOs) on days 3, 5, 7, 9, and 14 of culture from adult dental epithelial stem cells (aDESCs) in medium containing Wnt3a, R-spondin1, epidermal growth factor (Egf), and Jagged1 (+NJ). Scale bar = 100 μm. b–d DEOs grown in +NJ for 2 weeks. Hematoxylin and eosin (H&E) staining of paraffin sections of a DEO (c left, scale bar = 100 μm). On the right is a magnified image of the outlined area showing four epithelial cell layers (c, right, scale bar = 50 μm). c cornified, g granular, s spinous, b basal. Confocal image of paraffin sections of a DEO costained for P63 (d red), cytokeratin 10 (Krt10, d, green), and TO-PRO-3 (d blue). Scale bar = 100 μm (d top). Higher magnification (d bottom, scale bar = 50 μm). Confocal image of paraffin sections of a DEO costained for P-cadherin (e, red), E-cadherin (e green), and TO-PRO-3 (e blue). Scale bar = 100 μm (e, top). Higher magnification (e, bottom, scale bar = 50 μm)
Fibroblast growth factor 10 induced bud formation of organoidsFgf signaling is essential for the initiation and invagination of dental epithelium during early tooth development23. Among the various isotypes of Fgf, Fgf10 is expressed in the mesenchyme of developing incisors and plays important roles in cervical loop formation and maintenance15. To validate the capacity of DEOs to differentiate into dental epithelium, we added FGF10 to the culture media (+NFJ in Table S1). Notably, the formation of buds from DEOs was observed in +NFJ (Fig. 2a, upper panels and Fig. 2b). Histological analysis showed suppression of keratinocyte differentiation in the core of organoids grown in +NFJ (Fig. 2a, lower panels). Krt14, a marker of epithelial basal cells24, was expressed in both organoids grown with and without FGF10 (Fig. 2c, green). However, the expression of Sox2, a dental stem cell marker25, was observed only in budding regions of organoids grown in +NFJ (Fig. 2c). Differentially expressed gene (DEG) analysis based on RNA-seq results of the organoids grown with or without FGF10 showed that the transcription of 907 genes was significantly changed by FGF10 treatment (P < 0.05, Fig. 2d). For further analysis, upregulated (602) and downregulated (305) genes were subjected to gene ontology (GO) analysis. Upregulated and downregulated genes were significantly matched with 554 and 284 biological process (BP) terms, respectively, and the top 10 results of each group were visualized (Fig. S1a). The results revealed that the genes related to extracellular structure and matrix organization and cell adhesion and migration were upregulated, and the genes related with epidermis development were downregulated in organoids by FGF10 treatment (Fig. S1a). To visualize genes related to the GO terms, we annotated the volcano plot with the name of genes belonging to each term (Fig. S1b and Fig. 2e–i). FGF10 significantly increased the expression of downstream and upstream genes of extracellular signal-regulated kinases (ERKs, Fig. 2e), and extracellular matrix (ECM)-related genes including collagen (Col3a1, Fig. 2f) and matrix metalloproteinases (Mmp 2, Mmp10, Mmp12, Fig. 2f, g). In contrast, small proline rich proteins (Sprr1b, Sprr3) and cornifelin (Cnfn), the genes involved in the keratinization process19, and Krt10 were significantly decreased by FGF10 treatment (Fig. 2h, i). Gene set enrichment analyses (GSEA) of significantly regulated genes in +NF compared to +N showed the positive enrichment of cell cycle- related GO terms and negative enrichment of skin development-related GO term (Fig. S2).
Fig. 2
Effect of fibroblast growth factor 10 (FGF10) treatment on DEOs. a–c DEOs were grown in +NJ or FGF10-supplemented medium (+NFJ) for 2 weeks. Bright-field images of DEOs (a, top, scale bar = 50 μm). H&E staining of paraffin sections of DEOs (a, bottom, scale bar = 50 μm). Number of buds per DEOs (b, n = 50). Confocal image of paraffin sections of DEOs costained for Sox2 (c red), cytokeratin 14 (Krt14, c green), and TO-PRO-3 (c blue). Scale bar = 100 μm (c). Volcano plots of differentially expressed genes (DEGs) of DEOs grown in +NFJ compared with those of DEOs grown in +NJ. Fold changes are shown for all DEGs (d) or for genes related to specific ontology (GO) terms (e–i) as red (|fold change| > 2 and P-value < 0.001), blue (|fold change| < 2 or P-value > 0.001), and gray (not related to the indicated GO term) dots. Vertical dashed lines indicate −2-fold and +2-fold changes. A horizontal dashed line indicates a P-value of 0.001
Depletion of Jagged1 aided bud formation of organoidsNotch signaling plays a major role in epidermis development and homeostasis. Activation of Notch signaling by Notch ligands including Jagged1, suppresses the basal and cornified layer and promotes spinous and granular layer development in stratified epithelium26. DEG analysis of RNA-seq results of organoids grown in +N and +NJ medium showed that stem cell- (Bmi1, Sox2, and Gli1), proliferation- (Mki67, Pcna, and Ccnb1), and ameloblast-related markers (Ambn and Amelx) were not significantly regulated in +NJ compared to +N. However, keratinocyte related markers (Cnfn, Sppr2k, and Krt10) showed significant upregulation in +NJ compared to +N (Fig. S3).
Active bud formation was observed in DEOs grown in FGF10-supplemented and Jagged1-depleted culture media (+NF in Table S1, Fig. 3a–g). The buds consisted of basal and suprabasal layers reminiscent of an invagination of epithelium during development of epidermal appendages, in which E-cadherin-positive suprabasal cells provides centripetal force to make bud structure27. Whole mount (Fig. 3a) and section (Fig. 3d) staining of DEOs grown in +NF showed that most cells expressed Ki67, a proliferation marker, whereas, of Krt14 expression was dominant at the verge of buds. The exclusive staining patterns of E-cadherin and P-cadherin (Fig. 3e, f), and Krt10 and p63 (Fig. 3g) revealed well-developed basal and suprabasal layers in the buds.
Fig. 3
DEOs cultured in Jagged1-depleted, FGF10-supplemented medium form robust basal epithelial layers. a–g DEOs were grown in Jagged1-depleted, FGF10-supplemented medium (+NF) for 2 weeks. Bright-field image of a DEO (a, scale bar = 100 μm). H&E staining of paraffin sections of a DEO (b, scale bar = 100 μm). Maximum intensity projection of serial Z-section confocal images of a whole-mount DEO stained for Ki67 (c red), Krt14 (c green), and DAPI (c blue, scale bar = 50 μm). Confocal image of paraffin sections of a DEO costained for Ki67 (d, red) and Krt14 (d, green, scale bar = 50 μm). Confocal image of paraffin sections of a DEO costained for P-cadherin (P-cad, e red), E-cadherin (E-cad, e, green), and TO-PRO-3 (e, blue, scale bar = 50 μm). Higher magnification (f scale bar = 25 μm). Confocal image of paraffin section of a DEO costained for P63 (g red), Krt10 (g green), and TO-PRO-3 (g blue, scale bar = 25 μm)
GO analysis based on DEG (+NJ vs. +NF, P < 0.05) identified 71 and 155 BP terms for the upregulated and downregulated gene groups (Fig. 4a). The top GO terms were similar to those of +NFJ; extracellular structure organization and cell-substrate adhesion were annotated for the upregulated gene group, whereas epidermal cell differentiation and keratinization-related terms were annotated for the downregulated gene group (Fig. 4a). Eighty-one genes were significantly changed in organoids grown in +NF compared with +NJ (|fold change| > 2 and P-value < 0.01, Fig. 4b, red dots). Genes related to cell motility (α-actin2, Acta2), cell adhesion (melanoma cell adhesion molecule, Mcam), and extracellular matrix (derocin, Dcn; lumican, Lum) were included in 7 upregulated genes (Fig. 4c). Among 74 downregulated genes, various keratinocyte differentiation and keratinization-related genes were found (ATP-binding cassette sub-family A member 12, Abca12; arachidonate lipoxygenase 3, Alox12b; caspase 14, Casp14; Cnfn; profilaggrin, Flg; late cornified envelope, Lce1a1/1a2/1b/1c/1d/1g/3a/3b/3c/3d/3e/3f; loricrin, Lor; Sprr2k, Fig. 4d, e). In addition, downregulation of Krt1/10/13 and upregulation of Krt20 were observed (Fig. 4c–e).
Fig. 4
Transcriptomic change of DEOs cultured in Jagged1-depleted, FGF10-supplemented medium. a A dot plot of GO overrepresentation results for upregulated (Up) and downregulated (Down) DEGs in DEOs grown in +NF compared with DEOs grown in +NJ. The color and size of the dots indicate the P-value and gene ratio of each representative GO term. Volcano plots of DEGs of DEOs grown in +NF compared with DEOs grown in +NJ. Total (b and c) or indicated GO term-related (d, e) genes are displayed as red (|fold change| > 2 and P-value < 0.001), blue (|fold change| < 2 or P-value > 0.001), and gray (not related to the indicated GO term) dots. Vertical dashed lines indicate −2-fold and +2-fold changes. A horizontal dashed line indicates a P-value of 0.001
To clarify the effect of Fgf10, GO analysis was performed using commonly upregulated (Fig. S4a) and downregulated (Fig. S4b) genes in +NF and +NFJ compared to +N. Various metabolic process-related GO terms were enriched in commonly upregulated genes (Fig. S4c). Interestingly, the GO terms enriched in commonly downregulated genes were mainly related to skin development (Fig. S4d).
Inhibition of Notch signaling boosted the basal layer of organoidsTo find optimal conditions for organoid growth, we examined various combinations of growth factors. While dissociated single cells from the dental epithelium initially formed small organoids in the minimal medium, they either ceased growing (Fig. 5a and Fig. S5a, b) or formed hollow spheres containing only a single-cell layer, indicating loss of stemness to maintain epithelial structure (Fig. 5a–c, red arrows). We then added Noggin. When media were supplemented with Noggin (+N in Table S1 and Fig. 5a, b), which expands intestinal epithelial stem cells in both mouse and organoids28,29, organoids grew exponentially, but they still formed hollow spheres (Fig. 5a–c, red arrows). Furthermore, we examined dibenzazepine (DBZ; NFD in Table S1), a Notch inhibitor30, since genetic or chemical inhibition of Notch signaling increases the proportion of basal stem cells in epidermal tissues26. The growth rate of organoids cultured in +NF or +NFD media was similar to that of organoids cultured in +N medium (Fig. 5a, b). However, the fraction of hollow spheroids was reduced significantly when organoids were cultured in +NF or +NFD media (Fig. 5a, c).
Fig. 5
Morphology of organoids grown at different media compositions. Organoids were grown from aDESCs embedded in Matrigel using media supplemented with Wnt3a, R-spondin1, and Egf (minimal), minimal + Noggin (+N), +N + Fgf10 (+NF), or +NF + dibenzazepine (+NFD) for 2 weeks. a Maximum intensity projection of serial Z-section DIC images of whole well with multiple organoids. Scale bar = 500 µm. b H&E-stained paraffin sections. In a and b, red arrows indicate hollow spheroids. Scale bar = 100 µm. c Bar plot of the fraction of solid (blue) and hollow (red) spheroids as a function of the media composition (n = 3). Data are represented as the mean ± SD. d Bright-field images of representative organoids. Scale bar = 100 µm
The aDESCs cultured in +N medium formed spherical organoids with multilayered structures (Fig. 5d). FGF10 treatment induced budding structures (+NF, Fig. 5d) that contained epithelial stem cells and their descendants18. Interestingly, in +NFD medium (Fig. 5d), organoids formed smaller, but more numerous buds compared to those cultured in +NF medium. The morphological differences between organoids cultured in +NF and +NFD media were confirmed by serial Z-stack confocal images (Fig. S6a).
H&E staining of sections of organoids grown in +N media revealed well-developed basal (b), spinous (s), granular (g), and cornified (c) layers (Fig. 6a). This is typical for the stratified structure of skin rather than dental epithelium. Dominant expression of Krt10, assessed by immunofluorescence microscopy, is consistent with a multilayered differentiating epithelium (Fig. 6b).
Fig. 6
Histological and immunohistological analysis of DEOs. Organoids were grown from aDESCs embedded in Matrigel using media supplemented with minimal, +N, +NF, or +NFD for 2 weeks. a H&E-stained paraffin section. Scale bar = 100 µm. Confocal images of paraffin sections immuno-labeled for P63 (b red) and Krt10 (b green), or P-cadherin (P-cad, c red) and E-cadherin (E-cad, c green), and counterstained for nuclei with TO-PRO-3 (TP3, blue). Scale bar = 100 µm
In +NF medium, organoids lost their stratified epithelial layers and generated budding structures with expansion of a single layer of columnar basal cells (b) and a multi-layer of flattened suprabasal cells (sb, Fig. 6a). The invasion of epithelial organoids into the Matrigel is reminiscent of epithelial invagination into mesenchyme, an early event during tooth development that requires E-cadherin expression in suprabasal cells10,31. Indeed, organoids cultured in +NF medium showed enrichment of E-cadherin-positive cells in the suprabasal layer (Fig. 6c and Fig. S6b). With its distinct star-shaped cells (Fig. 6a, +NF, red arrows), the suprabasal layer in the organoids resembled the stratum intermedium of the tooth bud at bell stage.
Basal (b) and cornified (c) layers of organoids were well-developed in the +NFD medium (Fig. 6a). In these organoids the basal layer was dominant, as indicated by strong expression of P63 (Fig. 6b), a marker of epithelial stem cells32. The P-cadherin, which dominantly expresses in the inner enamel epithelium of tooth bud in the early- to mid-bell stage33 and a marker of transient amplifying population of the mouse incisor epithelium34, also highly expressed in the organoids grown in +NFD medium (Fig. 6c). However, E-cadherin-positive suprabasal cells were rarely observed in the small bubble-like structures of the organoids cultured in +NFD medium (Fig. 6c and Fig. S6c). The lack of suprabasal cells resulted in the loss of centripetal force to invaginate into Matrigel and bubble-like structures rather than budding structures observed in organoids grown in +NF medium. Inhibition of Notch signaling with simultaneous activation of Fgf signaling resulted in a significant expansion of basal layer, which indicates +NFD medium as the most favorable condition to maintain the aDESCs (Fig. 6c).
Interestingly organoids grown in both +N and +NFD medium contained eosinophilic cores (Fig. 6a, +N and +NFD), however, the antigenicity of the cores were different; the cores of organoids grown in +NFD medium showed low antigenicity for Krt10 antibody (Fig. 6b, +NFD). The DEG result of +NJ, +ND, +NFJ, +NFD compared to +N revealed that supplement of Jagged1 significantly increased expression of Krts significantly. However, supplement of FGF10, DBZ, or both significantly decreased the expression of Krts including Krt10 (Fig. S7). These results indicate that the eosinophilic cores observed in organoids grown in +NFD medium are different corneous found in skin tissues. In addition, induction of the skin development (GO:0043588) related genes by Jagged1 or DBZ treatment was suppressed by FGF10 supplement, which indicates that the FGF10 inhibits epidermal fate decision of the aDESCs in DEOs (Fig. S8).
Transcriptomic analysis reveals ameloblast marker expression in organoids cultured in +NFD mediumWe next compared expression profiles among the organoids grown in different culture conditions by performing bulk RNA-seq. DEGs were identified, and genes that were significantly upregulated in organoids cultured in +ND, +NF, and +NFD compared to those grown in +N medium (P < 0.05) were functionally annotated with GO terms. While in +ND medium skin development-related genes were upregulated, cell division- and extracellular matrix organization-related genes predominated in +NF (Fig. S9a and Fig. 7a). There was some overlap of GO terms, such as skin development- or extracellular matrix-related terms, between +NFD and +ND or +NF-grown organoids; however, only organoids cultured in +NFD exhibited upregulation of genes associated with odontogenesis (Fig. 7a).
Fig. 7
Functional analysis of genes differentially expressed in organoids grown at different media compositions. Analyses for organoids grown in +ND, +NF, and +NFD media were referenced to expression in +N media. a Dot plot visualizing gene ontology (GO) overrepresentation results for upregulated genes. Unique GO terms identified for each condition are labeled (a fully labeled plot is provided in Fig. S4a). The color and size of the dots indicate the P-value and gene ratio of each representative GO term, respectively. Enrichment maps of skin development-related GO terms for +ND (b) and +NFD (c) media. The color and size of the dots indicate the P-value and gene number of each representative GO term, respectively. The thickness of the solid lines linking the dots represents the number of genes shared between two GO terms. d A gene network of extracellular matrix-, odontogenesis-, and skin epidermis development-related GO terms (large dots) and related genes upregulated in the organoids cultured in the +NFD medium. The size of the open dots indicates the number of genes found in each term. Upregulated genes related to each term are visualized as closed dots. The color of the small dots represents the fold change in gene expression
We produced GO term network maps to visualize relationships between terms based on the number of genes they share35. Skin- and keratinization-related terms in +ND formed a closed network, which indicated functional redundancy among the terms (Fig. 7b). Interestingly, in organoids grown in +NFD medium, the closed network extended to include odontogenesis- and extracellular matrix organization-related terms (Fig. 7c). Genes related to ameloblast differentiation (ameloblastin, Ambn; ectodysplasin-A receptor-associated adapter protein, Edaradd; enamelin, Enam; and Msh homeobox 2, Msx2) were found in genes associated with the newly added terms in the network (Fig. 7d). In particular, the genes encoding proteins related to amelogenesis, such as amelogenin (Amelx), Ambn, Enam, Mmp20 and Tmem108, showed relatively high expression in organoids grown in +NFD medium (Fig. 7d and Fig. S9b).
To assess the similarity between organoids cultured in different media and the dental epithelium, we extracted gene sets for nine distinct cell types from a comprehensive single-cell RNA sequencing study36. GSEA revealed that pre-ameloblast, proximal ameloblast, and distal ameloblast gene sets were significantly enriched in the genes upregulated in +NFD but not in +ND or +NF media (Fig. S9c).
Based on the combined evidence from histological examination and gene expression patterns, the +NFD medium best supports growth of DEOs from murine aDESCs without loss of their characteristics as the dental epithelium. However, organoids entered culture crisis around passage 5, similar to what was observed in other systems18. Therefore, we examined the effects of supplementing +NFD medium with A83-01, an inhibitor of Smad signaling; SB202190, a p38 MAPK inhibitor; and nicotinamide, an amide form of vitamin B3 that increased the number of passages of colon crypt organoids to over twenty18. While the organoids grew normally with A83-1 (Fig. S10a), organoid growth was suppressed with SB202190 (Fig. S10a). However, organoids grown with A83-1 and nicotinamide (+NFDNiA) expanded over 5 months and continued to grow actively after being passaged 11 times (Fig. S10b, c). Importantly, single cells isolated from organoids did not lose their organoid-forming capacity even after freezing, storing, and thawing (Figs. S10b–d). This greatly enhances the scope of the organoid culture method we developed herein.
Generation of crystals and calcified tissues from organoidsThe loss of basement membrane between dental epithelium and mesenchyme prior to enamel matrix secretion and the critical roles of the ECM in ameloblast differentiation have been reported37. With the loss of basement membrane, preameloblasts become post-mitotic and responsive to Shh signaling38. To examine the effect of ECM and Shh signaling, we isolated DEOs grown in Matrigel for 2 weeks in +NFDNiA and cultured them as suspended on ultra-low attachment plates with media additionally supplemented with smoothened agonist (SAG), an agonist of Shh signaling. After 2-week suspension culture, formation of crystals from the surface of organoids was observed (Fig. 8a, red arrows). Some crystals were shed into the culture media (Fig. 8a, blue arrows).
Fig. 8
Suspension culture of DEOs. a–d DEOs grown in Matrigel for 2 weeks with +NFDNiA isolated from the gel and cultured in suspension with additionally supplemented with smoothened agonist (SAG). Bright-field image of a DEO (a, left panel) and magnified image of the area indicated by red lined box (a, right panels, red and blue arrows indicate crystals growing and being shed from the organoid, respectively). The shed crystals were collected and attached on slide glass for immunohistochemistry (b and c) or subjected into inductively coupled plasma (ICP) mass spectrometry for analysis of metal ion composition (d). Bright image of attached crystals (b). Confocal image of crystals costained for amelogenin (c, green) and ameloblastin (c red). Nucleus were counterstained with TO-PRO-3 (c, blue). Scale bar = 20 μm (c)
The enamel matrix proteins and their supramolecular structures are essential for control of the organization of apatite crystals in enamel39. Especially amelogenin, a most abundant protein in enamel matrix, forms self-assembled spherical structures which aligned with long axes of growing enamel crystallites40. To examine whether the enamel matrix proteins were incorporated in the crystals or not, we attached the shed crystals on silane-coated slide glass (Fig. 8b) and perform immunohistochemistry for amelogenin and ameloblastin (Fig. 8c). We observed dots of amelogenin were aligned along the long axes of the crystals (Fig. 8c, green). Rarely found compared with amelogenein, but the ameloblastin also detected on the crystals (Fig. 8c, red). Inductively coupled plasma (ICP) mass spectrometry revealed that calcium (Ca) and magnesium (Mg) were accumulated in the crystal structures (Fig. 8d).
Kidney transplantation is a useful method for validating the capacity of tissues to mineralize41. To examine amelogenic capacity, we transplanted organoids cultured in +NFDNiA medium under the kidney capsule of mice. Visual inspection of kidneys harvested 8 weeks after transplantation revealed the presence of whitish masses under the capsule (Fig. S11), suggesting the precipitation of a mineral. We found that the organoids transplanted under the kidney capsule generated a radiopaque object (Fig. 9a, b). The object was shown as an empty space surrounded by cells in decalcified section of kidneys (Fig. 9c, d). The enamel matrix proteins guiding mineral deposition during the early stage of amelogenesis are broken down by proteases and peptidases, and they are fully mineralized by mature ameloblasts1. In fully mineralized enamel, only ~1–3 percent of proteins remain, and the remaining enamel comprises minerals. As a result, only an empty space is found in the enamel space of the decalcified tooth42. The surrounding cells were cytokeratin 5 (K5)-positive (Fig. 9e, red), which confirms the epithelial origin of the cells. Amelogenin was only detected as a thin layer between empty space and surrounding cells or around the cells shed into the empty space (Fig. 9e, green).
Fig. 9
留言 (0)