
記住我
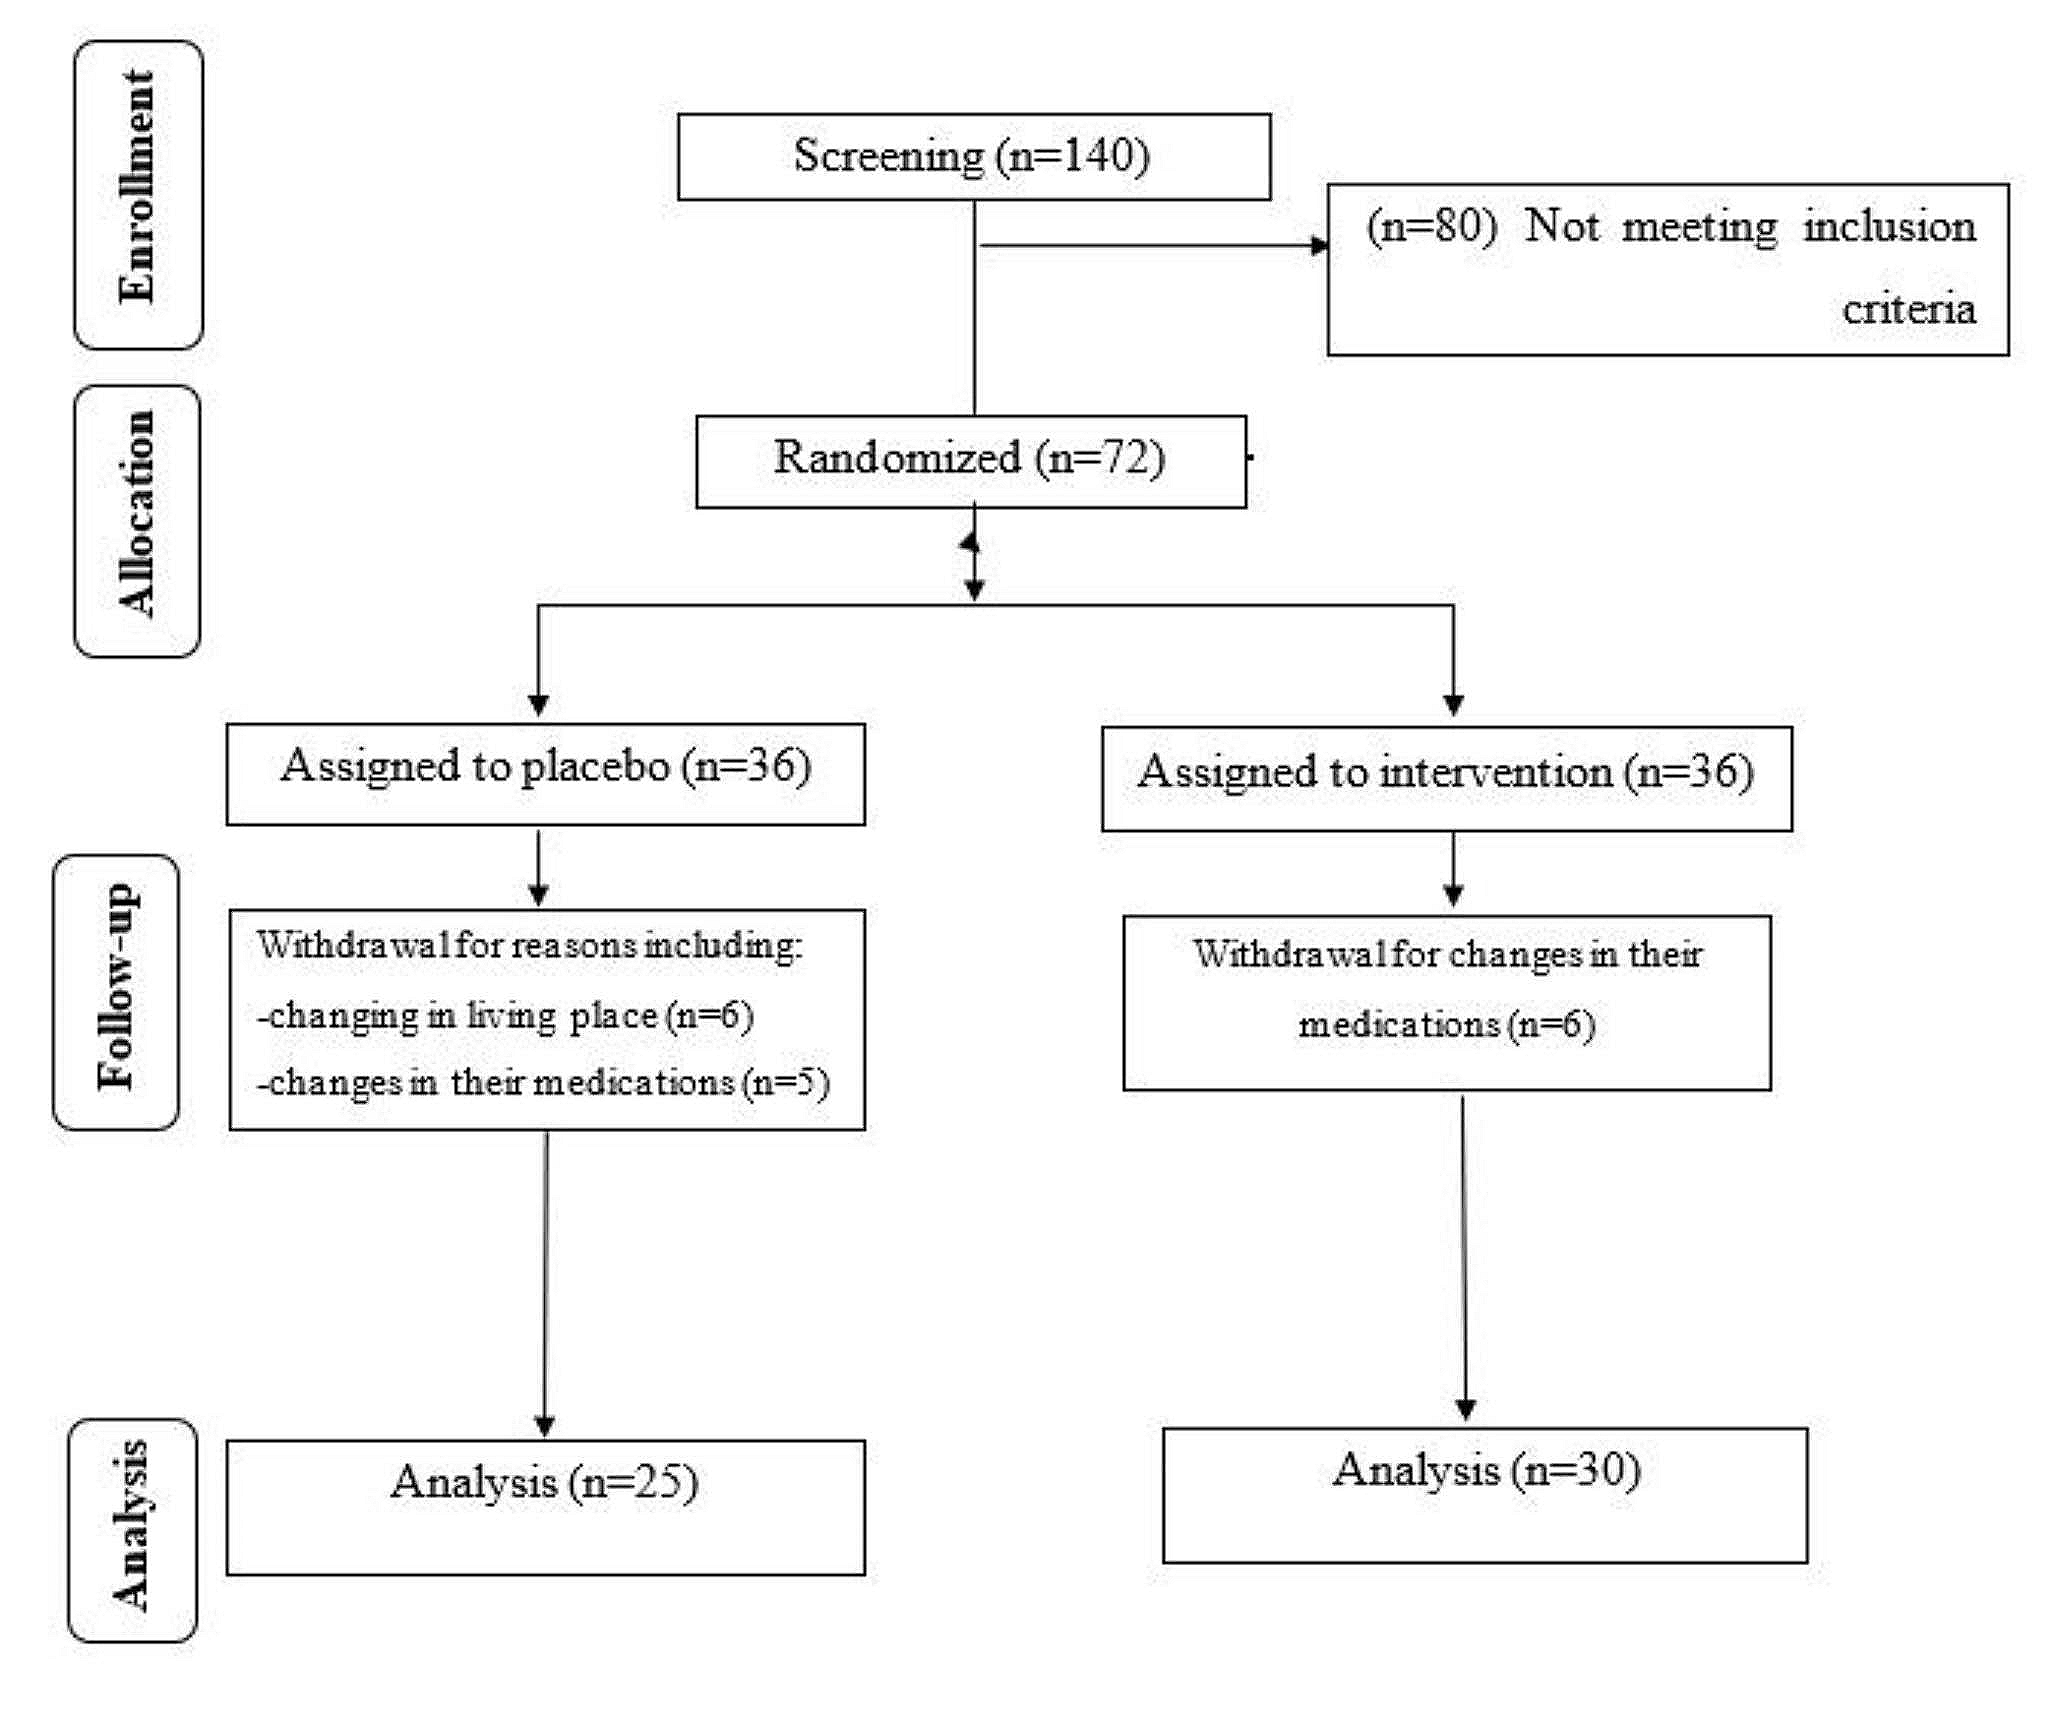

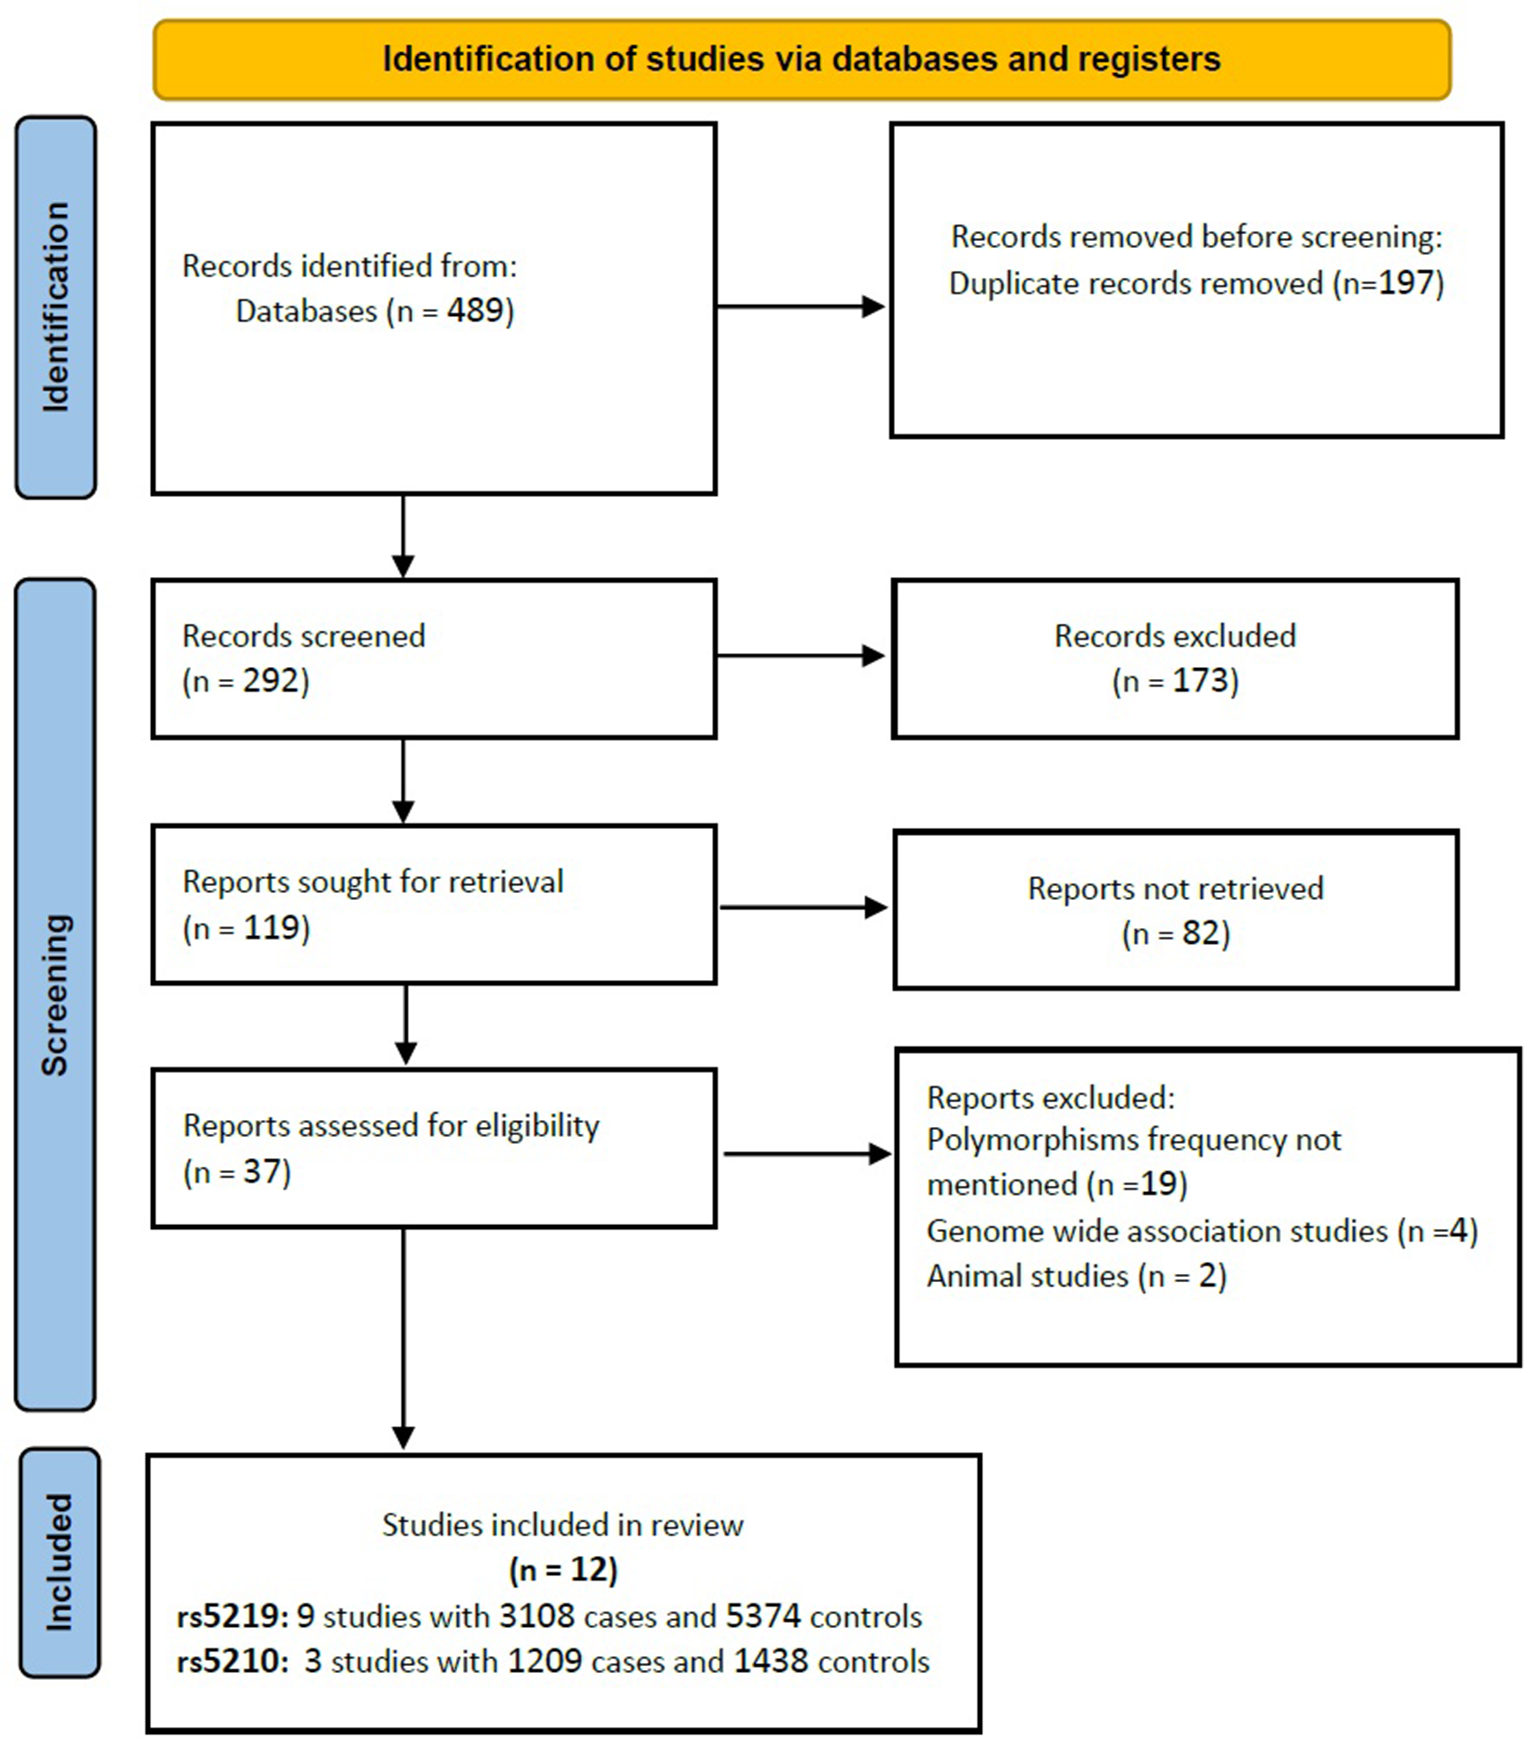
Following the procedure outlined in Fig. 1, 11 articles were included in this review. Artificial intelligence applied to temporal clinical data has the potential to improve the way a diabetic patient is managed according to their risk of developing DN. The different approaches are presented according to different questions: i) which features are most important, ii) what kind of ML models have been created, iii) which ones perform better, and iv) other relevant aspects. The papers selected for this review, together with a summary of their main aspects, are listed in Table 2. Looking at Table 2, we can see that most of the articles were published in the last 2–3 years, which shows a rapid growth in the application of ML to the management of diabetes-related conditions, taking advantage of the large amount of clinical data available.
Table 2 Summary of studies included in this reviewData sourcesWith the emergence and growth of available data, ML models have increased the predictive potential in a wide range of tasks in several application areas. With digitalization, all patient’s data is stored in computer databases. In fact, Electronic Health Records (EHRs) contain vital information about the patient, such as their medical history, illnesses, medications, treatment plans, allergies, and other highly relevant information. This type of data helps clinical research enormously by making it easier to access and track patient data [46]. It also allows for temporal and longitudinal analysis of the data, leading to different approaches and more accurate and correct predictive capabilities [47].
In addition to clinical variables, Omics-based biomarkers are often used. These can be defined as a molecular signature that is identified using omics data and used to predict the presence or risk of a particular disease or condition, or to monitor the response to a particular treatment. Omics can be divided into different research areas such as proteomics (proteins), transcriptomics (RNA), genomics (genes), metabolomics (metabolites), lipidomics (lipids) and epigenomics (methylated DNA) [48].
The integration of omics data with clinical data can significantly improve the ability to analyze and predict complex diseases using ML [49]. The work of Al-Sari et al. [45] is a very good example of the benefits of combining Omics data with clinical data. The performance of some of the models, which had previously been built using only clinical data, increased significantly when Omics data were included. In this case, metabolites, ketones, and sugar derivatives were used. In general, the integration of molecular data will lead to better prognostic models, as demonstrated in several works [50,51,52,53]. Despite the many benefits of integrating this type of data, there are some challenges. Sometimes, even when these data are available, they are very difficult to handle, process, analyze, and finally integrate. This requires specialized knowledge in the branches of mathematics, statistics, biology, and computer science [54].
Feature importanceThere are several factors that can lead to the onset or development of DN, such as demographic and genetic factors, clinical measurements, laboratory tests, and medical history. Most of the selected studies used different methods to understand which variables had the greatest influence on the final outcome when predicting risk. Some of these techniques were used to perform feature selection, which can potentially lead to better performance [55].
The work of Chan et al. [42] and Al-Sari et al. [45] used SHapley Additive exPlanations (SHAP) to understand how each feature contributes to the model's predictions, by estimating the amount that each variable contributes to the predicted value of an output. This allows them to ensure that they are selecting the most optimal set of variables for the task.
Recursive Feature Elimination (RFE) is an iterative method that can recursively remove the least important features from a dataset and build a model on the remaining attributes. As presented in Sarkosh et al. [39] and Dong et al. [44], this technique is very useful for selecting a subset of features that aggregates the most important features from a larger dimensional space. In both cases, a variant of this method, Recursive Feature Elimination with Cross-Validation (RFECV), is applied. A very similar approach was adopted by Makino et al. [37] and Dagliatti et al. [36] with their logistic regression (LR) stepwise feature selection method based on the Akaike information criterion (AIC). Stepwise feature selection is a method of selecting a subset of features by iteratively adding or removing variables. The AIC is a trade-off between model goodness and complexity, and measures the relative quality of a statistical model [56]. It can be used in stepwise feature selection to evaluate the performance of the model at each step and decide which feature to add or to remove. Although it appears similar to the RFE method, this technique trains on the selected subset of features at each step and can use either forward selection or backward elimination, whereas RFE trains on all features and removes the least important feature at each step.
Aminian et al. [40] computed the relative importance of each feature in the final model using AIC for the regression models and the Concordance index (C-Index) for the RF models. The C-Index is a metric that considers the temporal dependence associated with the model result and can be used to rank features by importance or even to analyze the global performance of the model.
Singh et al. [35] use a simpler and faster approach, Univariate feature selection, to identify the most relevant variables. These features were chosen through individual statistical tests with the target variable, without considering inter-feature dependencies or relationships.
Song et al. [41] adopted a slightly different approach, using the GBM classifier because it uses an embedded method of feature selection during model training.
Table shows the clinical variables that were mentioned in more than three papers as one of the most prominent variables able to give high predictive power to the model for analyzing the emergence or development of DN, and their respective meaning. Two of the reviewed articles indicated molecular data as being of high importance for the predictive model (Table 3).
Table 3 Most important clinical variables identifiedTable 4 details the three plasma biomarkers selected by Chan et al., while Table 5 shows the five molecular variables selected by Al-Sari, (2 ketones and 3 sugar derivatives).
Table 4 Most important omics identified by chan et al. [42]Table 5 Most important omics identified by Al-sari et al. [45]Risk modelsThis section systematizes several approaches to building a model that can predict the risk of developing diabetic nephropathy. Some approaches do not fully exploit the time factor inherent in the data (static approaches), while others manage to make better use of this factor (dynamic/temporal approaches).
Static approachesDong et al. [44] used data from non-DN patients at baseline who were followed for three years. The authors then used 408 patients who remained without DN and 408 patients who developed DN after the follow-up period. This data was used to build the model, it contains all the characteristics that the patient presented at baseline and the variable to predict is whether they developed the disease after the three years of follow-up. Binary classification was performed using seven different ML classifiers: Light gradient boosting machine (LightGBM), eXtreme gradient boosting (XGBoost), Adaptive boosting (AdaBoost), Artificial Neural Networks (ANNs), Decision Tree (DT), Support Vector Machine (SVM), and Logistic Regression (LR). This binary classification predicts the presence or absence of DN within 3 years.
There are several other papers that have taken a similar approach and transformed the problem into a binary classification. Romero et al. [38] followed a similar strategy, but defined eight different time windows for all the 7 years of patient follow-up data. Each window corresponds to one year of data, except for the first two windows, which correspond to only 6 months each. The tree-based classifiers OneRule, J48, and RF were chosen for their simplicity, speed of classification, and user-friendly graphical presentation.
Dagliatti et al. [36] used a binary outcome variable but for three different time thresholds of 3, 5, and 7 years to predict the risk of DN. LR, Naïve Bayes (NB), SVM, and RF were tested.
Aminian et al. [40] used data from both surgical and non-surgical patients with T2DM. Multivariate time-to-event regression and RF models were created to predict the 10-year risk of developing DN for both patients with and without metabolic surgery.
Sarkosh et al. [39] trained an LR-based risk score in 1907 diabetic patients, of whom 763 developed DN within five years. In a binary outcome problem, the authors used multivariate LR analysis to generate risk scores and divided patients into four different groups based on their respective risk of DN: low, moderate, high, and very high.
Chan et al. [42] used the same binary outcome in a train/test set of 686 patients and a validation test of 460 patients. Using clinical data and biomarkers, the authors generated risk probabilities using the final RF model and scaled the results to a continuous score between 5 and 100. The authors named the whole system IntelKidneyX. It stratified patients as follows: low risk (46%), intermediate risk (37%) and high risk (17%) of developing DN within 5 years.
Al-Sari et al. [45] and Makino et al. [37] did almost the same as the previously cited papers, but instead of defining outcome as absence or presence, it was defined as progressor or non-progressor in the Al-Sari paper and as worsening or stable in the Makino et al. paper. Al-Sari et al. used data from 190 patients who had no progression of DN and 190 patients who had progression of DN during a mean follow-up of 5.4 years. He used the RF classifier to predict whether the patient would progress to DN during the follow-up period. On the other hand, Makino et al. extracted clinical features from longitudinal, textual, and structural data. LR models were trained using data from 15,422 stable patients (remaining DN stage 1) and 15,388 patients who experienced disease progression at some point (from DN stage 1 to DN stage 2–5).
Unlike the works presented above, Allen et al. [43] are able to predict 3 different outcomes, DN progression to any stage, DN progression to stages 3–5, and DN progression to stages 4–5. Three different models were created for each possible outcome, each predicting the risk of progression to DN over the next 5 years. RF and XGBoost were used as classifiers with a training and test set of 62,994 and 7,656, respectively.
Figure 2 provides a general overview of the different approaches described above.
Fig. 2 Dynamic approaches
Different temporal approaches have been proposed to deal with EHR and provide risk prediction for DN. Within the remaining selected articles, the following approaches were used: stacked temporal, multitask temporal, discrete survival, and landmark boosting.
The stacked temporal technique was used in both Singh et al. [35] and Song et al. [41] work. It aggregates data from each time window to create a single prediction. T time windows, with F features in each, result in only one time window with T multiplied by F features. One of the disadvantages of this technique is that the larger the temporal space considered, the higher the dimensionality of the data, which can lead to a large overfitting. In Fig. 3, the physician appointments within each time window are aggregated to form a one-dimensional space, which is then fed into the model and a prediction is obtained.
Fig. 3
Stacked temporal approach
The multitask temporal method, introduced by Sing et al., involves predicting the outcome separately for each time window, with the requirement that each window must contain at least five physician appointments. When predicting the risk of DN for a new patient, time windows with five or more appointments are used and the final prediction is the average of the different results obtained in each time window. This stratification of the problem is shown in Fig. 4.
Fig. 4
Multitask temporal approach
Discrete survival and landmark boosting are two techniques mentioned in the paper by Song et al. The first makes an individual prediction in each time window, with no overlap between windows. A disadvantage of this technique is that it assumes that there is no relationship between examples in different time windows, even if they come from the same patient. This can be seen in Fig. 5.
Fig. 5
Discrete survival aproach
On the other hand, landmark boosting is very similar to discrete survival, but in each time window t, the prediction made in the previous time window t – 1 is also considered. In effect, there is a transfer of knowledge between the time windows, making each prediction more accurate. This can be seen in the representation of the approach shown in Fig. 6, where each model receives not only the features corresponding to a time window, but also the prediction made in the previous time window (Fig. 7).
Fig. 6
Landmark boosting classification
Fig. 7
Most used ML classifiers in proposed methods
Used models, interpretation, and performanceThis section discusses the type of models most commonly used to predict the onset or development of DN. It also presents the main interpretation techniques used and a comparison of performance.
Considering the selected papers, five different classifiers were proposed: RF, LR, LightGBM, GBM, and Multi-Task Logistic Regression (MTLR). From Fig. 7, we can see that the most selected method was RF, followed by LR, and finally LightGBM, GBM, and MTLR, which were selected only once.
Performance is the most important individual factor that defines the classifier, but it is not the only aspect to consider. RF was the most used classifier because the decision trees that make it up can be interpreted and the final result can be explained [43]. It has a good classification speed and can be represented graphically [38]. However, as a whole, these methods are often difficult to interpret, especially when the number of decision trees is large. It is therefore a classifier with a good balance between speed, complexity, and interpretability. LR has also been proposed several times because it provides a clear interpretation of its coefficients, which are usually represented graphically by nomograms, concepts with which physicians are very familiar [36, 59]. GBM was chosen by Song et al. [41] because of its robustness and effectiveness in predicting DN risk, as demonstrated in previous work. In addition, it incorporates feature selection. MTLR was proposed by Singh et al. [35] because it was appropriate for the type of solution proposed in their multitask temporal methodology. It consists of a multitask learning approach where learning is performed in parallel, and tasks are related to each other [60]. In this case, there is a learning task for each time window, and this approach is used to capture the dependency between tasks.
It is possible to identify three main techniques to interpret the results generated by the predictive model: i) SHapley Additive exPlanations—SHAP values, ii) monograms, iii) decision tree visualization. SHAP values were proposed by Lundberg et al. in 2017 to analyze model predictions [61]. It calculates the importance of each feature for a given prediction, where each feature can have a positive or negative impact on that specific prediction. The contribution of features can be local (each observation) or global (set of observations). In this case, authors used local explanations to show the reasons that lead to a certain result generated by the model for a specific patient. Nomograms are graphical representations of LR models. They work like scoring systems, where each feature is assigned a certain number of points according to its value, and the result varies according to the number of points accumulated in the sum of the different features [62]. Finally, some of the articles used only tree-based models because they can be interpreted directly by visual inspection of the associated decision tree [63].
Some papers predict the onset of DN, some predict the worsening, and some authors predict the worsening for specific stages of the disease. In addition, there are papers where the result corresponds to only one specific time window, while others implement a different prediction for each time window, taking into account a certain number of years. This heterogeneity makes it difficult to compare their performance directly. Table 6 provides detailed information on each of the proposed methods.
Table 6 Details and performance of proposed methods
留言 (0)