
記住我


DBZ04 was a monokaryotic isolate originated from the germination of a single basidiospore of T. fuciformis dikaryotic Tr01. A gap-free genome of DBZ04 was assembled using PacBio long reads combined with high-throughput chromosome conformation capture (Hi-C) data [12]. The 27.94 Mb genome was organized 11 chromosomes (Additional file 1: Fig. S1) and a circular mitochondrial genome was also assembled. The chromosomes varied in length, with the largest at 8.62 Mb and the smallest at less than 1 Mb (Additional file 1: Fig. S1). The end of each chromosome contained 20–40 tandem telomeric repeats (TTA(G)3–5). An rDNA cluster located at 2.76–2.90 Mb in Chr02 contained approximately 16 tandem rDNA unit repeats of a total of 8394 bp (Additional file 1: Fig. S2).
One potential centromere region (40 kb per region) for each chromosome was predicted by Hi-C mapping (Additional file 1: Fig. S3). Each region was unique but all were rich in repeat elements, occupying 69.5 to 100% of whole regions (Additional file 2: Table S1). All regions except for that of Chr10 contained at least two copies of Tcn6 transposon, except for those of Chr01 and Chr10 contained at least one copy of Tcn1 transposon. Both Tcn1 and Tcn6 transposons are commonly found in centromeres of Cryptococcus species complex [13], which belong to Tremellaceae, in the same order with T. fucifomis. Rnd-4 family-1813, belonging to the Ty1-copia family of retroelements, was also found in most centromere regions of DBZ04 genome.
PacBio circular consensus sequencing of Tr01 yielded 211,688 HiFi reads adding up to 3.26 Gb of data representing appropriately 60× coverage of the dikaryotic genomes. 40.3 Gb (713×) Oxford Nanopore ultra-long read sequences of Tr01 genome were generated and 31,712 Nanopore ultra-long reads larger than 100 kb, totaling 4.04 Gb (72×), were selected to assist and verify Tr01 genome assembly. HiFiasm in Hi-C mode assembled the HiFi reads into two sets of phased contigs. One set was 30.3 Mb in size containing five complete chromosomes, and the other set was 30.2 Mb in size with seven complete chromosomes. Analyses of rDNA region in each genome set linked rDNA-related contigs into one telomere to telomere (T to T) chromosome. Polished Nanopore ultra-long reads further were used to bridge gaps and assembled the rest 41 contigs of first genome set into six complete chromosomes, and the rest 46 contigs of second genome set into three complete chromosomes using telomeric repeat sequences as markers to reach T to T chromosome assemblies. After phased by NuclearPhaser [14], 11 T to T chromosomes were clustered into Tr01-Haplotype A genome, and the other 12 T to T chromosomes in Tr01-Haplotype B genome. For chromosomes with heterozygosity between two haplotype genomes, each chromosome had significantly stronger Hi-C contact signals with chromosomes from same nucleus than those from the other nucleus (P-value = 3.9E-12 in one-way ANOVA, Additional file 1: Fig. S4).
Nanopore ultra-long reads were mapped to the Haplotype A and B genomes to verify the assembly. There were 7 TE insertions and 24 TE deletions in Haplotype A genome, and 5 TE insertions and 18 TE deletions in Haplotype B genome (Additional file 2: Table S2). These TEs were mainly composed of 16 copies of 683 bp LTR (30%), 16 copies of 1239 bp LTR (30%), and 7 copies of 6550 bp LTR (13%). HiFi reads were mapped across each of the TE InDels and verified that the sequences in the haplotypes A and B were correct, and all TE InDels. For example, two tandemly duplicated 6587 bp TEs were mapped and verified by 45 HiFi reads cross these two TEs, but the Nanopore Ultra-long reads mapped to this region contained three tandemly duplicated 6587 bp TEs. Samples for PacBio sequencing and Nanopore sequencing were collected in 2021 and 2023, respectively, 18 months apart. TE InDels occurred during this period, separated by 12 rounds of vegetative reproduction, reflecting TE movement during mitoses in these 18 months. No chimeric contigs in Haplotypes A and B were detected, resulting from high accuracy and high redundancy of HiFi reads generated.
The Tr01-Haplotype B genome of T. fuciformis Tr01 contained 12 chromosomes, one more than those in the Tr01-Haplotype A genome. Further, the sequences flanking six breakpoints in the Tr01-Haplotype B genome showed non-collinear arrangement with the Tr01-Haplotype A genome, revealing five structural variants between these two nuclear genomes, two each in Chr01A and Chr02A and one in Chr05A (Fig. 1). Both PacBio HiFi reads and Nanopore ultra-long reads (> 100 kb) supported the linkage between the upstream and downstream sequences (Fig. 2A) flanking each breakpoint in these structural variants. For example, the upstream sequences flanking breakpoints B and J were a pair of homologous sequences, but their downstream sequences had no similarity, indicating that structural variations in the form of homologous recombination took place at those sites. We mapped 45 and 43 long HiFi reads uniquely to sequences around breakpoints B and J, respectively, verifying the linkage of these structural variants (Fig. 2B). Strong Hi-C signals between upstream and downstream sequences of each breakpoint (B and J shown in Fig. 2C, others shown in Additional file 1: Fig. S5) also supported their neighbor relationship. For both Tr01-Haplotypes A and B genomes, each end of a chromosome showed strong contact signals with other chromosomal ends (Additional file 1: Fig. S6). The telomere-telomere contacts provided another evidence for genome assembly verification.
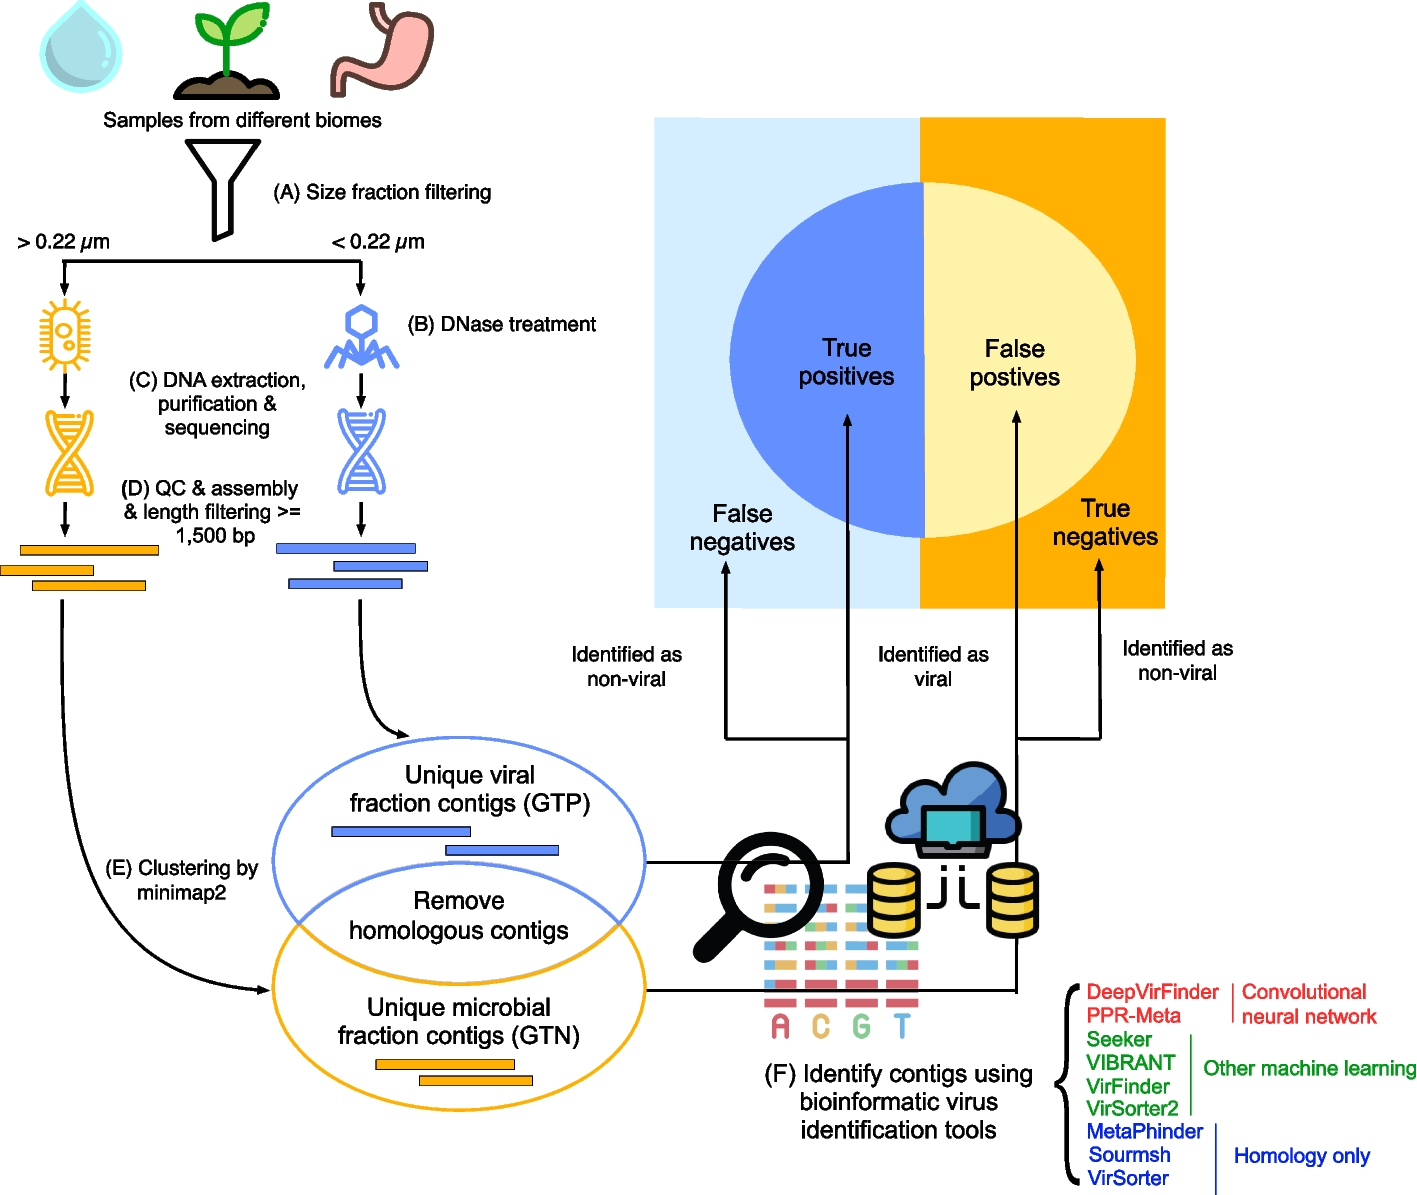
Fig. 1
Linkage of similar sequences between the dikaryotic genomes (> 10 kb sequence) of Tremella fuciformis. Red bars in outer ring represent centromere locations of each chromosome. Red lines, ≥ 99% identity; yellow lines, ≥ 95% and < 99% identity; blue lines, ≥ 90% and < 95% identity; gray lines, < 90% identity. Black arrowheads mark breakpoints of structural variation between the dikaryotic genomes
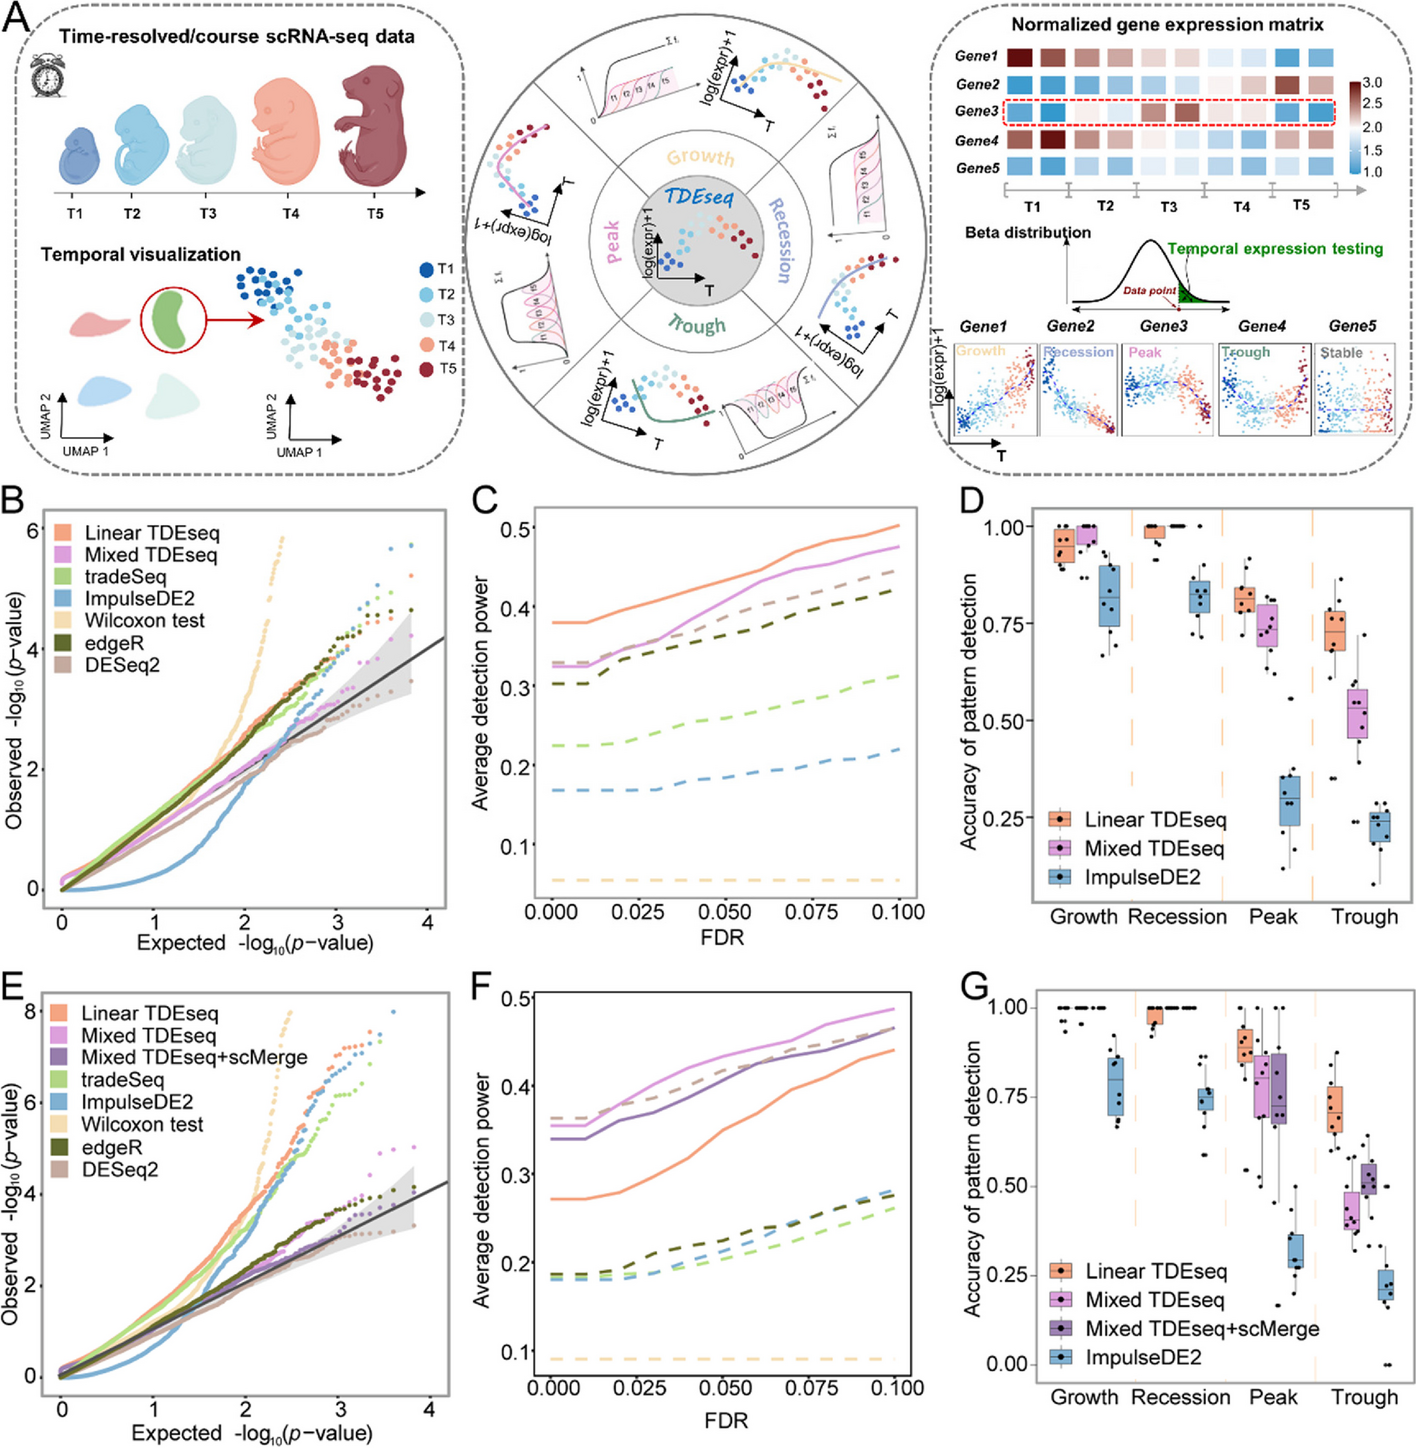
Fig. 2
Verification of structural variations by PacBio HiFi and Nanopore ultra-long reads, and Hi-C data. A Number of PacBio HiFi and Nanopore ultra-long reads crossing the regions between 2-kb upstream and downstream of the breakpoints. All Nanopore ultra-long reads are larger than 100 kb in size. B Schematic diagram of long HiFi reads crossing the breakpoints B and J. Inverted triangles point to the breakpoints. Dark colors in the bars represent repeat sequence regions. Red solid lines and red dotted lines represent a set of homologous regions between the dikaryotic genomes. Blue bars represent reads mapped and light green bars represent reads mapped by reverse complementarity, respectively. C Heat map of Hi-C data supporting neighbor relationships between upstream and downstream sequences of breakpoints B and J. Black arrowheads mark breakpoints of chromosome rearrangement
Genomic comparison between DBZ04 and Tr01All 11 chromosomes shared high sequence collinearity between Tr01-Haplotypes A and DBZ04 genome. Sequence similarity between these two genome, except for DBZ04 regions of Chr01:5177740-6011183, Chr05:1881594-2385495(3’end), Chr06 and Chr07:1662638-2272366(3’end), were higher than 99.99%, whereas the four sequences showed more than 99.99% identity with the corresponding ones in Tr01-Haplotypes B genome. As a result, four homologous recombination breakpoints occurred in DBZ04 genome during meiosis, which carried ~82% and ~18% of Tr01-Haplotypes A and B source sequences, respectively (Additional file 1: Fig. S7). The recombination breakpoints were also verified by mapping of Nanopore ultra-long reads (Additional file 2: Table S3). Due to both genomes being generated independently, DBZ04 genomic sequences provided another evidence to verify the assembly of Tr01 genomes.
Genomic comparison of two nuclei in T. fuciformis Tr01Approximately half of the T. fuciformis Tr01 assemblies were assigned to either Tr01-Haplotype A or B genome, which are 28.15 and 28.34 Mb in length, respectively. Eight chromosomes shared high sequence collinearity between Tr01-Haplotypes A and B, including Chromosomes 3, 4, and 6 to 11. Three chromosomes contained rearrangements and sequence variation, including chromosomes 1, 2, and 5 between the two haplotypes (Fig. 1 and Table 1), resulting in different genomic architectures. Tr01-Haplotype A or B architectures were referred to as, based on sequence arrangements of their Chr01, Chr02, and Chr05, respectively. The additional Chr12B in the Tr01-Haplotype B genome was a centromere-free chromosome of 1.51 Mb, most of which was homologous to the right arm of Chr05A. Sequence alignments between the two haplotype genomes revealed four large orphan regions (> 50 kb), including Chr05A:795,575-913,748 and Chr07A:1-125,423 in the Tr01-Haplotype A genome, and Chr01B:1-58,696 and Chr12B:1-172,532 in Tr01-Haplotype B genome. Annotation of the Tr01-Haplotypes A and B genomes predicted 8480 and 8563 genes, including 100 and 134 haplotype-specific genes, respectively. 28.2% of the haplotype-specific genes were distributed in the orphan regions.
Table 1 Chromosome number, size, and gene content of Tremella fuciformis Tr01-Haplotype A and B nuclear genomesA total of 0.6 million SNPs (average 21/kbp) were called between the two nuclear genomes of T. fuciformis Tr01, distributed mainly on Chr01, Chr02, and Chr03, and on Chr05, Chr06, Chr07, and Chr08 (Additional file 1: Fig. S8). Genome comparison predicted 2201 structural variants (SVs), including 1154 insertions in Tr01-Haplotype A and 1047 in Tr01-Haplotype B. These SVs exhibited a wide range of lengths from 21 to 32,759 bp and account for 4.5 and 7.1% of the corresponding genome size. Both nuclear genomes had similar proportions (~19%) of repetitive sequences, of which 70% were long terminal repeats (LTRs). Interestingly, two species-specific LTRs, LTR683 and LTR1239, were widely and unevenly distributed in the nuclei (Additional file 1: Fig. S9). A total number of 181 full-length LTR683s were detected in Tr01-Haplotype A, ~6 times the number in Tr01-Haplotype B. Inversely, 221 copies of full-length LTR1239s were found in the Tr01-Haplotype B genome, but just 4 in Tr01-Haplotype A. LTR683 and LTR1239 had a strong bias to Tr01-Haplotype A and B nuclei, respectively.
Homologous chromosomes of Chr04, Chr09, Chr10, and Chr11 were remarkably similar, with similarity of 99.99%, 100%, 100%, and 99.97%, respectively (Additional file 2: Table S4). However, multiple SVs were detected between each pair of the homologous chromosomes, accounting for 0.5 to 4.4% of the sequence size, and reaching density of 0.29 to 1.04 SVs per 100 kb. LTR683s were only detected in Chr09A, Chr10A, and Chr11A, and 4 times in Chr04A than in Chr04B. Inversely, LTR1239s were only detected in Chr10B and Chr11B, and 5 times in Chr04B than in Chr04A (Additional file 1: Fig. S9). Both LTRs were useful markers to distinguish these homologous chromosomes of low heterozygosity.
Similar to T. mesenterica [15], T. fuciformis is a tetrapolar basidiomycete. The two mating type loci in T. fuciformis Tr01 were not genetically linked to either the Tr01-Haplotype A or B genome. The pheromone and pheromone receptor (P/R) loci were located on Chr08, whereas both homeodomain (HD) loci were on Chr07. Polymorphic regions in the P/R loci were about 18 or 23 kb in length and harbored eight genes, seven of which showed allelic differences. Only 1–2-kb regions in the HD loci were polymorphic, including partial sequences of SXI1 and SXI2 genes, as well as their intergenic region (Additional file 1: Fig. S10).
Two-speed genome of T. fuciformis Tr01The Tr01-Haplotype A nucleus of T. fuciformis Tr01 carried three minichromosomes, Chr09, Chr10, and Chr11, each less than 1 Mb in length. With an average gene density of less than 2.4 per 10 kb, each of the mini chromosomes carried less than 200 genes, a significantly lower number than on the other eight chromosomes (2.7 or more per 10 kb, P-value 4.6E-05 in one-way ANOVA). The proportion of repetitive sequences in the minichromosomes was more than 50.0%, and more than twice that in the other chromosomes (25.1% or less, P-value 1.4E-05 in one-way ANOVA). GC contents and average gene lengths of the minichromosomes were lower than those in other eight chromosomes (P-value 2.2E-04 and 4.7E-04 in one-way ANOVA, respectively). Due to their low gene density and high content of repetitive sequences, Chr09, Chr10, and Chr11 are regarded as accessory chromosomes. In addition, segments 1–500 kb on Chr04 (Chr04-C1) and 1–590 kb on Chr05 (Chr05-C1) contained high percentages of repetitive sequences and low densities of genes and were therefore considered accessory compartments (Fig. 3A ring (1), (2), and (3), Additional file 2: Table S5). Similarly, the Tr01-Haplotype B genome also contained three accessory chromosomes and two accessory compartments of similar sizes (Additional file 2: Table S5). Hi-C contact signals among accessory compartments were stronger than those among core compartments (Additional file 1: Fig. S3).
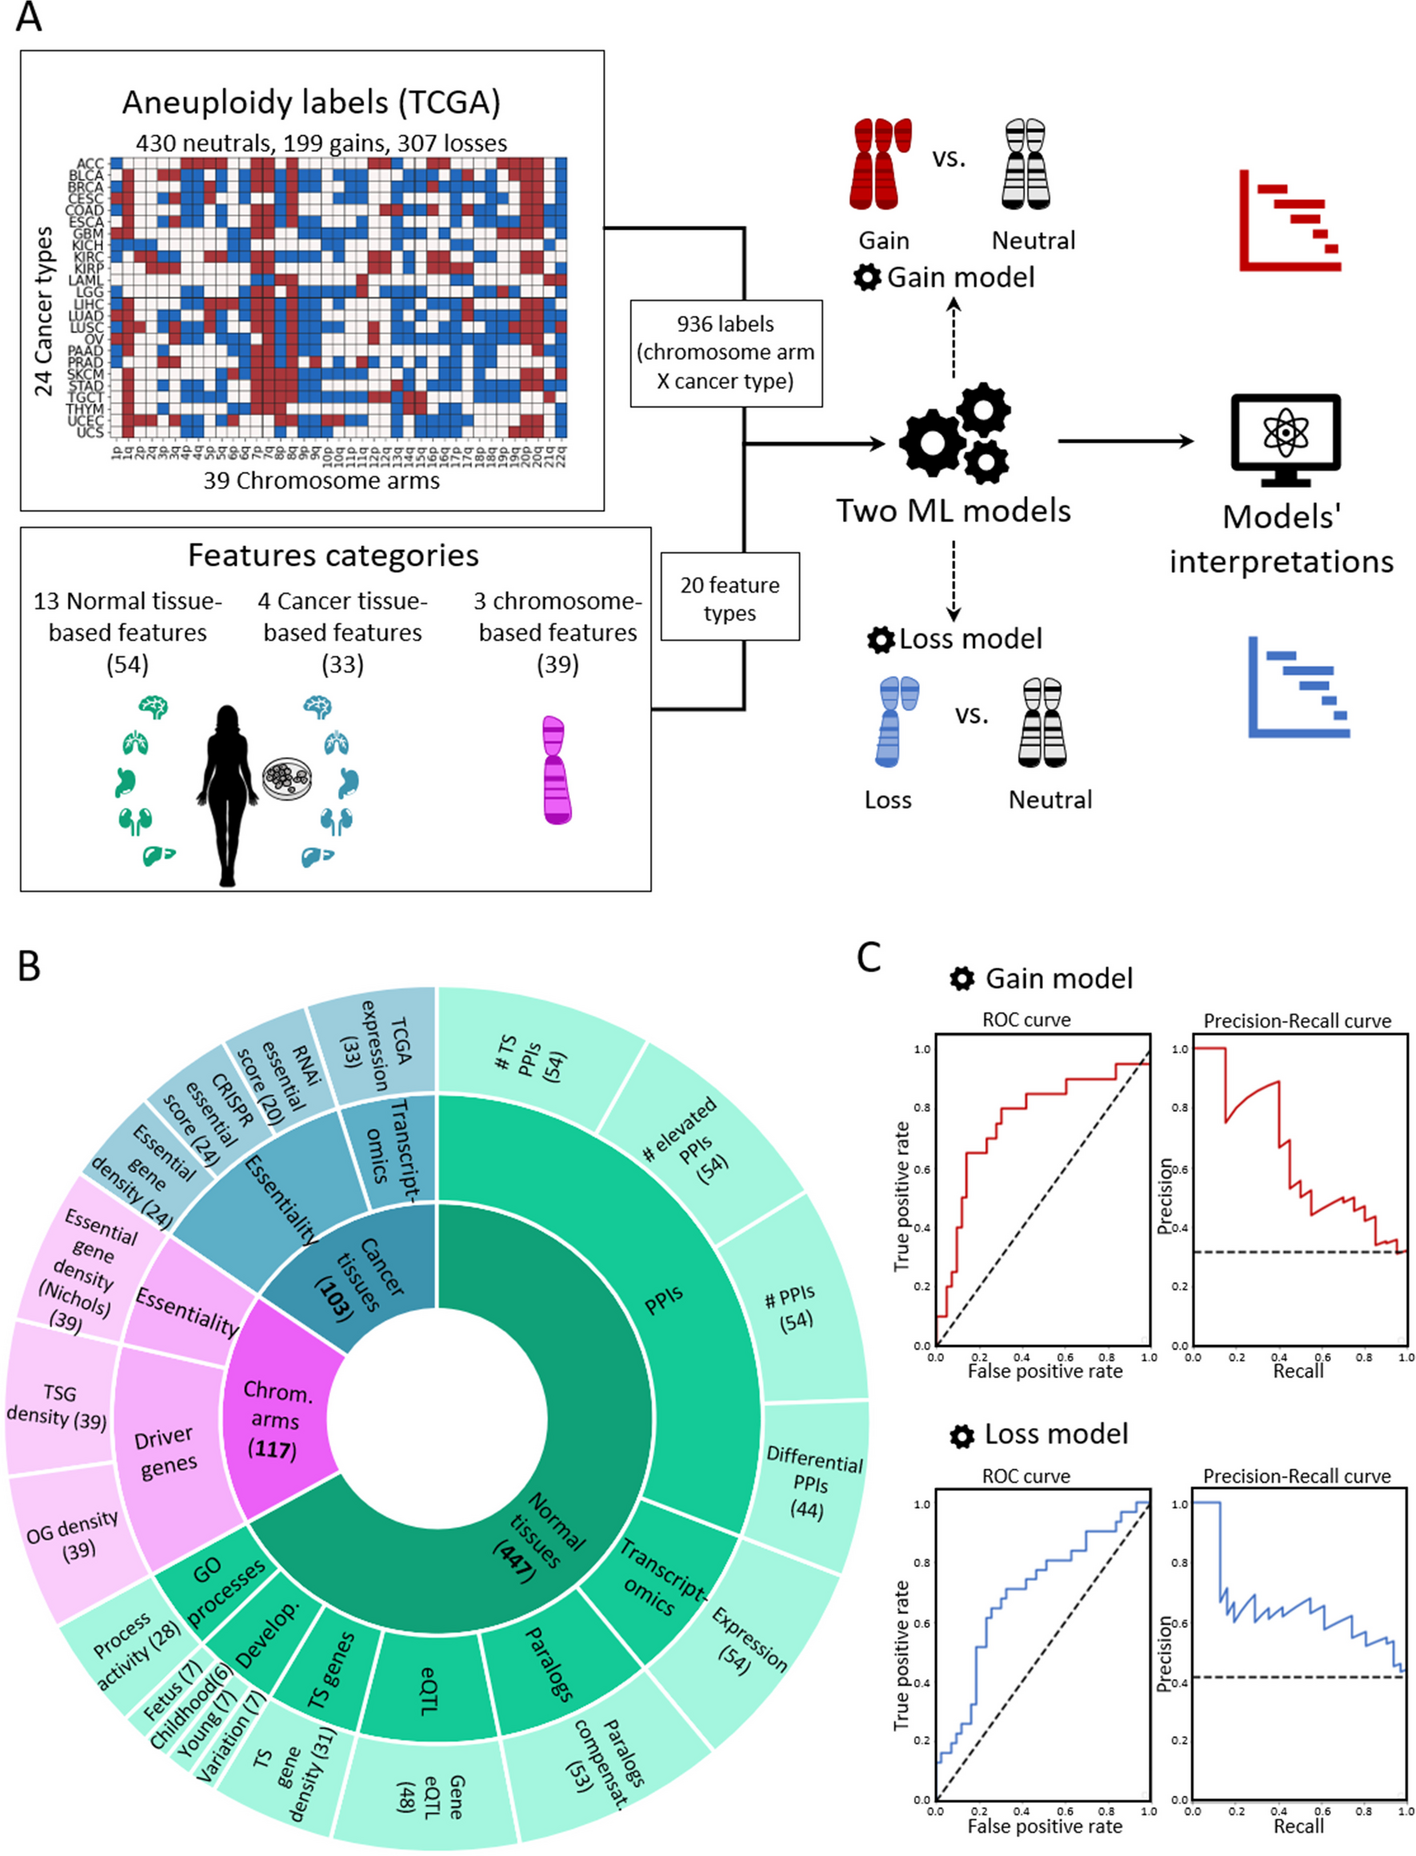
Fig. 3
Features of dikaryotic genomes in Tr01. A Circos representation of the dikaryotic genome of Tr01-Haplotype A. From outer to inner layer: (1) distribution of core (blue) and accessory (red) chromosomes/compartments in the Tr01-Haplotype A genome; (2) gene density in 100-kb windows; (3) percentage of repetitive sequences in 100-kb windows; (4) SNP density between Tr01-Haplotype A and B genomes in 100-kb windows; (5) distribution of BUSCOs. B Aneuploid accessory regions of single-basidiospore isolates. For each isolate, normalized read depth in 10-kb windows is shown along accessory regions relative to the Tr01-Haplotype A genome. Copy number variations of Chr09 are shown in red boxes. Copy number variations of Chr11 are shown in purple boxes
Genome-wide SNP calling between two haplotypes displayed a landscape of gradient heterozygosity. Tr01-Haplotype A genome was divided into 2810 bins of 10 kb size each. Sequence pairs of 21.8% of bins were nearly identical (> 99.9%), representing low heterozygosity. Bins with sequence differences of 0.1–1%, 1–2%, 2–3%, and 3–4% had similar numbers of, accounting for 15% respectively. Another 19.3% of bins had SNP densities more than 4%. Low-heterozygosity bins occurred mainly in nine regions, including four whole chromosomes (Chr04, Chr09, Chr10, and Chr11) and five compartments (Chr02:1,754,000–2,351,000, Chr03:1,862,000–2,012,000, Chr05-C1, Chr06:936,000–1,155,000, Chr07:1,006,000–1,190,000). All accessory chromosomes and compartments were located in low-heterozygosity regions (Fig. 3A ring (4)), indicating a different evolutionary path for these regions from the rest of the genome.
Analysis of the complete set of benchmarking universal single-copy orthologs (BUSCO) for Basidiomycota in the T. fuciformis genome was used to assess the completeness of our genome assembly and to assist in distinguishing core and accessory chromosomes. Between 96.9 and 97.2% of conserved Basidiomycota BUSCO genes could be predicted in the Tr01-Haplotype A and B genomes. Only one BUSCO gene was detected in the 22 subtelomeric regions (100 kb in size) of the Tr01-Haplotype A genome, and four were found in the 24 subtelomeric regions of Tr01-Haplotype B. An average of 0.11 genes per 100 kb in the subtelomeric sequences was much lower than the BUSCO gene density (6.1/100 kbp) in the rest of the chromosomes of both haplotypes. No BUSCO genes were detected in accessory chromosomes and compartments (Fig. 3A ring (5)), supporting the hypothesis that accessory chromosomes/compartments are non-essential.
By examining sequence read depth across the accessory regions, large-scale copy number variations were identified in about one-fifth of monospore isolates (6 of 33 strains). Loss of the entire Chr09 was detected in isolates DBZ07 and DBZ33 (Fig. 3B), indicating that the loss took place during meiosis. The sequence read depth of whole Chr11 was halved in isolate DBZ03, but increased by about half in isolates DBZ23, DBZ25, and DBZ29 (Fig. 3B). Germinated from a single basidiospore, sequenced genomes should be two or more karyotypes, each of which carried different copies of Chr11, indicating that gain or loss of whole Chr11 occurred in some cells after meiosis.
Extra chromosomes in monospore isolatesT. fuciformis Tr01 Chr01B:1–58,690 (Chr01B-C1) and Chr12B:1–172,535 (Chr12B-C1) were type B genome-specific regions that are regarded as the markers for Tr01-Haplotype B architecture. In monospore isolate DBZ15, a ~1.8× sequence read depth was detected in regions of Chr01B-C1 and Chr12B-C1 (Fig. 4A). No sequence reads cross the sites of Chr01B:58,690 (site A) and Chr12B:172,535 (site B), whereas 205 sequence reads supported the linkage between Chr01B-C1 and the reverse compliment of Chr12B-C1 (Chr12B-C1 RC), suggesting that Chr01B-C1 had become linked to Chr12B-C1 RC to form a new chromosome (ChrN1). An approximate 1.8× sequence read depth also revealed two or more copies of ChrN1 in some but not all cells. In DBZ02, PacBio long reads supported the connection of upstream and downstream sequences at each of sequencing depth inflection points A and B (Fig. 4B). Furthermore, 2.0× more sequence read depth was detected in regions of Chr05B:1–675,684 and Chr12B:1–834,373 than those in DBZ43 (Fig. 4B). Sixty PacBio long reads supported the linkage between Chr05B:1–675 684 and the reverse compliment of Chr12B:1–834,373 (Chr12B:1–834,373 RC), suggesting that Chr05B:1–675,684 linked to Chr12B:1–834,373 RC to form a new chromosome (ChrN2).
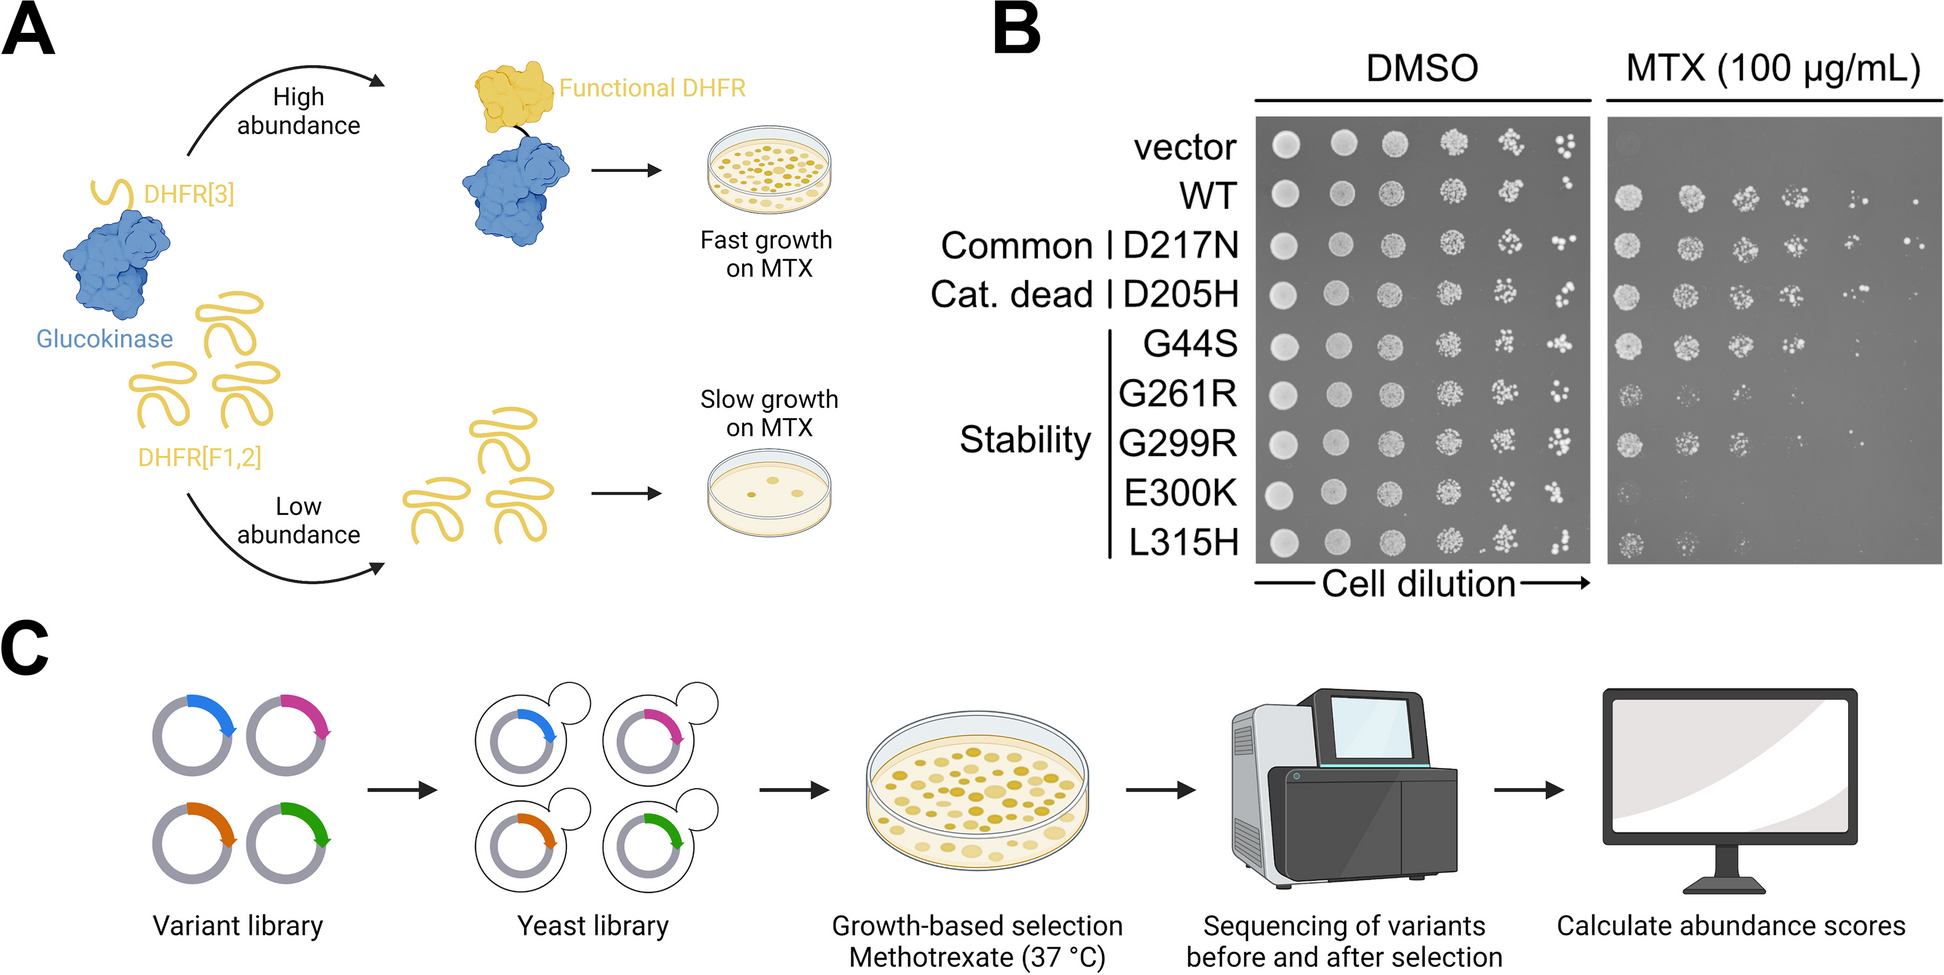
Fig. 4
Evidence for formation of new chromosomes. ChrN1 in Tremella fuciformis monospore isolate DBZ15 is in panel A. ChrN2 in Tremella fuciformis monospore isolate DBZ02 is in panel B. A Above: sequence read depth of monospace isolate DBZ15 at regions Chr01B:1–450,000 and Chr12B:1–450,000 (blue traces represent DBZ15, orange traces represent DBZ43). Panel A Below: supported PacBio long reads that span the breakpoints at A and B in sequence read depth and the rejoining site A/B. B Above: sequence read depth at regions Chr05B:1–1,000,000 and Chr12B:1–1,000,000 (blue traces represent DBZ02, orange traces represent DBZ43). Panel B Below: supported PacBio long reads that span breakpoints at A and B in sequence read depth and the rejoining site A/B
ChrN1 was a minichromosome with a length of 0.23 Mb, 32.9% of which comprised repetitive sequences (Table 2), harboring 62 genes including one BUSCO and 12 repeat element-related genes. ChrN2 was a small 1.52-Mb chromosome, 16.0% of which comprised repetitive sequences, harboring 476 genes including 105 BUSCO and 72 repeat element-related genes. Due to each of component segments containing one telomere and no centromere, both new chromosomes were capped by telomeres at both ends, but did not have centromeres.
Table 2 Features of new chromosomes identified in monospore isolates of Tremella fuciformis Tr01Our 14 monospore isolates (42.4%) of T. fuciformis Tr01 were aneuploids with one or two extra chromosomes and could be clustered into four types (Table 3). Types I, II, and III included eight, one, and two isolates, contained extra Chr12B, ChrN1, and ChrN2 chromosomes, respectively, and exhibited Tr01-Haplotype A genomic architecture. Type IV was represented by three isolates, two extra chromosomes, Chr12B and ChrN1, and also exhibited Tr01-Haplotype A architecture. Thus, among 33 monospore isolates studied, 17 had Tr01-Haplotype A architecture with 11 chromosomes, 11 isolates had 12 chromosomes, and three isolates had 13 chromosomes. The genomes of 33 monospore isolates of T. fuciformis Tr01 contained 1658 common BUSCOs, which were necessary for the survival of each monospore isolate. Type I, III, and IV aneuploids carried ~103–105 extra BUSCOs, at least 80 of which were required for monospore isolate survival (Fig. 5).
Table 3 Types of aneuploidy in monospore isolates of Tremella fuciformis Tr01Fig. 5
Venn diagram of BUSCOs. Yellow, green, and pink represent extra BUSCOs among Type I, III, and IV isolates, respectively. Blue represents common BUSCOs among 33 monospore isolates
Genomic biases of T. fuciformis Tr01 monospore isolatesOne interesting feature of T. fuciformis Tr01 is the disorder in basidiospore formation. The four-celled phragmobasidia with cruciate septa were commonly found with fewer spores than normal as shown in the micrograph of mature Tr01 fruiting bodies (Additional file 1: Fig. S11A). The four-celled phragmobasidia of Tr01 did not generate normal number of basidiospores (Additional file 1: Fig. S11B).
Among 33 T. fuciformis Tr01 single basidiospore isolates, 14 (42.4%) were aneuploids with one or two extra chromosomes. All of these aneuploidy exhibited Tr01-Haplotype A genomic architecture, whereas the extra chromosomes were derived from whole chromosomes or from recombination of chromosomes in the Tr01-Haplotype B genome. Another 17 isolates also featured Tr01-Haplotype A genomic architecture (Fig. 6A). Only isolates DBZ13 and DBZ47 (6%) exhibited Tr01-Haplotype B architecture (Fig. 6A). Genomic architectures of monospore isolates from Tr01 were predominantly homologous to the Tr01-Haplotype A nucleus.
Fig. 6
Genomic bias of monospore isolates from Tremella fuciformis Tr01. A Genomic sequence bias of each monospore isolate from T. fuciformis strain Tr01. B Sequence bias and homologous recombination events in each bin (100 kb/bin) of high-heterozygosity regions relative to the Tr01-Haplotype A genome. Upper part of the panel representing each chromosome: the height of blue bars represents the number of isolates from Tr01-Haplotype A source sequence (when more than half of isolates), and the height of orange bars represents the number of isolates from Tr01-Haplotype B source sequence (when more than half of isolates). Lower part of the panel representing each chromosome shows the number of homologous recombination events occurring in the corresponding bin. Colors also distinguish the relative numbers of homologous recombination events, from green for 0 though yellow, orange, and red for increasing numbers of such events
SNP calling in the Tr01-Haplotype A genome revealed that SNP densities in 1770 out of 2810 bins (10 kb/bin) were greater than 1%. These heterozygous bins were used to characterize the origins of sequences in the genomes of monospore isolates as having arisen during meiosis. All T. fuciformis Tr01 monospore isolates harbored both Tr01-Haplotypes A and B nuclear sequences, indicating that they are meiotic products of Tr01 (Fig. 6A). More than half of the genomic sequences of all isolates except for DBZ13 originated from the Tr01-Haplotype A nucleus (Fig. 6A). The genomes of DBZ13 and DBZ47 featured Tr01-Haplotype B architecture and 54 and 42% of their sequences, respectively, originated from the Tr01-Haplotype B nucleus. Approximately 5% of the bins of all aneuploid isolates were heterozygous, except for DBZ15, DBZ10, and DBZ46, and the ratio of extra chromosome length corresponded to their genome size (Fig. 6A). The extra chromosome of DBZ15 was composed only of Tr01-Haplotype B-specific regions. Loss of heterozygosity took place in the extra Chr12B region from 376 to 1134 kb in DBZ10, and in the extra Chr12B regions from 387 to 699 kb and 1006 to 1289 kb in DBZ46, which led to the percentage heterozygosity of bins in these isolates to be less than their ratio of extra chromosome length to genome size.
Nuclear sequence biases and inter-nucleus genetic exchange events in T. fuciformis Tr01 were investigated in the highly heterozygous regions in the Tr01-Haplotype A genome (100 kb/bin, Fig. 6B). Most sequences on Chr01, Chr02, and Chr07 in most isolates originated from the Tr01-Haplotype A genome. However, the sequences of bins Chr02:1–200,000, Chr03:1–400,000, Chr05:1,900,000–2,200,000, and Chr06:1,900,000–2,300,000 were biased towards those of the Tr01-Haplotype B genome and accounted for ~5% of genome size. Less sequence bias was detected in the regions Chr03:400,000–2,670,835, Chr06:1–1,900,000, and Chr08:700000–1,584,971. A total of 368 recombination events were detected at 277 recombination sites in the highly heterozygous regions of 33 monospore isolates (Additional file 2: Table S6). Both recombination events and sites were unevenly distributed in the whole T. fuciformis Tr01 genome (Fig. 6B). More recombination events occurred in bins with wide differences in nuclear sequence bias to their neighbors. Four or more monospore isolates underwent genetic exchanges at each of 16 recombination sites regarded as recombinant hotspots (Additional file 2: Table S6). Interestingly, some recombination sites were very close to each other. For example, only 15 bp separated the recombination sites Chr02A:142183–142201 and Chr02A:142217–142302.
留言 (0)