
記住我
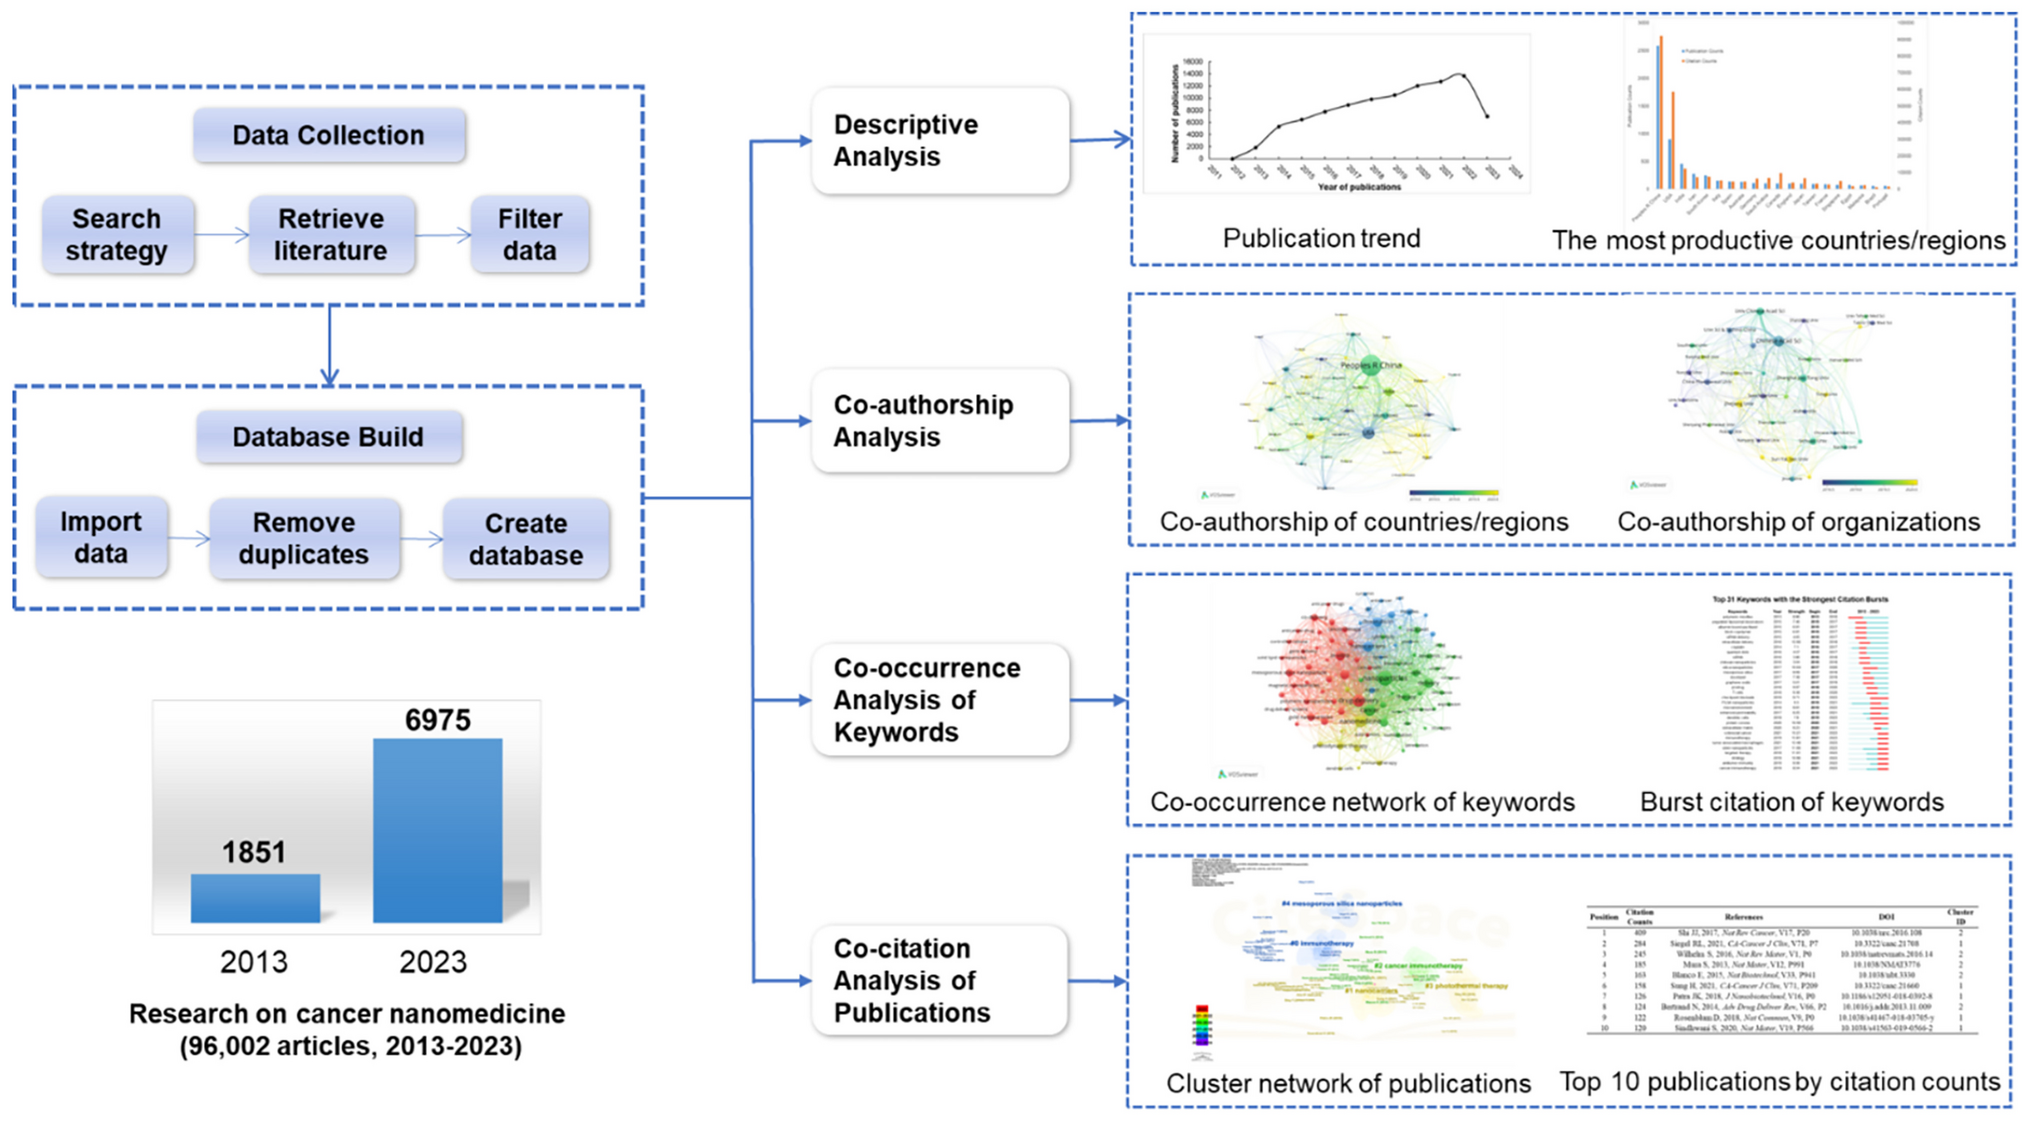
CLOP-loaded PLA-PUA/L-PCL-based cardiovascular grafts were developed via 3D printing. Due to the antithrombosis properties of CLOP [45], it may be used to inhibit blood clot development on the surface of biomaterials. Accordingly, four different types of vascular grafts were developed (Fig. 1), including a blank graft (containing no drug) and three types of CLOP-loaded grafts containing 5% w/w, 10% w/w, and 20% w/w of drug. According to prior research conducted by Stewart et al. (2021), the use of L-PCL in combination with other polymers, such as PLA, may speed up the rate of degradation of the implantable devices that are manufactured [46,47,48,49]. Furthermore, L-PCL enabled a more effective integration of CLOP into the highly viscous PLA-PUA matrix without the need for solvents (Fig. 1), as these are necessary when employing the electrospinning technique [50]. Indeed, it is possible for humans to be harmed by some types of solvents, in particular when they are used for implanted devices such as vascular grafts [15].
Fig. 1
Representative light microscope images of 3D-printed vascular grafts: A, B blank vascular grafts, C, D vascular grafts containing 5% w/w CLOP, E, F vascular grafts containing 10% w/w CLOP, and G, H vascular grafts containing 20% w/w CLOP. Scale bars: panels (A, C, E, G) 1 mm; panels (B, D, F, H) 2 mm
Microscope studyLight microscope images of the blank vascular grafts, along with three other types of CLOP-loaded vascular grafts that contained 5% w/w, 10% w/w, and 20% w/w, are shown in Fig. 1. No evidence of drug aggregation was seen on the surface of the 3D-printed grafts containing low drug concentration (5% w/w). However, drug crystals were observed on the graft surface for higher drug loadings, i.e., 10 and 20% w/w. Despite this, the drug was distributed homogenously throughout the manufactured CLOP-loaded vascular grafts. Moreover, the increased white-colour intensity of the grafts is providing a visual evidence of the higher drug loadings.
SEM was used to analyse the surface morphology and assess how the drug was distributed throughout the 3D-printed vascular grafts (Fig. 2), thus complementing the results obtained by using a light microscope (Fig. 1).
Fig. 2
SEM images of vascular grafts and their cross-section containing different drug concentrations. A, B Blank vascular grafts, C, D vascular grafts containing 5% w/w CLOP, E, F vascular grafts containing 10% w/w CLOP, G, H vascular grafts containing 20% w/w CLOP. Scale bar 2 mm
Blank vascular grafts had a smooth surface (Fig. 2). Alternatively, CLOP-loaded vascular grafts showed a higher surface roughness. However, this surface roughness followed a clear trend according to the concentration of CLOP available in the vascular grafts, i.e., the surface of 5% CLOP-loaded vascular grafts was closer to the blank vascular grafts rather than the higher drug loadings (10% and 20% w/w). As has been described in the literature, the drug concentration may have an effect on the surface morphology [24, 25, 51]. Moreover, cross-section images are not only corroborating the homogenous distribution of the CLOP throughout the vascular grafts but also show those drug crystals observed on the outer surface of the 3D-printed materials. Figure 2D and F illustrate the surface of the grafts with 5% w/w and 10% w/w CLOP concentration. The drug deposition on the surface of these two drug loadings is not as obvious compared to the graft with the highest drug cargo. However, the drug crystals can be seen clearly in the cross-section images for vascular grafts containing 10% w/w (Fig. 2).
On the other hand, from the higher magnification images of vascular grafts containing greater CLOP-loading (20% w/w), it can be understood that the CLOP is present in crystalline form, which remained the same in comparison to the CLOP pure powder.
FTIR spectroscopyAn FTIR analysis was carried out in order to study possible drug-polymer interactions within resulting 3D-printed vascular grafts. The FTIR spectra obtained from the different vascular graft formulations and the pristine CLOP powder are represented in Fig. 3A. The FTIR spectrum of pure CLOP powder is showing a strong characteristic peak at 1752 cm−1 owing to C = O stretching vibrations. Moreover, an O–H stretching band was observed at 3012 cm−1 due to the hydrogen sulphate moiety. Additionally, the band at 3121 cm−1 is due to the stretching vibrations of aromatic C–H bonds, as previously reported in the literature [52, 53]. On the other hand, the FTIR spectra of blank vascular grafts indicated distinctive peaks at 2934 cm−1, 2868 cm−1, which are attributed to C–H stretching, and 1724 cm−1, which is attributed to the C = O stretching [54].
Fig. 3
FTIR spectra of CLOP powder and 3D-printed vascular grafts containing different drug loadings (A); magnified carbonyl peak of 3D-printed grafts (B)
It is interesting to note the characteristic peak of the pure drug was observed in the spectra of the CLOP-loaded 3D-printed vascular grafts. The intensity of these peaks is proportional to the drug cargo of the vascular grafts. Moreover, the carbonyl peak for CLOP (ca. 1750 cm − 1) in the vascular grafts shows a slightly lower wavenumber than the pure CLOP. This is consistent with H-bond interactions between CLOP and the polymers in the vascular graft [55]. In addition, it seems that no chemical reactions occurred between the drug and the polymers during the 3D printing procedure since no new peaks were observed.
Thermal analysisThermal analysis was used to try to establish if there was any interaction between the polymer and CLOP. TGA analysis (Fig. 4A) showed that when CLOP was combined with the PLA-PUA/L-PCL-based matrix by using 3D printing technology, the resulting material had a different thermal degradation behaviour in comparison with the ones containing no CLOP. Indeed, the Tonset of the blank grafts was 286 °C, while the Tonset of the CLOP-loaded vascular grafts was decreasing as the concentration of CLOP was increasing up to 20%. Moreover, the lowest Tonset was recorded for CLOP powder (209 °C), thus being the drug more thermolabile than the polymer. Similar results have also been described for different drug-loaded polymeric-based matrix [49, 56, 57].
Fig. 4
DSC analysis of 3D printing PLA-PUA/L-PCL-based vascular grafts containing different CLOP loadings and CLOP powder (Exo up) (A), TGA thermograms of CLOP powder and 3D-printed PLA-PUA/L-PCL-based vascular graft containing different CLOP loadings (B). XRD diffractograms of pure CLOP powder and 3D-printed materials containing different CLOP loadings (C)
To further investigate these interactions between PLA-PUA/L-PCL and CLOP, DSC analysis was also performed (Fig. 4B). The CLOP DSC curve displayed a characteristic endothermic melting point at a temperature of 180 °C, confirming the drug’s crystalline nature. As expected, this peak was not found in the blank vascular grafts, but neither in the ones that included 5% and 10% w/w of CLOP. Moreover, the DSC thermogram of the 3D-printed vascular graft containing 20% w/w of CLOP showed a very small endothermic peak at 180 °C, which coincides with the melting point of the drug. These results are thus indicating that the formulation of PLA-PUA/L-PCL-based CLOP-loaded vascular grafts considerably reduced the drug crystallinity, which correlated with improved drug solubility. Similar findings have been reported for different polymeric drug-loaded formulations [48, 58,59,60].
As previously shown in Fig. 2, CLOP particles were found in the SEM images for grafts containing 10 and 20% CLOP; thus, it can be assumed that the amount of crystalline drug is too small to be detected using DSC [59]. Accordingly, an XRD analysis was performed to further determine CLOP crystallinity.
XRD analysisXRD diffractograms of pure CLOP, blank PLA-PUA/L-PCL, and CLOP-loaded PLA-PUA/L-PCL 3D-printed samples are presented in Fig. 4C. CLOP crystallinity when formulated into a 3D-printed vascular grafts implant was evaluated by comparing the peaks observed on their diffractograms with the peaks detected on the diffractogram of pure CLOP. Many distinct peaks in the diffractogram of CLOP were observed at the 2θ diffraction angles of 9.15, 13.44, 14.07, 18.57, 18.69, 22.54, 23.82, and 26.79, indicating that CLOP is presented as a crystalline form. However, the XRD diffractograms of the blank 3D-printed samples showed no diffraction peaks, indicating that the polymeric matrix has an amorphous structure. Interestingly, the diffraction pattern of pure CLOP powder was not found in the diffractograms of the samples containing 5% w/w CLOP cargo. This is presumably due to the result of the interaction between CLOP and PLA-PUA/L-PCL matrix, which lowers the crystallinity of CLOP in the formulation and, as a result, indicates the transformation from a crystalline to an amorphous state and also a uniform distribution of the drug within the polymer. On the other hand, it seems that CLOP exhibits some degree of crystallinity in samples containing 20% w/w and 10% w/w of the drug. This is quite clear in the highest drug loading (20% w/w) of the samples, and it is possible to verify it for the samples containing 10% w/w CLOP due to the existence of minor CLOP peaks at around 22°.
Based on the obtained results, it can be understood that the majority of the CLOP may have been dissolved in the polymer matrix to produce amorphous dispersions, while only a small amount of the drug could have remained in crystalline form. Shitole et al. [61] have reported similar results for CLOP in polyurethane/polyethylene glycol matrix. These findings, therefore, provide additional evidence to support the drug-polymer interactions that were established before by SEM, FTIR, and thermal analysis.
Mechanical propertiesThe 3D-printed samples were subjected to tensile mechanical testing (Fig. 5A). According to the obtained values for the strain at failure, materials composed of only PLA-PUA/L-PCL (blank) had a higher elasticity (Fig. 5B). Nevertheless, in comparison to the other samples, the samples that contained 20% CLOP w/w demonstrated the lowest degree of strain. However, this difference was not significant. Moreover, the elasticity of these materials falls within the range of the common materials employed for the production of synthetic vascular grafts or natural blood vessels [62, 63]. The strain at failure of the blank materials is higher than the values obtained for the CLOP cargo materials. Nevertheless, these outcomes resemble those attained for human blood vessels (10–105%) [64].
Fig. 5
A Representative stress/strain curves for the CLOP-loaded 3D-printed materials, B strength at failure, C elastic modulus, D ultimate tensile strength, (means ± SD, n = 3)
Considering the elastic modulus results, it can be understood that the addition of the CLOP to the polymeric PLA-PUA/L-PCL matrix render stiffer materials than pristine PLA-PUA/L-PCL-based materials (Fig. 5C). It is interesting to note that 3D-printed materials that were developed containing 20% w/w CLOP demonstrated greater stiffness than the other prepared samples. This implies that the material’s stiffness is improved by the presence of CLOP at the higher concentration (20% w/w). It can be mentioned that the elastic modulus values increased as CLOP cargo was increased. This is in line with earlier findings detailing possible interactions between the drug and the polymer matrix discovered through thermal analysis and XRD [26, 28]. Native blood vessels have an elastic modulus of 0.3–1.5 MPa [65], which is comparatively lower than the elastic modulus of the materials obtained in this study. However, in comparison to the elastic modulus of synthetic polymers, which are clinically used to create vascular grafts, such as Dacron (14,000 MPa) or poly(tetrafluoroethylene) (500 MPa), the 3D-printed PLA-PUA/L-PCL-based composites had a considerably lower elastic modulus. Furthermore, the elastic modulus of the PLA-PUA/L-PCL materials is lower than PLA and PCL alone, which have an elastic modulus of 350 MPa and 1–4 GPa, respectively [65].
The ultimate tensile strength of the obtained 3D-printed materials was also measured, and the results are presented in Fig. 5D. The materials containing 5% w/w CLOP had a higher tensile strain in comparison to the other two CLOP loadings (10% w/w, 20% w/w), as well as the blank materials. However, this difference is not significant across all the four formulations. On the other hand, compared to poly(ethylene terephthalate) (170–180 MPa) or poly(tetrafluoroethylene) (14 MPa), the ultimate tensile strength of the obtained 3D-printed materials was considerably lower [65]. However, similar results were reported in the literature for PCL-based materials, which contained a different antiplatelet drug, such as dipyridamole [26]. Furthermore, the obtained values corresponded to the tensile strengths of blood vessels (1.4–11.1 MPa) [65].
Drug release studyAs mentioned previously, CLOP was loaded in the biomaterials to prevent blood clot formation in the surface of the graft. The anticoagulant activity can be achieved by retaining the drug in the surface of the graft [57, 66]. However, drug released will play a role in the prevention of blood clot formation. Therefore, CLOP release from 3D-printed vascular grafts in PBS (pH 7.4) with 0.1% w/v Tween 80 was assessed over a 27-day period and is illustrated in Fig. 6. An initial burst release was observed for 5% w/w and 10% w/w CLOP-loaded vascular grafts within the first 24 h, which was extended to 48 h for samples containing higher CLOP cargo (20% w/w).
Fig. 6
CLOP release from different vascular grafts as a function of time
Three-dimensional–printed vascular grafts containing 20% w/w CLOP had a faster release in the first 10 days, but after that, the release slowed to a steady pace that lasted up to 27 days. Meanwhile, these two zones were not seen in vascular grafts with 5% w/w and 10% w/w CLOP. Moreover, after 27 days, there was a significant increase in drug release proportionate to a rise in drug cargo from 10 to 20% (p < 0.05), but no such increase was observed with a rise in drug loading from 5 to 10% (p > 0.05). The maximum drug release was 1.04 mg which accounts for 11.62% of CLOP with respect to the initial drug loading (Fig. 6) and was seen in the vascular grafts containing 20% w/w CLOP, which may be due to CLOP being more readily available and diffusing out more easily than in vascular grafts with lower drug loadings (5% and 10% w/w). Furthermore, the release pattern shows that the drug-loaded vascular grafts containing 20% w/w of the drug maintain an increasing release rate. In contrast, the 10% w/w and 5% w/w drug-loaded vascular grafts have reached a plateau state after 10–11 days. While one can postulate that the CLOP could interact with the PLA-PUA/L-PCL matrix that is included inside the 3D-printed grafts, inhibiting a greater amount of drug release, this holds true in light of the findings that were discussed in the prior sections. It is important to highlight that the total amount of drug released from grafts containing 5% CLOP is slightly higher than the amount of drug released from grafts containing 10% CLOP. This could be potentially explained by considering previous results regarding drug crystallinity. It has been extensively reported that a more stable drug crystalline form presents a reduced driving force for dissolution when compared with an amorphous drug [67]. Grafts containing 5% CLOP showed a lower degree of drug crystallinity than grafts containing 10% CLOP. Therefore, the drug in grafts containing 5% CLOP will have a faster dissolution profile. Additionally, the results obtained here differ from those reported for other vascular grafts described in the literature loaded with CLOP [61]. These grafts were prepared using electrospinning rather than 3D printing, presenting a high surface area that allows more efficient solvent access and higher drug release. Moreover, as the drug is dissolved with the polymers prior to the production of the grafts, it was in an amorphous form. However, the overall method requires the use of organic solvents, which could pose toxicity issues. Finally, it is worth mentioning that the amount of drug that persists on the surface of the grafts is what really counts in the case of vascular grafts since the surface is in direct contact with the blood and the presence of an antithrombotic drug on the surface helps in the prevention of blood clot formation.
Platelet adhesion studyAssessing how blood platelets react to different biomaterials is one of the most prevalent techniques for determining how blood and biomaterials interact with one another. It is widely acknowledged that platelets may play a crucial role in the initiation and progression of the coagulation cascade when blood interacts with a foreign material surface. This cascade has the potential to end up forming a fibrin clot [28, 68]. Therefore, platelet deposition on the surface of the vascular grafts was evaluated using rabbit PRP. Figure 7 shows representative SEM images adhered to the surface of the blank and CLOP-loaded 3D-printed samples. The outcomes demonstrated a substantial reduction in platelet deposition across all CLOP-loaded materials compared to the blank materials without the drug. In brief, no platelets were observed on samples containing 5, 10, and 20% w/w CLOP, while plenty of platelets were deposited on the surface of the blank materials, as can be observed in Fig. 7. The results indicate that the existence of CLOP hinders the attachment of platelets to the surface of the vascular grafts. Furthermore, the reduction in the number of adhered platelets in the CLOP-loaded 3D-printed materials are in line with the reported data on electrospun scaffolds made of PCL and biodegradable elastic polyurethane, loaded with aspirin and dipyridamole, respectively [24, 28].
Fig. 7
SEM images of vascular grafts surface representing platelet adherence. A–D The plasma-treated samples and E–H the non-plasma-treated samples. All the images were taken under 2K magnification
Coagulation assessmentIn order to assess the thrombogenicity of the materials used for the manufacture of implantable devices, a coagulation test was performed [69]. Clot development was evaluated at two different time intervals to determine the required time for a blood clot to form. Figure 8A demonstrates that rabbit blood did not clot on its own during the first 30 min; however, a minor clot was found for the lower drug loadings (5 and 10% w/w) after 30 min. Nevertheless, a full clot was found for the same samples after 45 min (Fig. 8B). Interestingly, no blood clot was obtained after the longer incubation time tested (45 min) by using the sample with the highest drug loading (20% w/w). Therefore, these results clearly indicate that the presence of CLOP in higher concentrations can prevent blood clot formation. Moreover, the absorbance results at 545 nm for all the blood solutions are illustrated in Fig. 8C.
Fig. 8
Blood coagulation experiment at A 45-min time point and B 30-min time point were 1: 50 µL blood and 1.5 mL water, 2: 50 µL blood, 5 µL CaCl2, and 1.5 mL water, 3: 50 µL blood, 5 µL CaCl2, 1.5 mL water, and blank sample, 4: 50 µL blood, 5 µL CaCl2, 1.5 mL water, and 5% drug sample, 5: 50 µL blood, 5 µL CaCl2, 1.5 mL water, and 10% drug sample, 6: 50 µL blood, 5 µL CaCl2, 1.5 mL water, and 20% drug sample. C Coagulation test results displaying absorbance of a solution containing blood at 545 nm for different samples after 30 and 45 min of incubation. D Haemocompatibility of CLOP containing 3D-printed samples, blank, and the positive and the negative controls
Haemocompatibility studyThe manufactured materials developed in this study are intended to be used as vascular grafts. Thus, the haemocompatibility assay of 3D-printed products was performed in order to assess the compatibility of the 3D-printed materials with blood. The results of the haemocompatibility assay are presented in Fig. 9. Although the 3D-printed samples containing the highest drug loading (20% of CLOP) showed the highest haemolysis percentage (3.4 ± 0.7), haemolysis levels were below 5% in all the samples. According to the literature, samples are considered to be haemocompatible if they exhibit less than 5% haemolysis [70].
Fig. 9
In vitro cytocompatibility, HUVEC attachment on the surface of the blank, 5%, 10%, and 20% loaded materials 8 h post seeding. Scale bar = 200 µm (A). Live staining with NucBlue Stain showed HUVEC viability on the surfaces of all samples for up to 48 h following the attachment period. Scale bar = 500 µm (B). Following the attachment period, HUVEC growth was assessed using a CyQUANTTM NF Cell Proliferation Assay for up to a total of 48 h. (n = 3)
Huvecs growthThe biocompatibility of the drug-loaded grafts was determined by culturing HUVECs onto the different samples for a total of 72 h. As can be seen in Fig. 9A, despite the different compositions, cells readily attached to all grafts within the 8-h initial attachment period, with no noticeable differences between scaffolds. To evaluate the ability of the scaffolds to support cell adherence, viability, and growth, scaffolds were evaluated at 24 and 48 h post the attachment period. Live staining with NucBlue® Live ReadyProbes®, a live nuclear stain that fluoresces blue when bound to DNA, confirmed the attached cells were functional and alive and the grafts to be non-cytotoxic (Fig. 9B). While all graphs supported a vast number of functional cells, both 24- and 48-h cells appeared to densely cover a greater total distance of the grafts proportional to the loaded drug content.
Nevertheless, an observable increase in stained cells was observed at the later time point across all sample types, suggesting the scaffolds provided an opportune environment for cell growth. To further assess whether the scaffolds provided a suitable milieu for cellular accommodation, a CyQUANT NF cell proliferation assay was performed at the two time points. As seen in Fig. 9C, a statistically significant increase in cell growth was detected at both the assessed time points between the blank and drug-loaded grafts, with the highest cell growth being observed in the grafts with the highest drug content. Moreover, at the 48-h time point, aligning with the observed differences, a significant increase in cell growth was observed proportionally with drug content.
留言 (0)