
Remember me


A comprehensive electronic search based on the previously mentioned approach retrieved 3437 articles from PubMed, Embase, and Web of Science. A further 31 publications were found after the reference list of the chosen articles was additionally examined to find pertinent studies. After using EndNote X9 reference management software to eliminate 362 duplicate citations, a total of 3106 citations were chosen for screening.
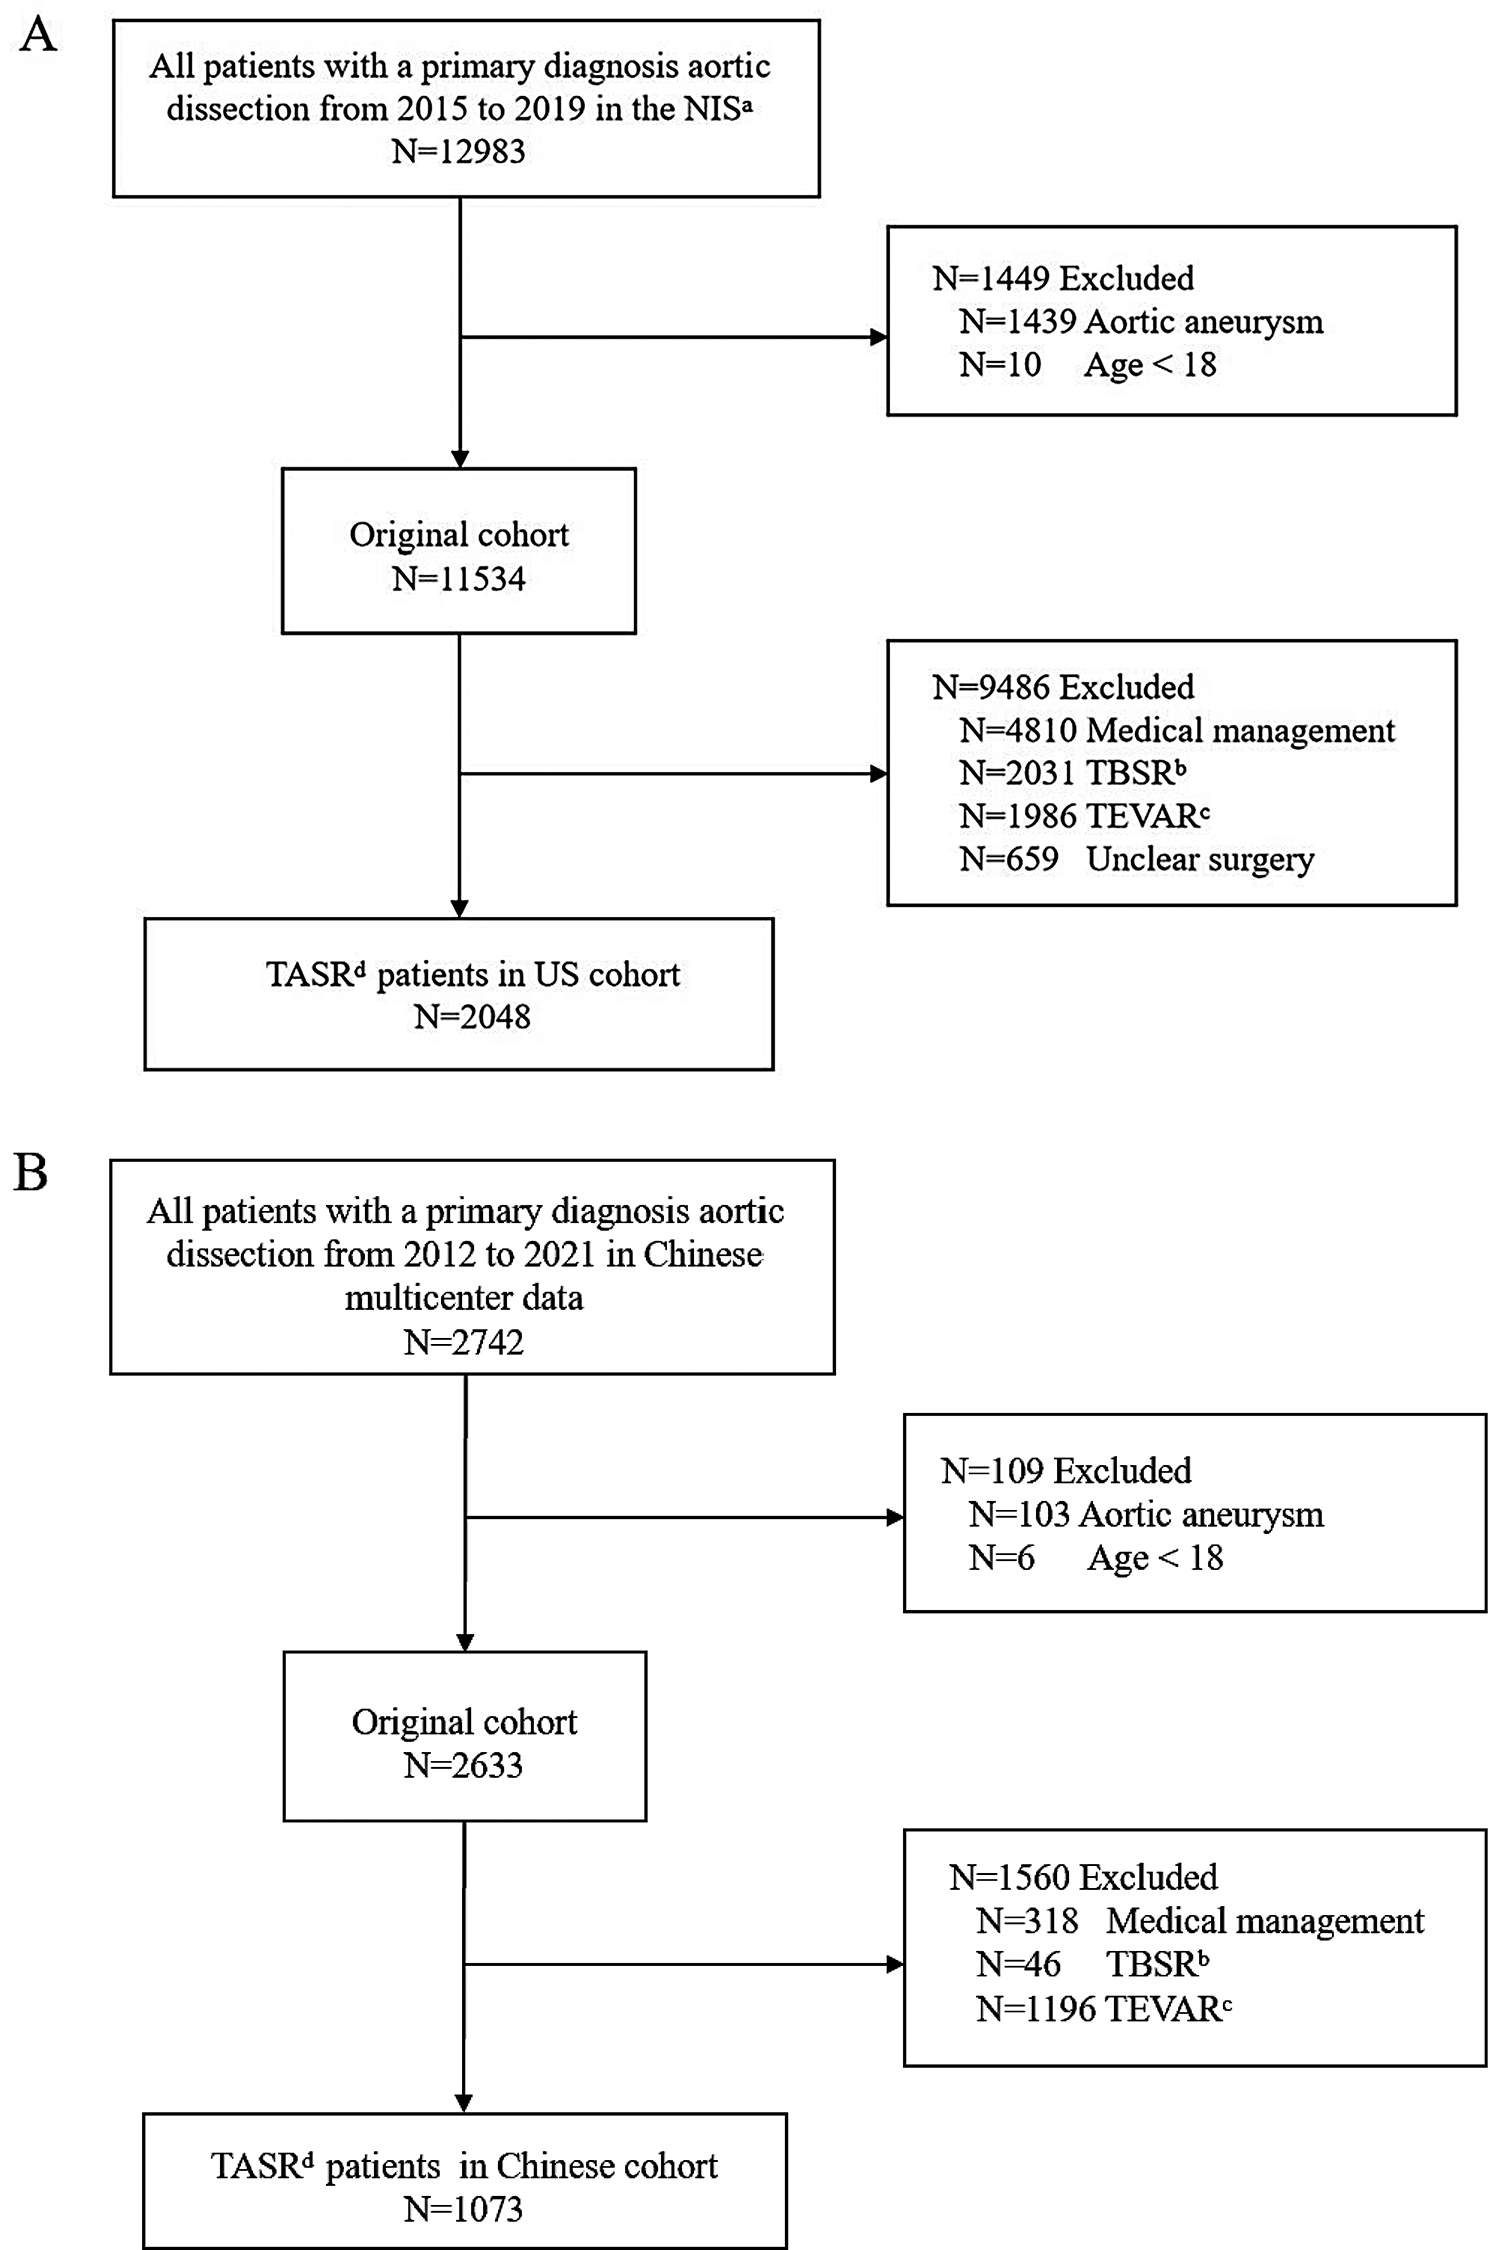
Characteristics of included studiesOn the basis of the abstract and title, 2897 irrelevant citations were eliminated. After further assessment of the full text of the remaining citations, 187 were excluded because they did not meet the enrolment criteria. Therefore, based on our search, 22 studies [9,10,11,12,13,14,15,16,17,18,19,20,21,22,23,24,25,26,27,28,29,30] with 3332 patients were found to be eligible. Figure 1 shows a Prisma graphic that details the flow of study identification.
Fig. 1
The PRISMA flow diagram shows the identification of the sequential steps in the study selection process, illustrating the identification of 3437 records and the gradual selection leading to the inclusion of the final 22 articles
Figure 2 shows the timeframe for the development of heart valve prosthesis. 10 innovative mitral valve bioprostheses were able to advance to the First-In-Human clinical trial stage and beyond over the course of 50 years.
Fig. 2
The timeline illustrates the commercialization and commencement of trials for First-In-Human (FIH) and early clinical assessments of heart valve prostheses spanning from 1950 to 2018. The upper section represents the evolution of mechanical heart valve prostheses, while the lower section showcases various biological mitral prostheses. Mechanical prostheses are grouped into four categories: (i) Ball in valve/cage (sky blue), (ii) Non-tilting disk (green), (iii) Tilting disk (yellow), (iv) Bileaflet (red). Biological prostheses are classified into six categories: (i) Autografts (blue), (ii) Homografts (orange), (iii) Porcine (purple), iv) Pericardial (ash), (v) Sutureless (pink), and (vi) Stentless (light green). NB: *indicates currently discontinued, and ^signifies currently available
Our included studies were divided into 3 subcategories, allowing us to compare and contrast the traits and results of each subgroup. One of Carpentier-Edwards, three Medtronic valves, and the Quattro valve had multiple papers reporting on the same valve. The valves were the Carpentier-Edwards 3rd generation supra-annular valve [9, 10], Medtronic Mosaic [19, 23, 27, 30] Medtronic Intact [11, 12, 17], Medtronic Hancock II [14, 24], Quattro Valve [18, 26]. Even though the same valve was reported, the studies were divided into various author-defined groups, with mean values that were representative of that group (older generation, FIH, or early phase clinical trials). It was made sure that the trials featured separate institutes and, as a result, a distinct group of patients for those investigations designated inside the same subgroup.
The older, FIH, and initial clinical trials average duration was 4.57 years, 2.85 years, and 8.05 years, respectively. The average number of patients who underwent mitral valve surgery in the older FIH and initial clinical trials was 163, 31, and 154, respectively. The average follow-up duration of the older FIH and initial studies was 4.85 years, 2.3 years, and 4.21 years respectively (Table 1). As a result, the FIH studies often enroll fewer patients and have shorter study and follow-up, which is consistent with the criteria of Phase I of the clinical trial testing for adverse effects. With the exception of Riess et al. [27] (70%) in all studies, the follow-up completion rate is above 91% [27].
Table 1 Characteristics of the included studiesPreoperative demographics of patientsThe average patient age of the older generation, FIH, and initial studies were 55.75, 61.06, and 67.44 years respectively, with the mean age for each study ranging from 39 to 73 years old. Only 2 out of 6 of the older studies reported preoperative NYHA Class of their patients, while all FIH and initials studies did so. All the data were reported as percentages per NYHA Class, except as an average Class in Mohr et al. [18] (Table 2).
Table 2 Preoperative demographics of patientsIndications for surgeryData on the indication for surgical mitral valve replacement is shown in Fig. 3, which displays the number of patients undergoing surgery.These are grouped into the following categories: mitral insufficiency, rheumatic disease, endocarditis, congenital/traumatic/ischemic disease, degenerative disease, mixed lesions, and others.
Fig. 3
An illustration of the indications for mitral valve replacement surgery using a unique implantable biological mitral valve prosthesis is shown in the pie chart. Rheumatic stenosis and degenerative mitral insufficiency made up the majority of the study’s causes
Mitral valve prosthesis sizeData on prosthesis sizes were present in 12 out of the 22 studies (Additional file 1: Table S2). However, Loisance et al. [13], Garcia et al. [15], Riess et al. [27] were not included in Additional file 1: Table S2 as they only mentioned that valves implanted were of sizes 27 mm and 29 mm without providing data on the exact number of patients that had each valve implanted. Jamieson [28] was also not included as the percentages reported under each prosthesis size did not correlate with the absolute number of patients. Figure 4 shows the number of patients with mitral valve replacement with prosthesis sizes ranging from 21 to 37 mm. A 29 mm size was inserted in 197 patients. The lowest prosthesis size used was 25 mm whilst the highest was 31 mm.
Fig. 4
The bar graph shows how biological mitral valve replacement prostheses that have recently been implanted are being used. Insight into the patterns of size preferences in clinical practice is provided by the distribution of various sizes that have been used
Hemodynamic profile of mitral valve prosthesisThe most commonly reported haemodynamic data were effective orifice area (EOA), mean diastolic gradient (MDG), peak diastolic gradient (PDG) found in (Additional file 1: Table S3). Nevertheless, only 12 out of 22 studies reported these data. Of these 12 studies, hemodynamic data were most commonly reported in the following time frame after implantation: postoperative (3/12), one year (3/12), and five years (3/12). Instead of directly stating the values for hemodynamic data, some studies [28, 29] used only graphical representation to report hemodynamic data. For example, Wheatley et al. [16] used graphs to accompany numerical values stated in prose form.
Regarding the remaining 10 articles without haemodynamic data, four [11, 13, 17, 26] published their data separately whilst one [14] claimed that it was due to its preliminary nature and another [22] justified the absence of haemodynamic quantification due to its focus on structural valve deterioration and long-term durability.
Morbidity and consequences of morbidityAccording to the Levene’s test of homogeneity of variances (Additional file 1: Table S4A), outcomes such as reoperation, late mortality, thromboembolism, haemorrhage, and endocarditis showed non-uniform variances. Early deaths (p = 0.008), SVD (p0.001), and periprosthetic leak (p0.001) all showed heterogeneity in the test of variance. However, no category exhibiting homogeneous variance showed significantly different results across the three groupings. The three outcomes stated in Additional file 1: Table S4B were examined using Welch ANOVA, and the results showed no statistically significant differences among the three subgroups in any category. One-way ANOVA analysis was performed on the remaining outcomes with homogeneous variances, as shown in Additional file 1: Table S5. Additionally, the subgroup analysis found no notable variations across the groups.
Comments (0)