
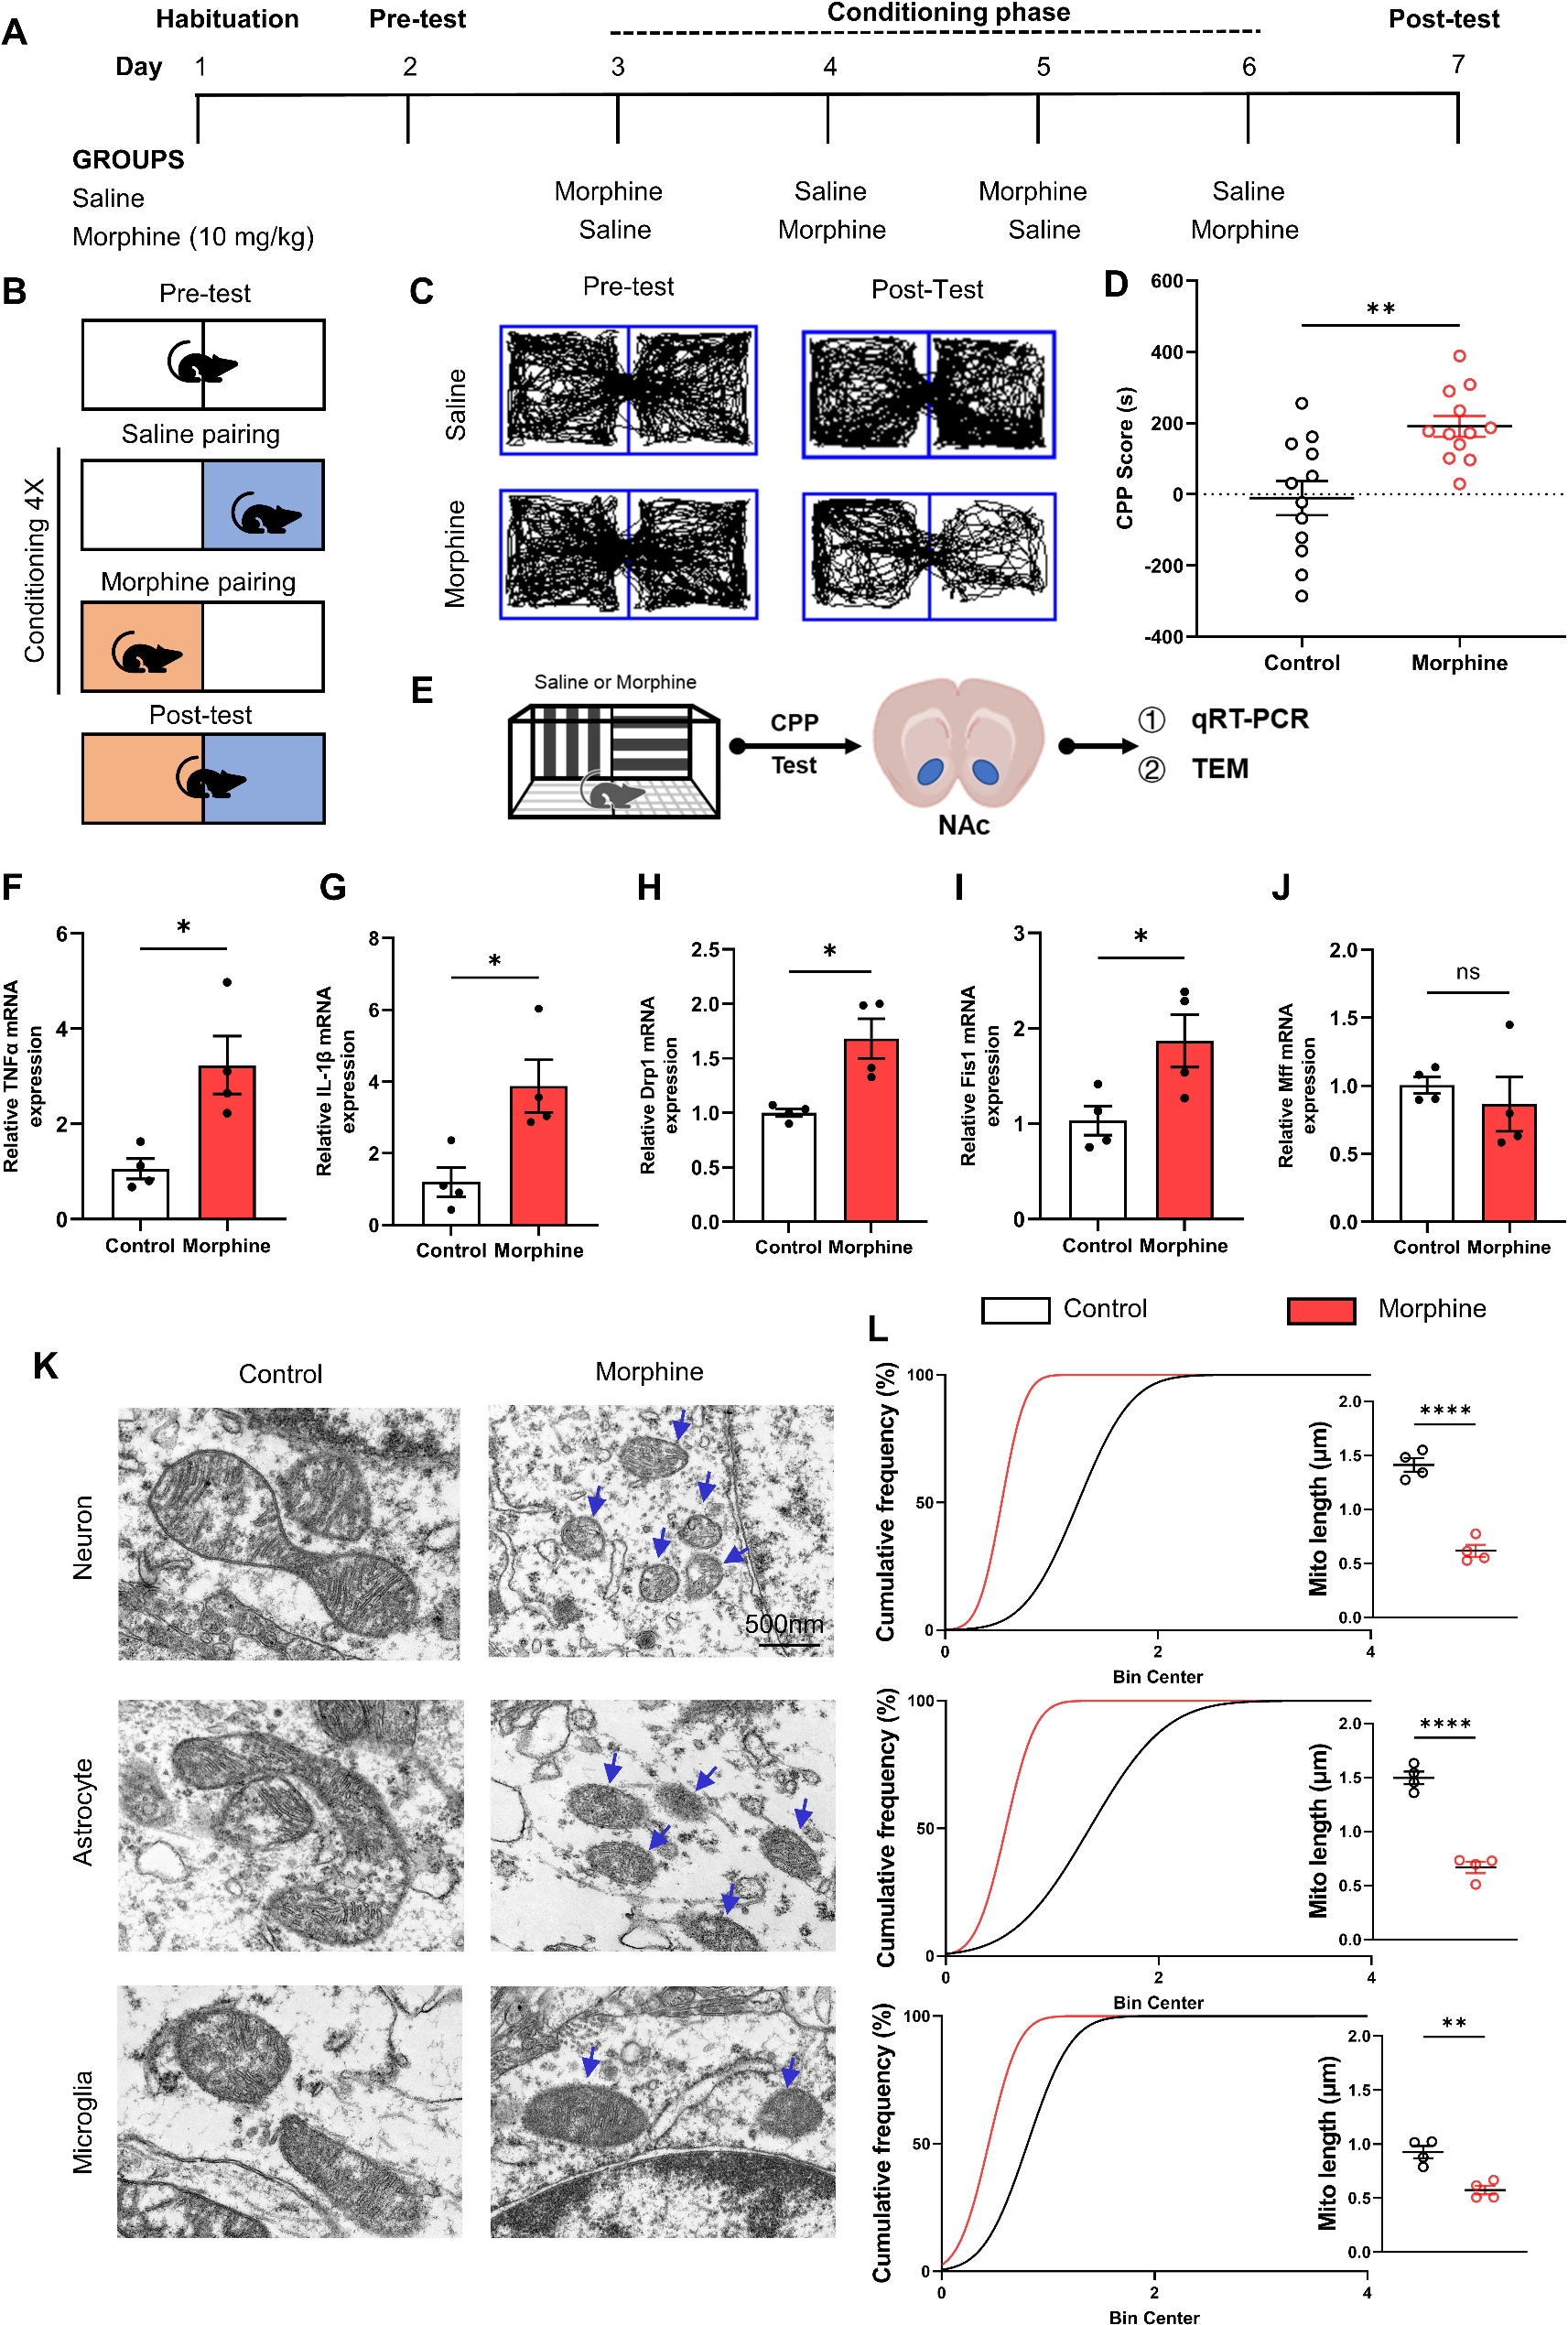
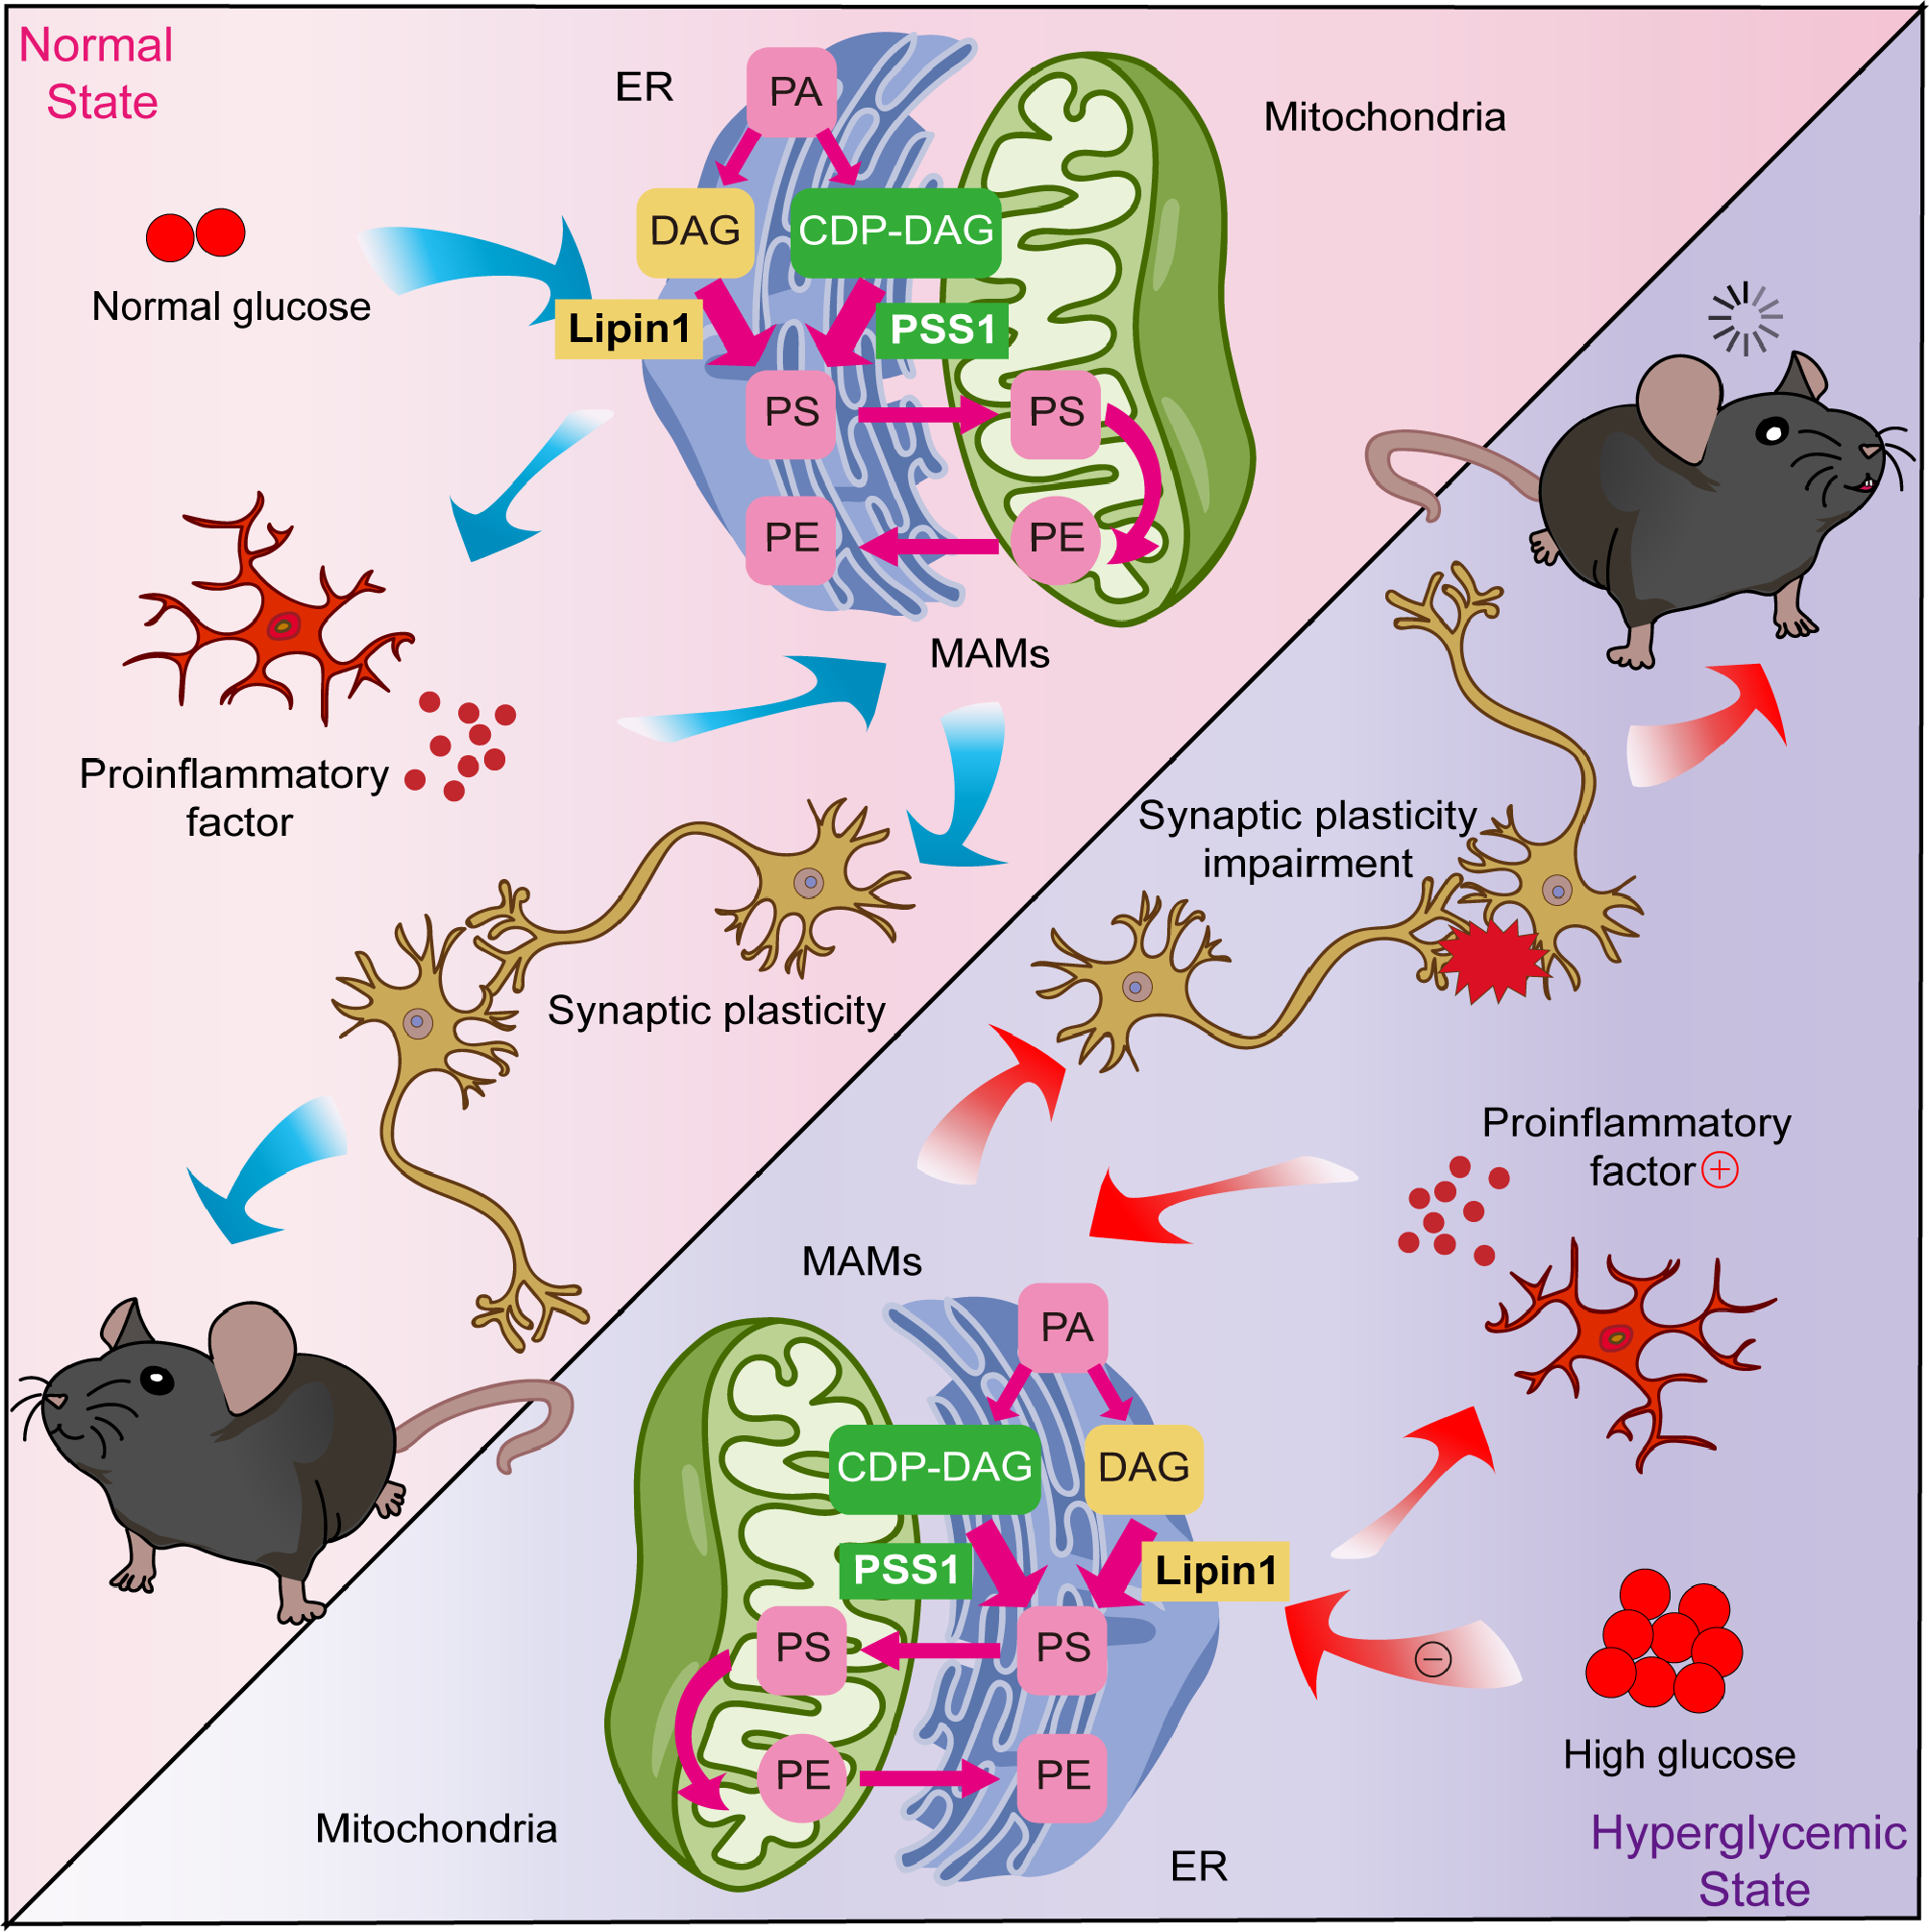
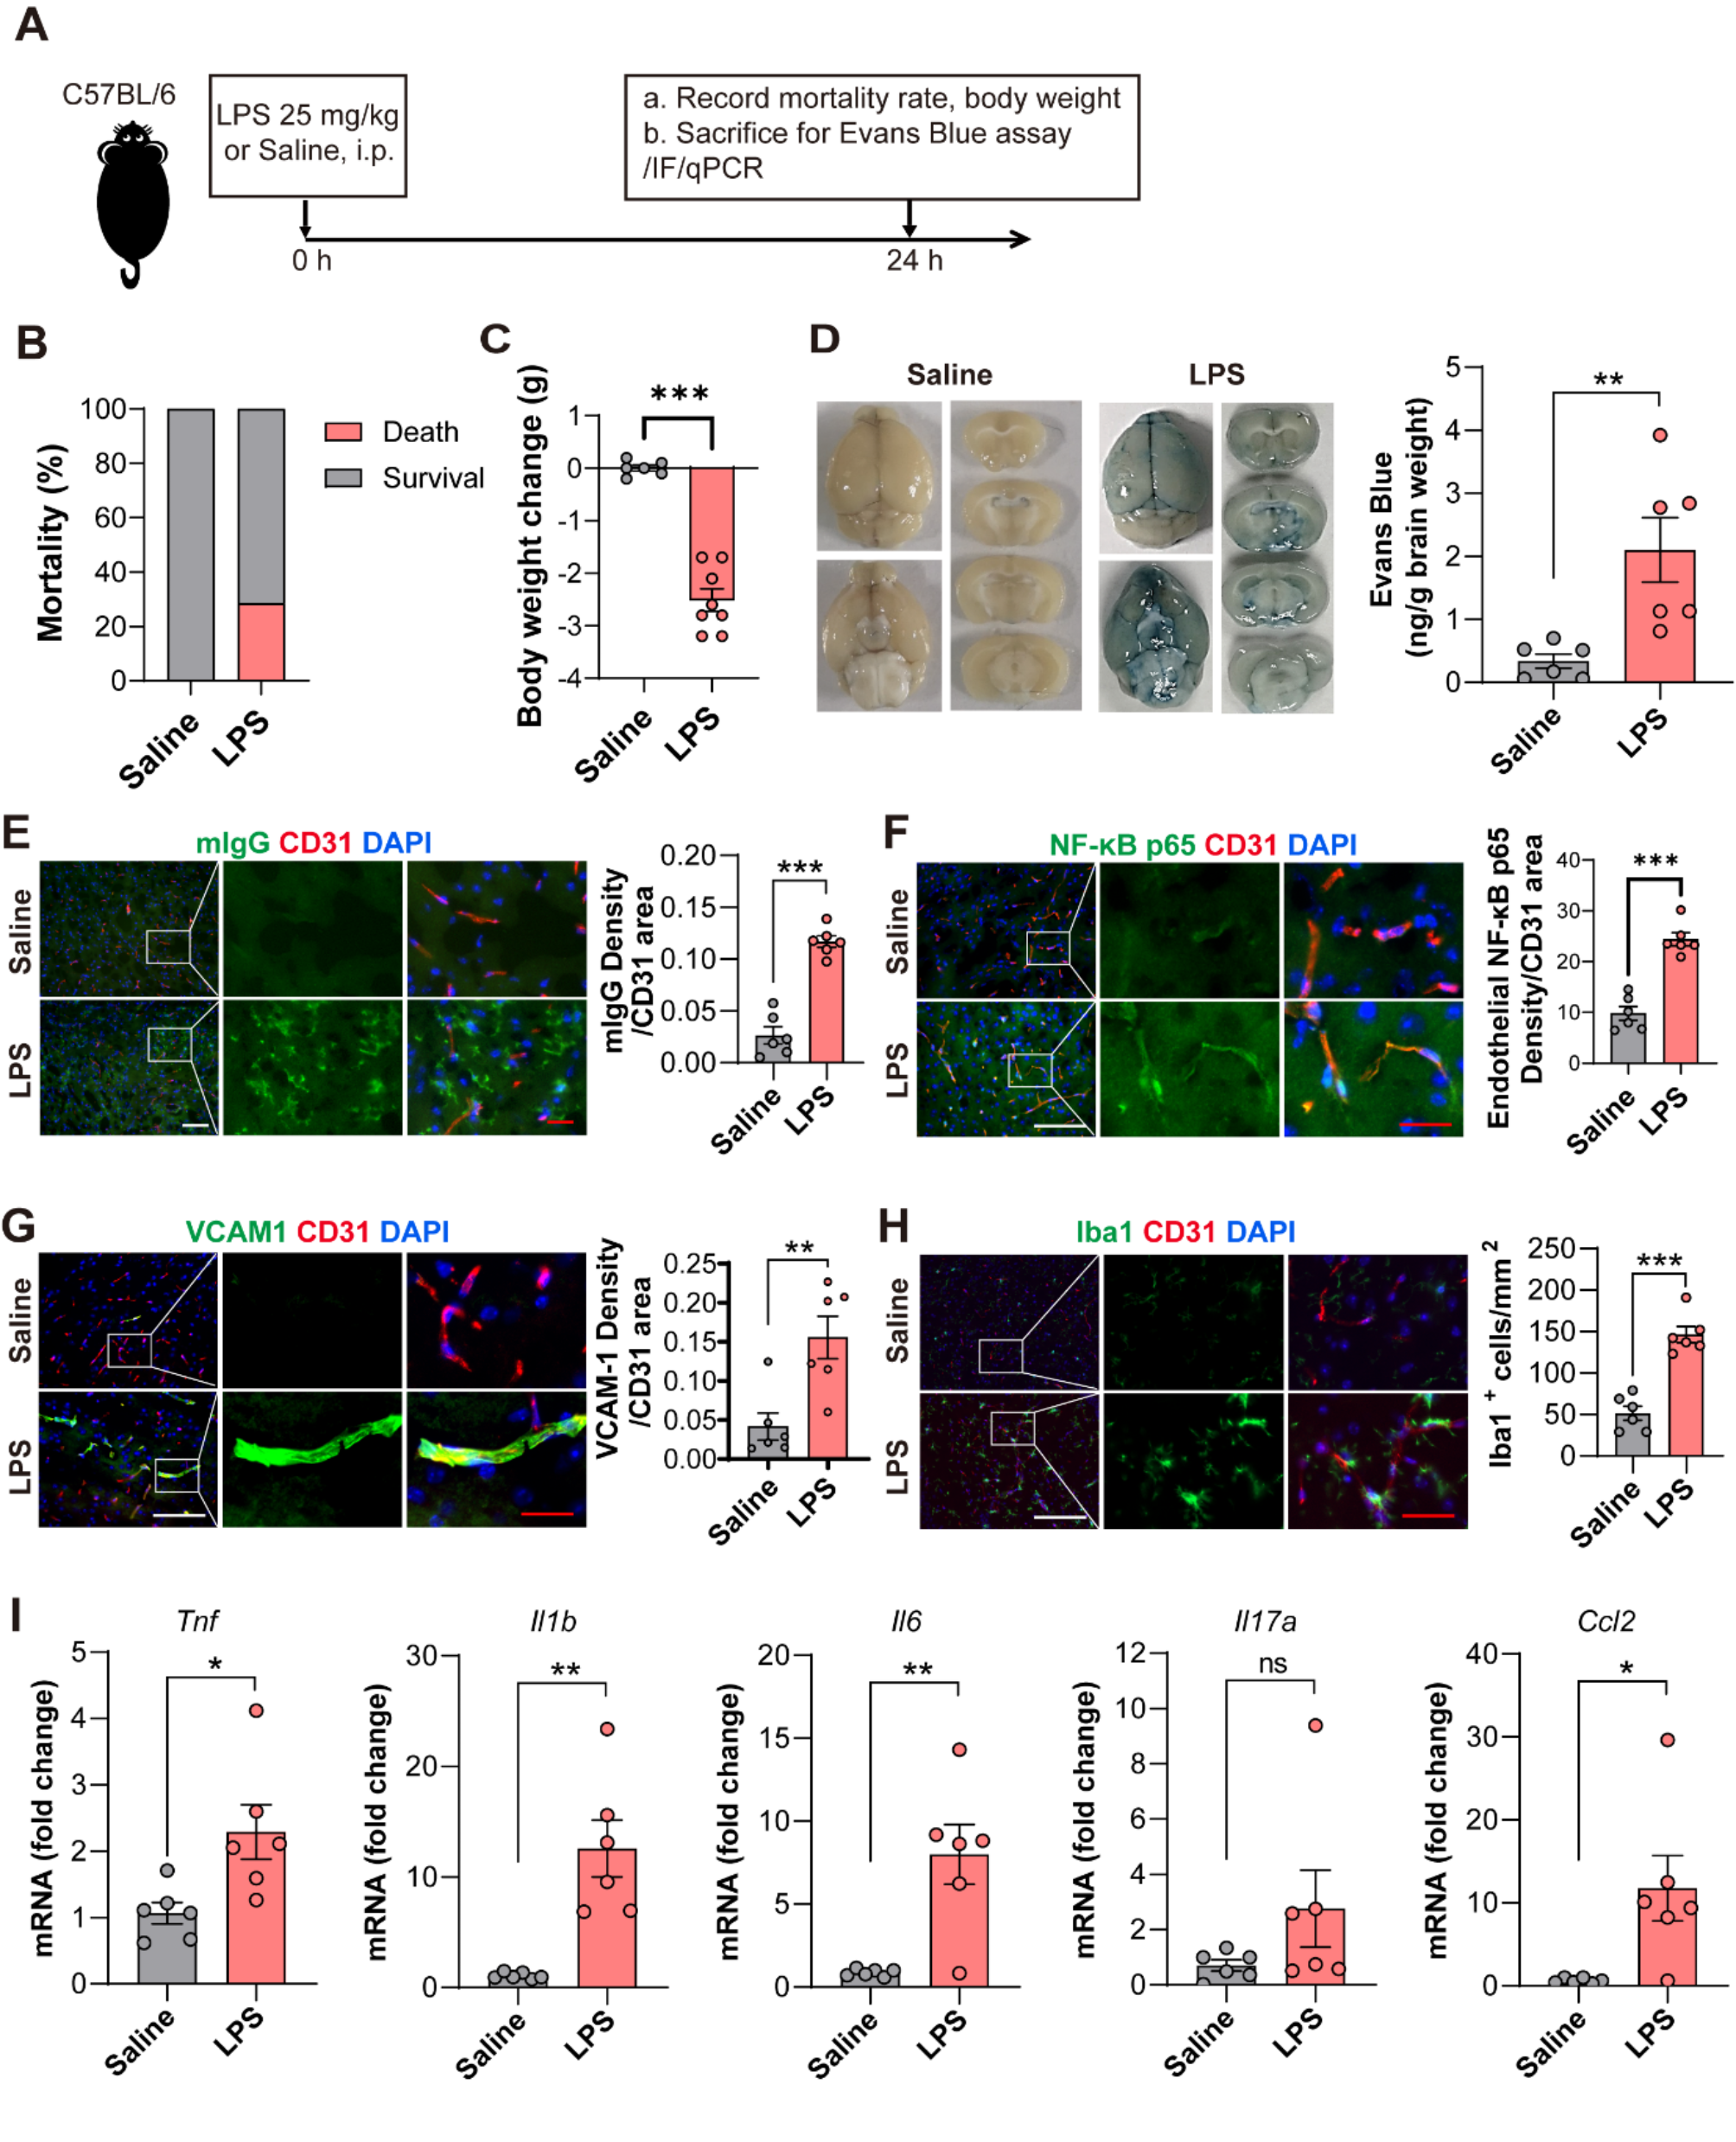
Remember me


Western blotting was applied to examine the change in Lrg1 expression in the brain during cerebral ischemia‒reperfusion injury. As shown in Fig. 1A, during cerebral occlusion, Lrg1 was upregulated in the ischemic brains, and expression gradually increased with longer reperfusion injury. High Lrg1 expression continued until 24 h after reperfusion (Fig. 1A).
Fig. 1
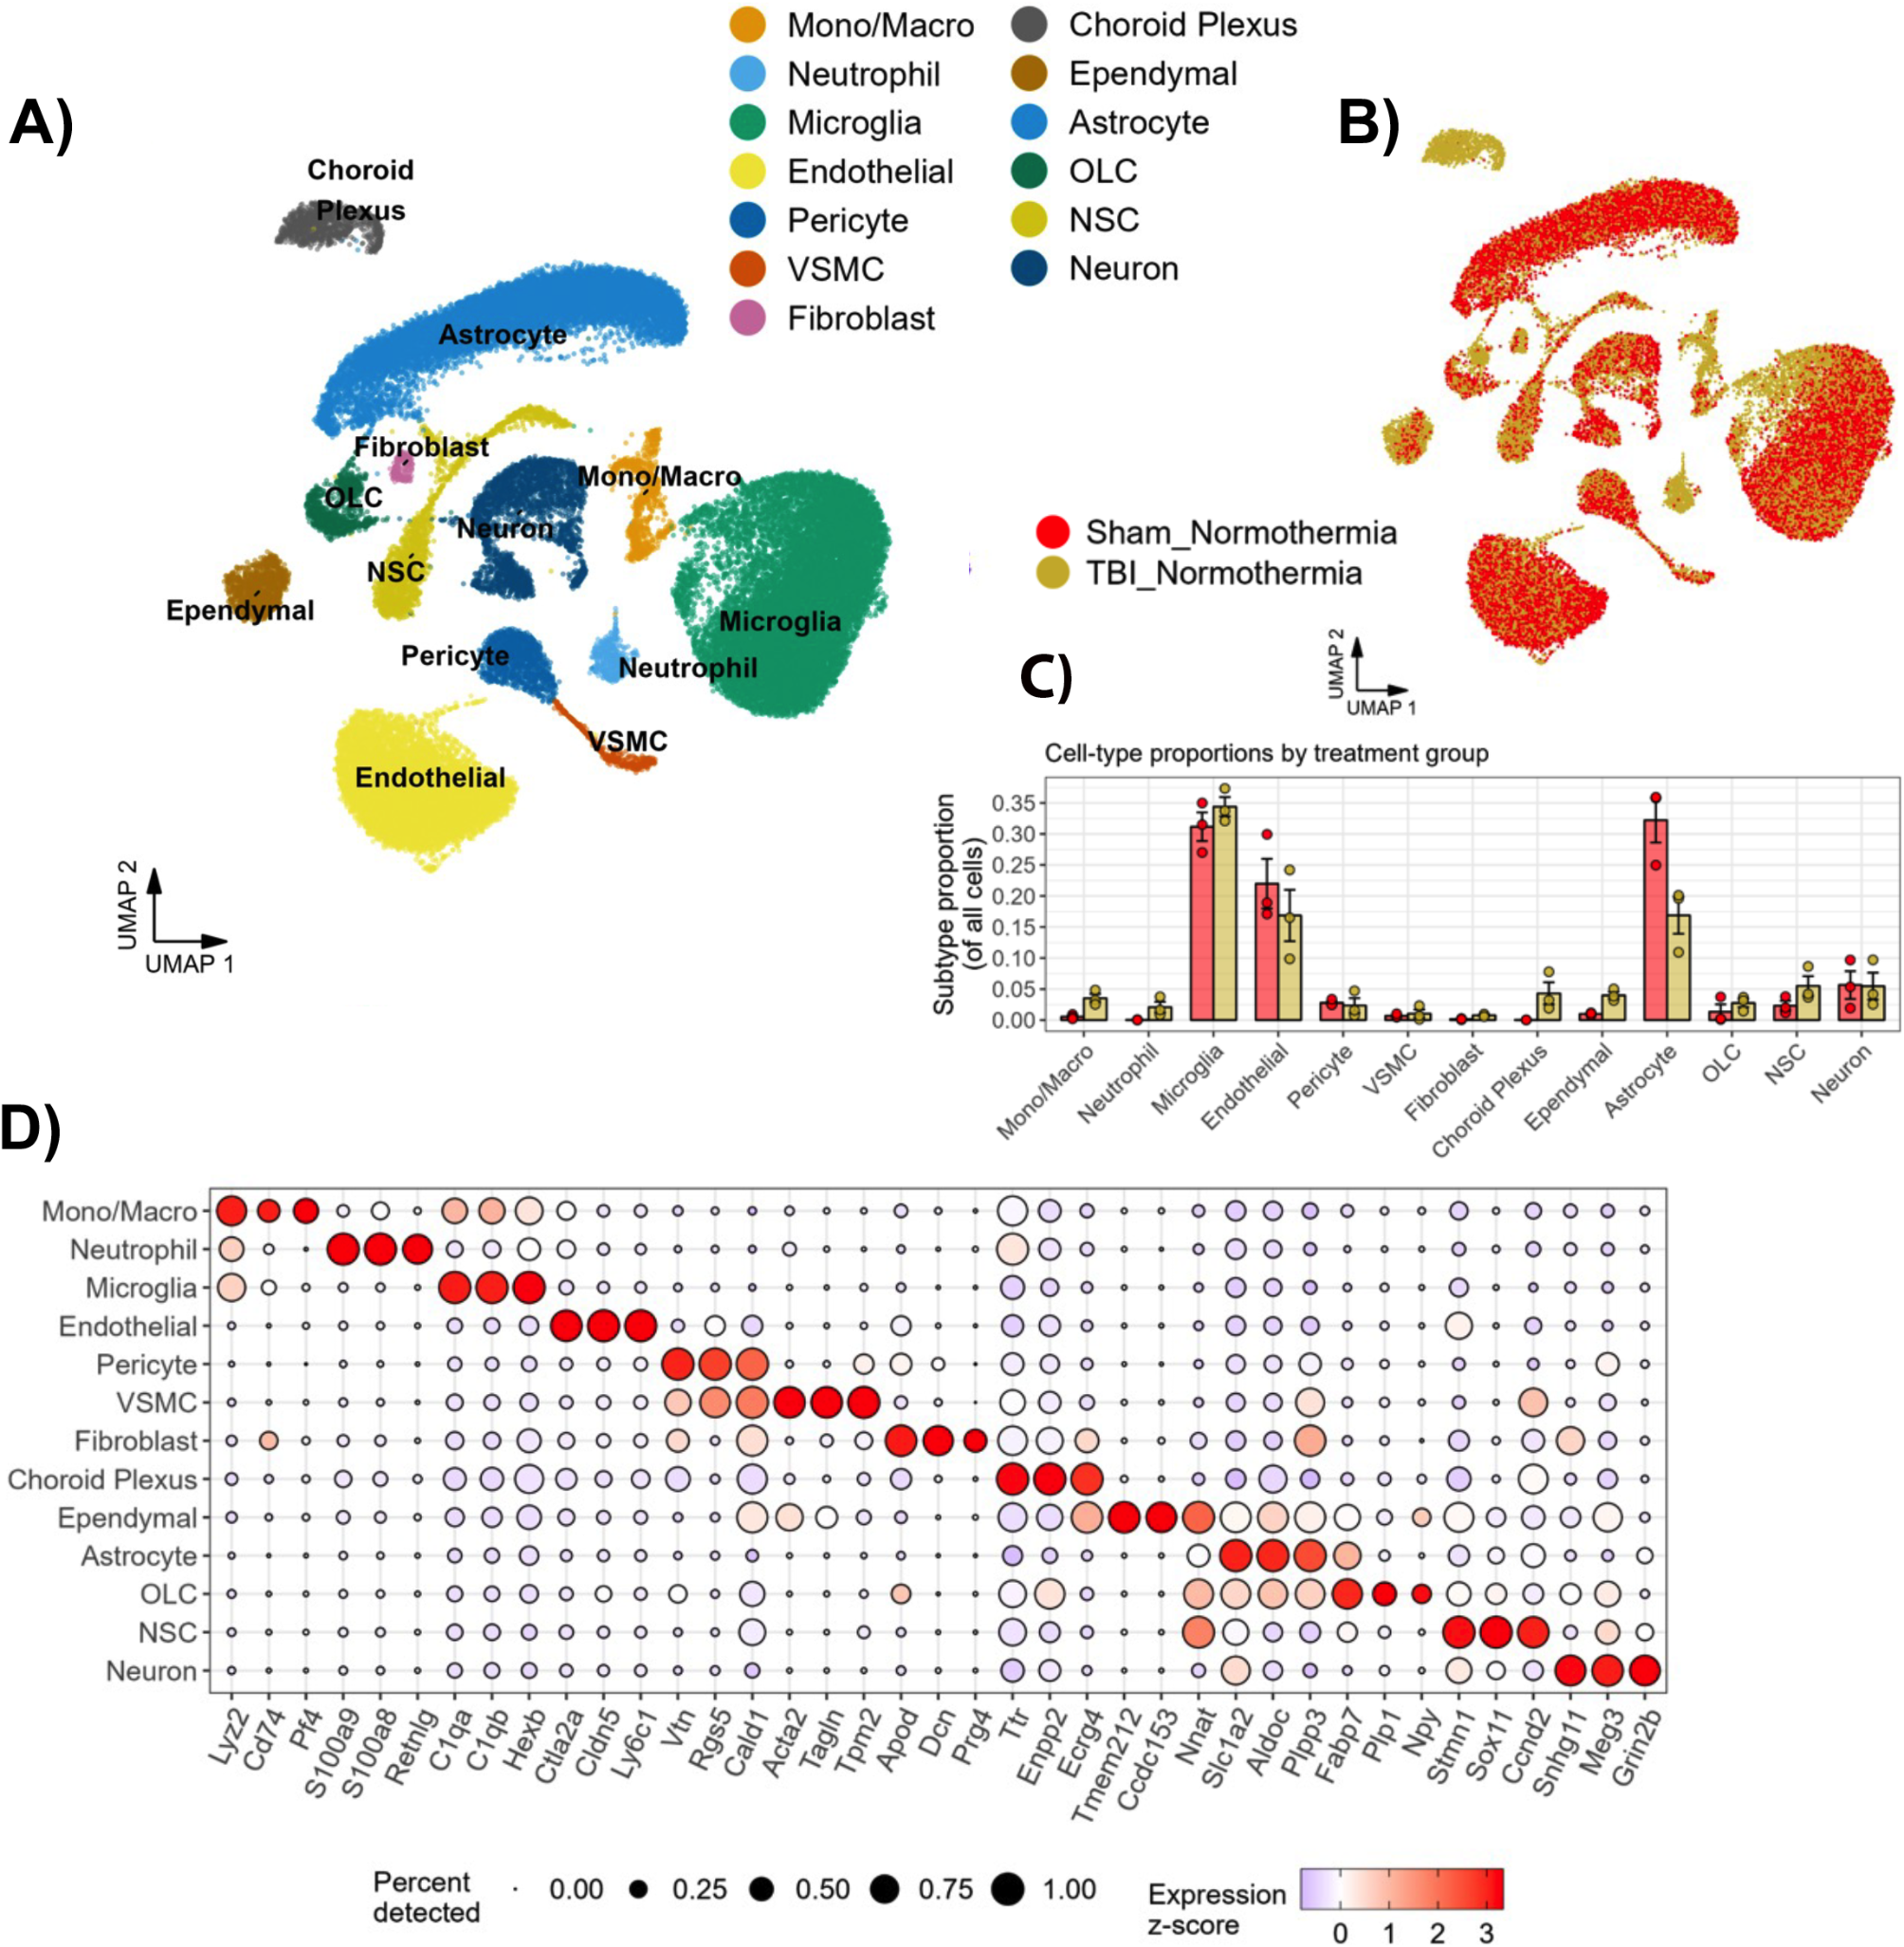
Elevated Lrg1 expression in multiple cell types in brain tissue during cerebral ischemia‒reperfusion injury. A Western blotting was used to determine total Lrg1 expression in brain tissues during different durations in MCAO/R mice. Mice were exposed to 0.5 and 1 h of ischemia and 1, 6, 12, and 24 h of reperfusion. Data are the mean ± SD, n = 8. ##p < 0.01 vs. sham group. B The UMAP plot presents the single-cell atlas of brain tissue after cerebral ischemia‒reperfusion injury. C The heatmap illustrates the expression of recognized marker genes in different cell types. D The violin plot displays Lrg1 expression in different cell types. E Immunofluorescence staining verified Lrg1 expression (red) in endothelial cells, neurons, and microglial cells in mouse brain tissues after MCAO/R. Scale bar = 50 μm. F The dot plot presents the differential expression analysis results of Lrg1 in various cell types between the MCAO/R and sham groups. An average log fold change (avg_logFC) value > 0 indicates that Lrg1 is expressed at higher levels in the MCAO/R group than in the sham group
To investigate the cell distribution of Lrg1, we analyzed published scRNA-seq data, which contain scRNA-seq data from the same left cerebral hemispheres from three sham-operated mice as well as three mice with tMCAO (transient middle cerebral artery occlusion) operated 24 h after ischemia reperfusion [9]. After stringent quality control, we obtained 58,077 high-quality cells. Subsequently, we used marker genes to classify these cells into different cell types (Fig. 1B, C). We identified 14 cell types, including oligodendrocytes, endothelial cells, neural progenitor cells, microglial cells, macrophages, astrocytes, vascular smooth muscle cells, ependymocytes, T cells, pericytes, neutrophils, choroid plexus capillary endothelial cells, fibroblast-like cells, and red blood cells. Next, we characterized the expression pattern of Lrg1 in different cell types. Lrg1 expression was observed in almost all the cell types of the cerebral ischemia‒reperfusion injury brain, including astrocytes, choroid plexus capillary endothelial cells, endothelial cells, ependymocytes, fibroblast-like cells, neural progenitor cells, macrophages, microglial cells, neurons, oligodendrocytes, pericytes, T cells, neutrophils, and vascular smooth muscle cells (Fig. 1D). We verified Lrg1 protein expression in several cell types using immunofluorescence and observed that the Lrg1 protein was expressed in endothelial cells, microglial cells and neutrophils (Fig. 1E, Additional file 1: Fig. S1C). Simultaneously, we employed immunofluorescence to detect the expression of Lrg1 in neuronal cells (Fig. 1E, Additional file 1: Fig. S1C).
Moreover, we computed the differential expression of Lrg1 in brain tissue after MCAO/R and sham-operated brain tissue. Our findings revealed that Lrg1 was upregulated in various cell types, including endothelial cells, fibroblast-like cells, vascular smooth muscle cells, astrocytes, and macrophages after MCAO/R (Fig. 1F). Overall, we observed that compared to the sham-operated group, many types of cells in cerebral ischemia‒reperfusion injury brain tissue showed increased Lrg1 expression, suggesting that Lrg1 plays an important role in modulation of the cerebral ischemia‒reperfusion injury process and may be related to many cell types in the brain.
Conventional Lrg1 knockout (Lrg1 −/−) attenuates infarct volume, water content, and neurological deficits induced by cerebral ischemia‒reperfusion injuryTo validate the role of Lrg1 as a target in cerebral ischemia‒reperfusion injury, we compared the cerebral infarct volume, water content, and neurological deficits of Lrg1−/− mice and WT mice after MCAO/R (Fig. 2). The deletion efficiency of Lrg1 was previously verified in Lrg1−/− mice via western blotting (Additional file 1: Fig. S1B). We observed that knockout of Lrg1 led to significant reductions in cerebral infarct volume (Fig. 2A, B), cerebral edema (Fig. 2C, D), and neurological deficits (Fig. 2F) after cerebral ischemia‒reperfusion injury. In normal brain tissues, immunohistochemical staining revealed positive purple‒red staining. The cells were full with distinct nuclei and cytoplasm, and the brain tissue was compact. Immunohistochemical staining of frozen sections revealed vacuolation and concentrated and dead neurons in ischemic brain tissues, whereas the morphology was significantly improved in Lrg1−/− mice injured by MCAO/R (Fig. 2E). In summary, our findings demonstrate that Lrg1 knockout confers protection to brain tissue after cerebral ischemia‒reperfusion injury.
Fig. 2
Effects of Lrg1 knockout on brain tissue damage in cerebral ischemia‒reperfusion mice. Mice were exposed to 1 h of ischemia and 24 h of reperfusion. A, B Gross slice figures of MCAO/R mouse brains stained with 2,3,5‒triphenyl tetrazolium chloride. The brain appeared red based on the interaction between TTC and dehydrogenase in the no infarction area, and the color faded to white in the no infarction area. Error bar graph showing the results of TTC staining in different groups. Data are expressed as the mean ± SD, n = 8. C, D Gross appearance of brains exposed to 1 h of ischemia and 24 h of reperfusion was observed based on Evans blue staining. Error bar graph showing the results of Evans blue staining in different groups. Data are expressed as the mean ± SD, n = 8. E H&E staining reveals morphology of brain tissues of MCAO/R mice based on light microscopic assessment. The damaged brain tissues exhibited white interspaces, pyknotic nuclei, appeared holes, and signs of bleeding. Scale bar = 1 × ; 200 × ; 400 × . F Measurement of neurological deficit scores of MCAO/R mice. Error bar graph showing the results of neurological deficit score in different groups. Data are expressed as the mean ± SD, n = 8
Single-cell RNA sequencing reveals significant alterations in the transcriptional profiles of various cell types in brain tissue after cerebral ischemia‒reperfusion injury upon Lrg1 knockoutMultiple cell types showed high Lrg1 expression levels in the brains of mice with cerebral ischemia‒reperfusion injury (Fig. 1D, F), suggesting that the protective effect of Lrg1 knockout on brain tissue after cerebral ischemia‒reperfusion injury may result from its action on multiple cell types. To investigate the impact of Lrg1 knockout on various cells following cerebral ischemia‒reperfusion injury, we conducted single-cell RNA sequencing (scRNA-seq) on cells obtained from the brains of WT sham-operated mice (sham + WT group), Lrg1−/− sham-operated mice (sham + Lrg1−/− group), WT mice after MCAO/R (MCAO/R + WT group), and Lrg1−/− mice after MCAO/R (MCAO/R + Lrg1−/− group) (Fig. 3A). After strict quality control filtering (Additional file 2: Fig. S2A, B), a total of 99,991 cells were identified from 11 mice (including 29,709 cells in the sham + WT group, 13,938 cells in the sham + Lrg1−/− group, 20,572 cells in the MCAO/R + WT group, and 35,772 cells in the MCAO/R + Lrg1−/− group). The cell populations were defined via unsupervised clustering analysis on the obtained cells, and each cluster was identified as a specific cell type using recognized marker genes (Fig. 3B). In total, we obtained 14 types of cells, including ependymocytes, neurons, endothelial cells, vascular smooth muscle cells, microglial cells, red blood cells, B cells, oligodendrocytes, astrocytes, pericytes, T cells, choroid plexus capillary endothelial cells, macrophages, and neutrophils (Fig. 3B, C).
Fig. 3
Single-cell transcriptomic data demonstrate that the impact of Lrg1 knockout on various cellular components in brain tissue of cerebral ischemia‒reperfusion mice. A A schematic representation of the experimental design employed in this study is depicted. B UMAP plots of 99,991 cells from 11 mice, including 14 cell types. C Heatmap of gene expression across different cell types. D Boxplot displaying cell purity for cell types. E Bar graph showing the number of differentially expressed genes for different cell types. F Bar graph showing the proportion of genes with unique changes in a single cell type among differentially upregulated or downregulated genes in MCAO/R + Lrg1−/− mice compared to MCAO/R + WT mice
Next, we explored the effects of Lrg1 knockout on different cell types. First, using ROGUE, we observed that compared to the cell composition in WT mice, the cell composition in Lrg1−/− mice showed lower expression heterogeneity after MCAO/R (Fig. 3D). Furthermore, we identified the differentially expressed genes (DEGs) in different cell populations in WT and Lrg1−/− mouse brains. As shown in Fig. 3E, we observed that many cell types showed a large number of DEGs (average of 817 DEGs), with the largest number observed in T cells, ependymocytes, macrophages, oligodendrocytes, and endothelial cells (Fig. 3E). B cells and choroid plexus capillary endothelial cells had fewer DEGs (Fig. 3E). To confirm whether the transcriptional profile changes after Lrg1 knockout are consistent across different cell types, we investigated the overlap of differentially expressed genes (DEGs) in various cell types. As shown in Fig. 3F, we observed that a significant proportion of DEGs (52% in upregulated DEGs and 33% in downregulated DEGs of the Lrg1−/− group after MCAO/R) were altered exclusively in a single cell type. These findings suggest that different cell types exhibits distinct changes in gene expression profiles following Lrg1 knockout, and the changes induced by Lrg1 differ across different cell populations. Therefore, we focused on deciphering the expression profile changes in different cell types. Overall, our results suggest that Lrg1 knockout changes the expression profiles of different cell types and that its effects on different cell compositions vary.
Conventional knockout of Lrg1 restricts the BBB dysfunction after cerebral ischemia‒reperfusion injuryPrior studies have shown that following cerebral ischemia‒reperfusion injury, the connections between components of the blood‒brain barrier become disrupted, leading to a series of symptoms, such as brain edema [8, 28]. Through differential gene analysis (Fig. 3E), we observed that the blood‒brain barrier cell composition had a greater number of DEGs after Lrg1 knockout. This finding prompted us to investigate the effect of Lrg1 knockout on the BBB. We extracted the constituent cells of the BBB, including astrocytes, vascular smooth muscle cells, pericytes, and endothelial cells, and used a Venn diagram to visualize the overlap of upregulated genes after Lrg1 knockout (Fig. 4A). The Venn diagram results suggested that there are many nonoverlapping DEGs among the different blood‒brain barrier cell types after Lrg1 knockout, indicating that these cells exhibit different changes (Fig. 4A). In addition, we observed 99 genes that showed consistent changes in these cell types. Furthermore, we performed pathway enrichment analysis on these 99 genes. The pathway enrichment analysis revealed that these associated genes include ribosome, positive regulation of cell adhesion, and cellular oxidant detoxification (Fig. 4B). A weakened connection between BBB components can lead to the development of brain edema after cerebral ischemia‒reperfusion injury. Moreover, we observed that the expression levels of some cell adhesion molecules, such as claudin 11, integrin β5, annexin A2, and protocadherin 9, were increased in the BBB cells of Lrg1−/− mice compared with those of WT mice after MCAO/R (Fig. 4C) [29,30,31]. Subsequently, we used immunofluorescence to examine the protein expression of cell adhesion-related proteins in endothelial cells in brain tissues of different groups. As shown in Fig. 4D–G, compared to WT mice, Lrg1−/− mice exhibited increased protein levels of cell adhesion-related molecules, including Cldn11 (Fig. 4D), Anxa2 (Fig. 4E), Pcdh9 (Fig. 4F), and Itgb5 (Fig. 4G), in endothelial cells after cerebral ischemia‒reperfusion injury. These results suggest that Lrg1 can regulate the expression of these cell adhesion-related molecules in endothelial cells.
Fig. 4
Lrg1 knockout reduces BBB dysfunction after cerebral ischemia‒reperfusion injury in mice. A Venn diagram illustrating the overlapping differentially expressed genes in BBB constituent cells (upregulated in brain tissue of Lrg1−/− mice after cerebral ischemia‒reperfusion injury compared to WT mice). B Pathway enrichment analysis results of the 99 overlapping differentially expressed genes of BBB constituent cells. C Violin plots displaying the expression of intercellular adhesion molecules in BBB constituent cells of different groups and colored according to the standardized expression median. D–G Representative immunofluorescence images showing the protein expression of Claudin 11, Annexin A2, Integrin β5, and Protocadherin 9 in the brain tissues of mice from different groups. Scale bar = 20 μm. H Microvascular albumin leakage test showing the change in albumin leakage in the venules of the brain tissues from different mouse groups. I Error bar graph showing the results of the microvascular albumin leakage test in different groups. Data are expressed as the mean ± SD, n = 8. Scale bar = 400 ×
Furthermore, by injecting FITC-labeled albumin through the tail vein, we measured the permeability of cerebral venule in different group. According to the statistical data of fluorescence intensity, the ratio of surrounding interstitial area (Ii) fluorescence intensity to the fluorescence intensity of the lumen of selected venules (Iv) in the same area increased after MCAO/R (Ii/Iv: sham + WT: 30.56 ± 4.75%, MCAO/R + WT: 67.01 ± 6.38%), indicating that vascular damage led to increased permeability (Fig. 4H, I). However, Lrg1 knockout attenuated this leakage and decreased the proportion of fluorescent leakage to levels significantly lower than that observed in the MCAO/R + WT group (Ii/Iv: MCAO/R + Lrg1−/−: 50.80 ± 6.88%, MCAO/R + WT: 67.01 ± 6.38%, Fig. 4H, I). The findings presented herein suggest that Lrg1 knockout attenuate the disruption of the BBB following cerebral ischemia‒reperfusion injury in cerebral tissue.
Lrg1 knockout shifts microglial cells and macrophages from a proinflammatory state to an anti-inflammatory and tissue repair-promoting state after cerebral ischemia‒reperfusion injuryMicroglial cells are acknowledged as macrophages resident central nervous system (CNS), that play roles in sustaining and nourishing the CNS as well as immune surveillance [32, 33]. Through differential gene analysis (Fig. 3E), we observed that microglial cells and macrophages had a greater number of DEGs after Lrg1 knockout, prompting us to investigate the effect of Lrg1 knockout on these cells. Our differential gene analysis revealed that microglial cells and macrophages in WT mice exhibited higher expression levels of proinflammatory molecules (interleukin 6, tumor necrosis factor ɑ, Fig. 5A, B) and M1-type macrophage markers (Cd86, Fig. 5A, B) compared with Lrg1−/− mice after MCAO/R [34, 35]. In contrast, microglial cells and macrophages in the MCAO/R + Lrg1−/− group had higher expression levels of anti-inflammatory molecules (Il10, Fig. 5A and B) and tissue repair-promoting molecules (Arg1, Fig. 5A, B) compared with the MCAO/R + WT group [36]. Using immunofluorescence, we observed that microglial cells in Lrg1−/− mice exhibited lower protein expression levels of proinflammatory cytokines, such as interleukin 6 and tumor necrosis factor ɑ, than those in WT mice (Fig. 5C, D). We also observed that microglial cells in Lrg1−/− mice exhibited higher expression of molecules associated with phagocytic function (C1qb), but macrophages in the WT mice did not show this characteristic (Fig. 5A, B) [37].
Fig. 5
Lrg1 knockout alters the functional state of microglial cells and macrophages after cerebral ischemia‒reperfusion injury in mice. A Violin plot showing the expression of functional molecules in microglial cells of different groups. The coloring is based on the standardized median expression of each group. B Violin plot exhibiting the expression of functional molecules in macrophages of different groups. The coloring is based on the standardized median expression of each group. C Representative images showing interleukin 6 protein expression in the brain tissues of mice from different groups. Scale bar = 20 μm. D Representative images showing tumor necrosis factor α protein expression in the brain tissues of mice from different groups. Scale bar = 20 μm. E Box plot showing the functional state score of microglial cells from different groups. F Pathway enrichment analysis of upregulated differentially expressed genes in microglial cells in brain tissues of Lrg1−/− mice after MCAO/R compared with WT mice after MCAO/R
Furthermore, we used various functional scores to measure the functional states of microglial cells and macrophages in different groups (Fig. 5E). Functional scores showed that microglial cells and macrophages in Lrg1−/− mice were more M2 biased than those in WT mice after MCAO/R. The microglial cells of Lrg1−/− mice also had stronger phagocytic ability than the microglial cells of WT mice after MCAO/R (Fig. 5E). The findings indicate that Lrg1 knockout leads to a reduction in the proinflammatory functions of microglial cells and macrophages along with an increase in their ability to suppress inflammation and promote tissue repair.
In addition, we performed pathway enrichment analysis on the upregulated DEGs in microglial cells of Lrg1−/− mice. The results showed that microglial cells of Lrg1−/− mice were associated with various biological processes, such as positive regulatory mechanisms of cell migration, response to hypoxia, and glial cell development (Fig. 5F). These results suggest that Lrg1 knockout may affect biological processes, such as movement, response to hypoxia, and differentiation of microglial cells.
Lrg1 knockout impacts microglial cell differentiation after cerebral ischemia‒reperfusion injuryBased on pathway enrichment analysis showing that Lrg1 knockout may impact microglial cell differentiation (Fig. 5F), we analyzed microglial cell differentiation trajectories. First, we performed unsupervised clustering analysis on the obtained microglial cells. In total, we obtained 30,973 microglial cells that were clustered into 7 clusters (Fig. 6A). Significant differences in the expression profiles of different clusters were demonstrated through heatmap visualization of the signature genes of different clusters (Fig. 6B). To explore the functions of different microglial subtypes, we first calculated various functional scores for each cluster. We observed that the functional states of different microglial clusters were significantly different (Fig. 6C‒E). Microglia_C2, Microglia_C4, Microglia_C6, and Microglia_C7 had higher M1 scores, whereas Microglia_C1, Microglia_C3, and Microglia_C5 had lower M1 scores (Fig. 6C). Additionally, we observed that Microglia_C6 and Microglia_C7 had higher M2 scores, whereas Microglia_C1, Microglia_C2, Microglia_C3, Microglia_C4, and Microglia_C5 had lower M2 scores (Fig. 6D). These results demonstrated that the phenotype of microglial cells in brain tissue after MCAO/R is more complex and does not simply consist of two polarization groups, M1 and M2. Overall, Microglia_C2 and Microglia_C4 were more biased toward the M1 type, whereas Microglia_C6 and Microglia_C7 were more biased toward the M2 type. The results of phagocytic scoring indicated that Microglia_C5 had the highest phagocytic score, suggesting that it has the strongest phagocytic ability (Fig. 6E).
Fig. 6
Lrg1 knockout affects microglial cell maturation after cerebral ischemia‒reperfusion injury in mice. A The UMAP plot illustrates the clustering results of microglial cells in brain tissue after MCAO/R. B The heatmap depicts the expression of the top 50 differentially expressed genes in distinct microglia subpopulations. C The box plot demonstrates the M1 score in microglial cells across different clusters. D The box plot exhibits the M2 score in microglial cells across different clusters. E The box plot displays the phagocytosis scores in microglia across different clusters. F The dot plot demonstrates the distribution of different clusters in the differentiation trajectory plot of microglial cells in Sham + WT group constructed using monocle2. G The dot plot illustrates the differentiation trajectories of microglial subpopulations in Sham + WT group drawn by monocle2. The direction of arrows indicates the direction of differentiation and development. H The dot plot illustrates the differentiation trajectories of microglial subpopulations in Sham + WT group drawn by CytoTRACE. The direction of arrows indicates the direction of differentiation and development. I Heatmap visualizations depicted the enrichment profiles of distinct cell clusters (rows) across diverse groups (columns). The coloration within the cells corresponds to the Ro/e values, denoting the extent of cell cluster enrichment as delineated below: Insufficiency: Ro/e ≤ 1; Limited Enrichment: 1 < Ro/e ≤ 1.5; Intermediate Enrichment: 1.5 < Ro/e ≤ 3; Substantial Enrichment: Ro/e > 3. J The heatmap illustrates the transcription factors of Path 1 that change with the trajectory in Sham + WT group. Different TF clusters signify TFs with varying expression patterns along the trajectory. K The heatmap demonstrates the transcription factors of Path 2 that change with the trajectory in Sham + WT group. Different TF clusters represent TFs with distinct expression patterns along the trajectory
Subsequently, we sought to investigate the differentiation trajectory of microglial cells. We calculated the differentiation trajectories of microglial cells separately in different groups using Monocle 2 and CytoTRACE. Combining the results, we observed that microglial cells in the brain tissue followed two differentiation trajectories: one trajectory from Microglia_C4, Microglia_C6, and Microglia_C7 to Microglia_C1, Microglia_C2 and Microglia_C3 (Path 1, Fig. 6F–H and Additional file 4: Fig. S4) and another trajectory from Microglia_C4, Microglia_C6, and Microglia_C7 to Microglia_C5 (Path 2, Fig. 6F–H and Additional file 4: Fig. S4).
Furthermore, we quantified the distribution of different microglial subtypes across various groups by calculating Ro/e values (Fig. 6I). We observed distinct subtype distributions among microglial cells in different groups. Specifically, Microglia_C1 and Microglia_C2 were predominantly enriched in the Sham + WT group (Fig. 6I). Microglial cells from Microglia_C3, Microglia_C4, and Microglia_C7 were enriched in the MCAO/R + WT group (Fig. 6I). Microglia_C5 was predominantly enriched in the Sham + Lrg1−/− group, whereas the MCAO/R + Lrg1−/− group exhibited a greater abundance of Microglia_C5, Microglia_C6, and Microglia_C7 (Fig. 6I). In conjunction with the previous findings, these results suggest alterations in the differentiation states of microglial cells following MCAO/R or Lrg1 knockout. In summary, our findings suggest that MCAO/R and Lrg1 may modulate microglial differentiation.
Transcription factors (TFs) shape different cell phenotypes and regulate cell differentiation processes [38]. Therefore, we screened for differentially expressed TFs along the microglial differentiation trajectory. We conducted transcription factor screening in microglial cells from the Sham + WT group (Fig. 6J, K). Our results showed that in Path 1, Id2, Cebpb and other TFs expression decreased with differentiation, whereas the expression of Fos, Klf4, and other TFs increased with differentiation (Fig. 6J). In Path 2, our results showed that Id2 and Cebpb expression decreased with differentiation, whereas that of Jun, Klf6, Egr1, and other TFs increased with differentiation (Fig. 6K). Furthermore, we validated the majority of these transcription factors exhibiting similar patterns of change in two trajectories within the other three groups (Additional file 5: Fig. S5). These TFs may influence the differentiation of microglia, and Lrg1 may also impact microglial cells by modulating the expression of these TFs.
Lrg1 knockout reduces neuron and oligodendrocyte death after cerebral ischemia‒reperfusion injuryA total of 1782 neurons were obtained in our study. The enriched gene sets of upregulated genes in neurons of WT mice after MCAO/R (compared with neurons of Lrg1−/− mice after MCAO/R) showed that Lrg1 knockout was associated with various processes, such as nucleosome assembly, adjustment of function in processes of apoptosis signal, and modulation of neuron death (Additional file 6: Fig. S6A), indicating that neurons of WT mice after MCAO/R may be more susceptible to cell death compared to neurons of Lrg1−/− mice after MCAO/R. Jin et al. reported that Lrg1 overexpression enhances neuronal apoptosis and autophagy after cerebral ischemia‒reperfusion injury, which is consistent with our observations [39].
Oligodendrocytes wrap axons in the central nervous system to form the myelin sheath structure, which is essential for neuronal function [40]. Previous studies revealed that after cerebral ischemia‒reperfusion injury, the death of oligodendrocytes leads to a reduction in the myelin sheath structure [41, 42]. A total of 12,547 oligodendrocytes were obtained in our study. The enriched gene sets of upregulated genes in oligodendrocytes of WT mice after MCAO/R (compared with oligodendrocytes of Lrg1−/− mice after MCAO/R) showed that Lrg1 knockout was associated with biological processes, such as rRNA processing, positive regulation of cell death, and apoptosis (Additional file 6: Fig. S6B), suggesting that Lrg1 knockout may reduce oligodendrocyte death and protect the myelin sheath structure.
Concomitantly, based on differential gene calculations, we found that vascular smooth muscle cells from Lrg1−/− mice expressed higher levels of Ngf than those from WT mice after MCAO/R, which could promote neuronal repair following MCAO/R injury (Additional file 6: Fig. S6C).
Lrg1 knockout alters the metabolic status of multiple cell populations after cerebral ischemia‒reperfusion injuryVarious metabolic processes are associated with cerebral ischemia‒reperfusion injury-induced brain tissue damage [43,44,45]. Therefore, we estimated the metabolic status of various cell compositions in different groups based on their expression profiles. We then calculated the number of differential metabolic pathways for different cell types (adjusted p value < 0.05). As shown in Fig. 7A, we observed that the differential metabolic status of different cell types varied. In WT mice and Lrg1−/− mice, multiple metabolic pathways were differentially expressed in most cell types, such as neurons, vascular smooth muscle cells, and microglial cells, whereas B cells showed fewer differential metabolic pathways (Fig. 7A). These results suggest that Lrg1 knockout may alter the metabolic status of multiple cell populations in the brain after cerebral ischemia‒reperfusion injury. Furthermore, we identified the common differential metabolic pathways in multiple cell types (Fig. 7B). Our results revealed that several pathways, such as chondroitin sulfate degradation, hyaluronan metabolism, and N glycan degradation, were significantly upregulated in multiple cell types of WT mice (Fig. 7B). Current studies have shown that the upregulation of chondroitin sulfate proteoglycans is associated with the glial reaction, resulting in the formation of inhibitory scars that impede axonal growth and network reorganization of damaged neurons [46]. In contrast, we observed that hypoxia was upregulated in most cell types in WT mice. Hypoxia may induce various types of cell damage after cerebral ischemia‒reperfusion injury [47]. In summary, our results indicate that Lrg1 knockout alters the metabolic status of multiple cell components.
Fig. 7
Lrg1 knockout alters the metabolic status of multiple cell populations after cerebral ischemia‒reperfusion injury in mice. A The bar chart displays the differences in metabolic pathways between various cell populations in different groups. B The bar chart presents the common differentially regulated metabolic pathways in various cell populations between different groups. C The volcano plot depicts the differentially regulated metabolic pathways in microglial cells between different groups. D The box plot shows the results of oxidative phosphorylation scores in microglial cells from different groups. E The box plot displays the results of hypoxia scores in microglial cells from different groups. F The dot plot demonstrates the correlation between hypoxia scores and M1 scores in microglial cells. G The dot plot illustrates the correlation between oxidative phosphorylation scores and M2 scores in microglial cells
Prior investigations have substantiated the influence of diverse metabolic pathways on the polarization status of microglial cells in neurological diseases [48, 49]. Based on our previous results, we found that Lrg1 knockout could affect the state of microglia and various metabolic pathways in the cerebral ischemia‒reperfusion injury process (Figs.
Comments (0)