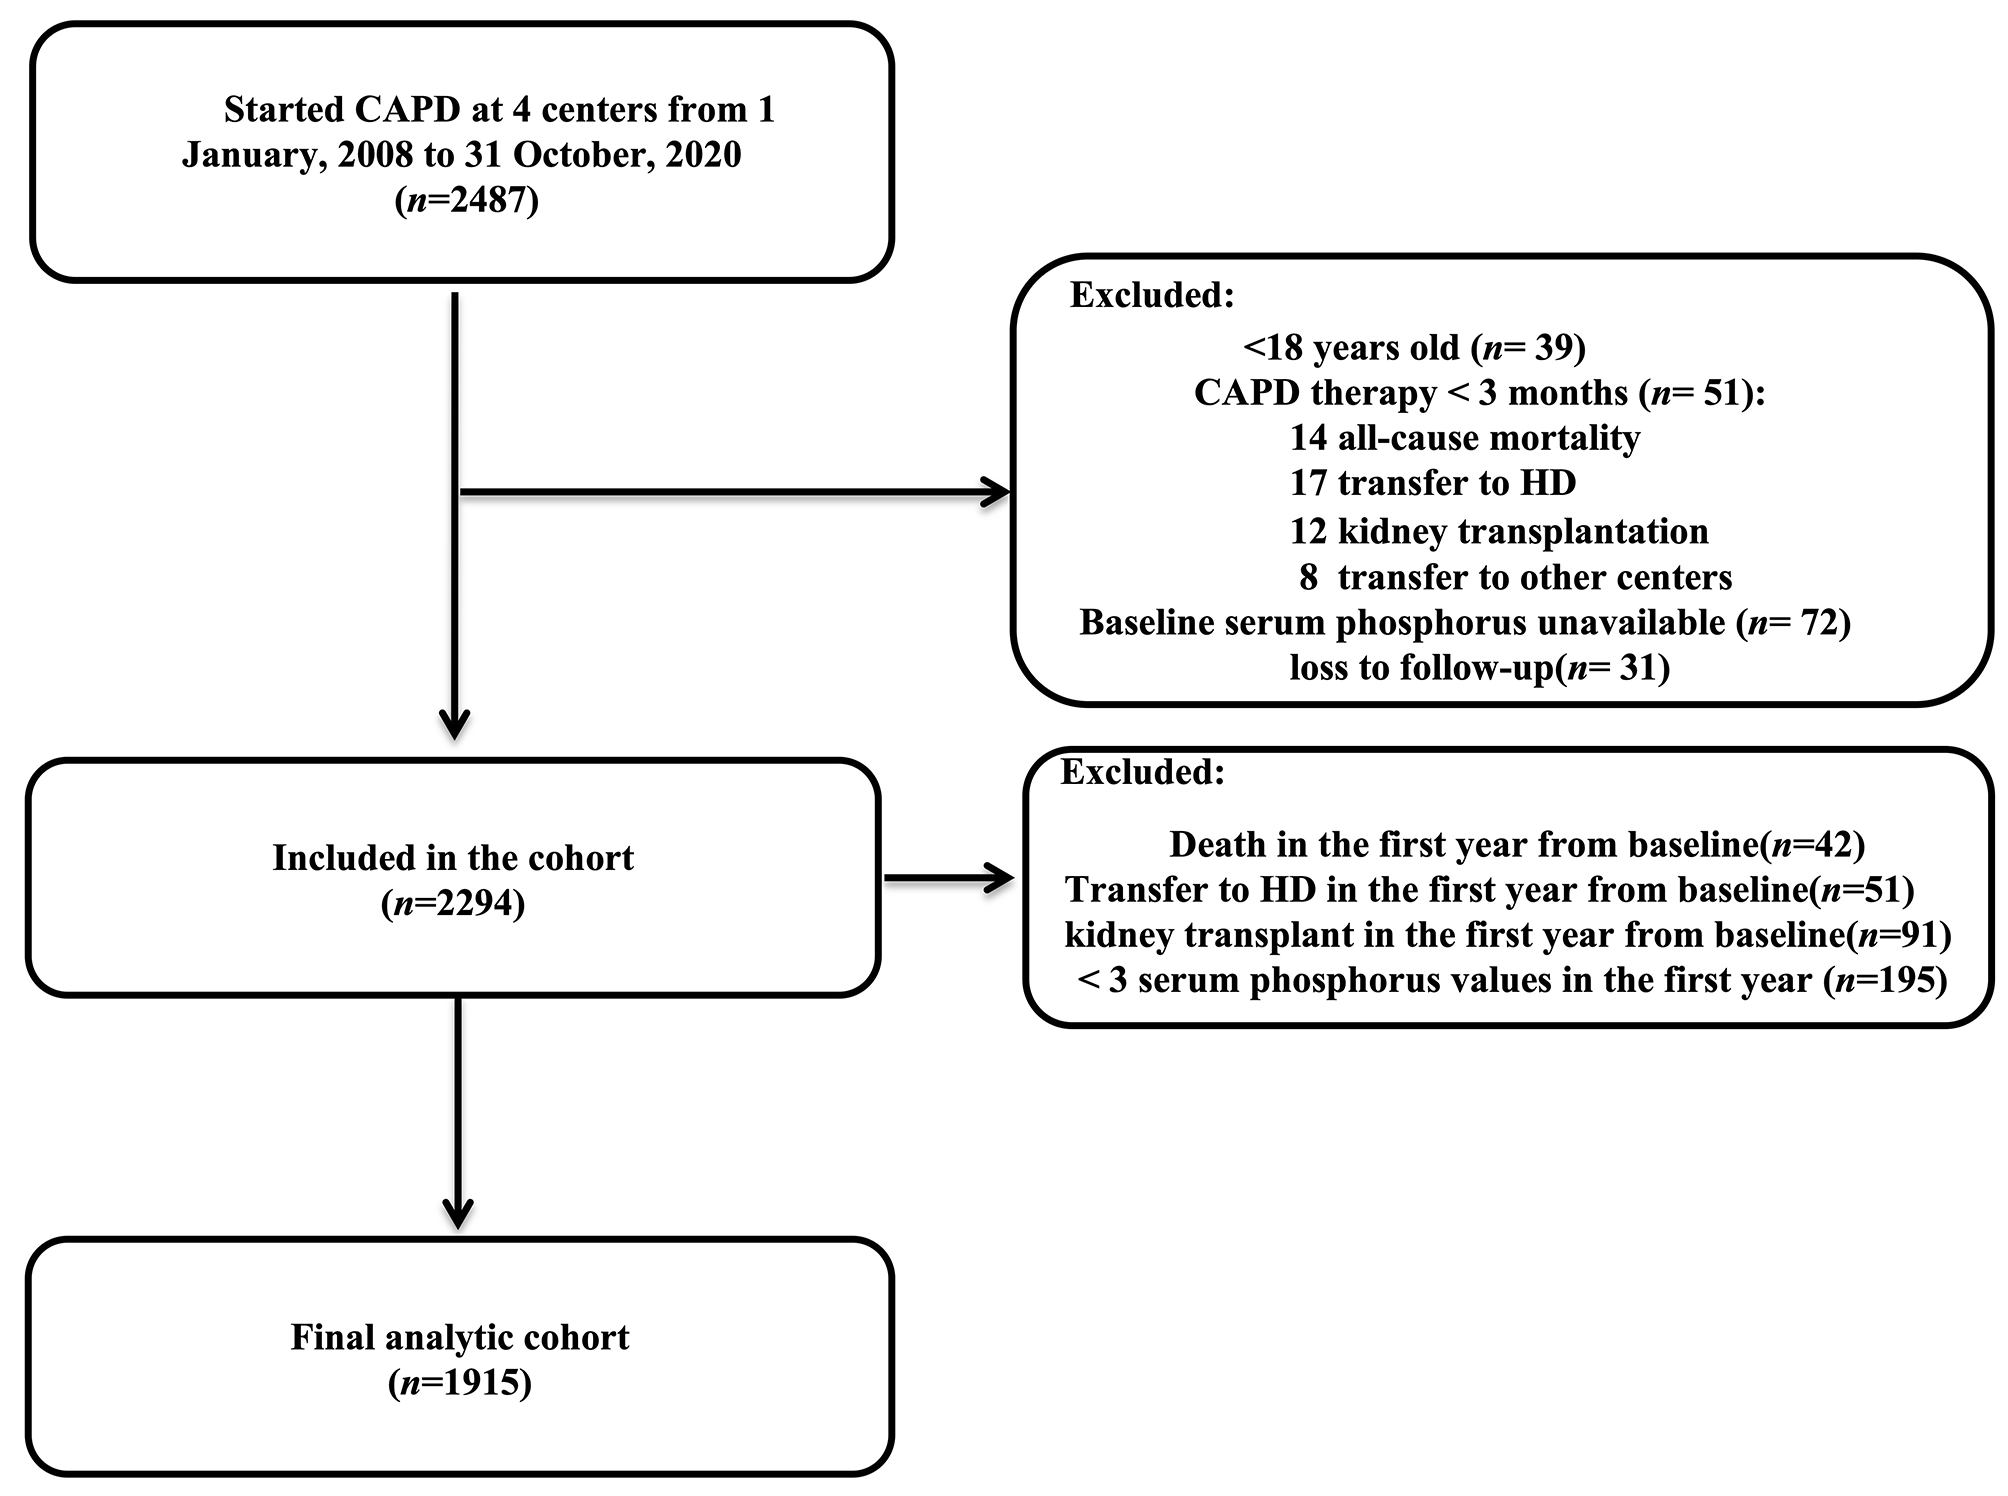
Study design, context and participants
This is a multi-center retrospective study that included CKD patients who consulted at three Lebanese nephrology clinics for the first time between February 2006 and December 2019. Nephrologists following these patients are affiliated to the Faculty of Medicine of the Saint-Joseph University of Beirut.
Eligibility criteria
Patients were included if they were older than 18 years, if they had a renal Doppler US with a RRI level in their file and if they were followed for at least two years. Single (solitary) kidney patients, kidney transplant recipients, patients diagnosed with polycystic kidney disease or renal artery stenosis were excluded.
Data collection
Data collection was conducted between April and September 2022. Baseline data collected from patients' medical files included demographics, date of first visit, number of visits, cardiovascular (CV) risk factors such as hypertension, diabetes, smoking, dyslipidemia, obesity, history of coronary artery disease (CAD), heart failure and/or strokes, laboratory values at the first visit (T1) such as serum creatinine, glomerular filtration rate (GFR) estimated by the 2012 CKD-EPI equation, urine albumin over creatinine ratio (ACR), HbA1c level. RRI levels were collected once from reports of Doppler US at T1 or between the first and second visit. If RRI levels of the two kidneys were different, we recorded the average of both levels.
Follow-up data included the number of visits, date of last visit, laboratory values of serum creatinine, eGFR, ACR and HbA1c at last visit (T2), chronic medications namely statin, proton pump inhibitor (PPI), calcium channel blocker (CCB), renin–angiotensin–aldosterone system (RAAS) inhibitor (Angiotensin-converting enzyme (ACE) inhibitor or angiotensin-receptor blocker), beta-blocker, thiazide diuretic and occurrence of any new cardiovascular event such as coronary event, heart failure, or stroke.
Definitions
CKD is defined in this study based on the KDIGO classification taking into consideration GFR categories and urine albumin to creatinine ratio (ACR) [1]. GFR category is estimated by the 2012 CKD-EPI equation. Stage 1 is an estimated GFR (eGFR) ≥ 90 ml/min/ 1.73 m2 with ACR ≥ 30 mg/g or any other marker of kidney damage, stage 2 is eGFR 60–89 with ACR ≥ 30 mg/g or any other marker of kidney damage, stage 3a is eGFR 45–59, stage 3b is eGFR 30–44, stage 4 is eGFR and stage 5 is eGFR < 15 ml/min/ 1.73 m2.
Life style modifications/ interventions
We collected whether blood pressure was controlled, defined as < 140/90 at the last visit (T2), whether HbA1c was reduced between first and last visit. Other recorded life style modifications were smoking cessation, weight loss and compliance with a low sodium diet. Weight loss was defined as any weight loss above 2 Kgs between T1 and T2. Patients were considered as compliant to low salt diet based on their statement, and/or their caregiver's confirmation and/or low 24-h urinary salt less than 5 g per day when available. The compliance to medications was assessed by the count of boxes that the patients bring to the clinic in order to renew the unified prescription and to get reimbursed by the national social security fund or the military funds of the country, that constitute 80% of all patients' coverage. For the remaining 20%, we assessed patients' compliance by the renewed prescriptions.
Outcomes
Two outcomes were recorded: death and initiation of dialysis. The time before death and/or dialysis has been determined, as well as the cause of mortality. Another outcome assessed was the three-point major cardiovascular event (3P-MACE) including non-fatal myocardial infarction, non-fatal stroke or cardiovascular death.
Measurements
Radiologists affiliated to the three clinics were well-trained at performing RRI measurement using Doppler US. RRI is defined as the maximum blood flow velocity in systole minus the minimum blood flow velocity at the end of diastole over peak systolic velocity.
The laboratory biological parameters including creatinine level, ACR and HbA1c were measured using standard techniques in the three hospitals’ labs.
Statistical analysis
Statistical analyses were performed using the Statistical Package for the Social Sciences, Version 24.0 (SPSS Inc.-IBM corp., Armonk, NY, USA). Continuous data were reported as mean and standard deviation (SD) if normally distributed and as median and interquartile (IQR) if skewed. Categorical data were reported as numbers and percentages. Missing data was estimated at 7.8% for compliance to salt reduction, 6% for smoking cessation, 11.5% for weight loss and 49.5% for ACR (T2). ACR at T2 was removed from the analysis. Little's MCAR test showed that compliance to salt reduction, smoking cessation and weight loss were missing completely at random. We performed a multiple imputation regression model to replace the missing values. The imputed data was used to analyze the multivariable cox regression model and the results were similar to the original model. Mann Whitney test, independent t-test, Chi Square test were used to compare two groups of RRI levels. Spearman rho correlation evaluated the correlation between two continuous variables. The receiver operating curve (ROC) analysis was used to assess the predictive value of RRI for dialysis and death. Kaplan Meier survival analysis and log rank test evaluated the difference in survival between patients with normal and high RRIs. Cox regression analysis assessed the factors associated with death and the association between RRI and dialysis. A Cox proportional hazards regression analysis was performed to assess factors associated with death, dialysis and 3P-MACE; the first model included all cardiovascular risk factors, the second, third and fourth models added to Model 1 renal factors, therapeutic and preventive interventions. P-value < 0.05 was considered as statistically significant.


留言 (0)