Function of the myocardium can be described by the relaxation ability of the left ventricle. During physical activity, the body undergoes various physiological changes which are a consequence of the excessive need for the energy production [1,2,3]. These changes include the change of the function and structure of the heart which plays a crucial role in energy distribution over the body [4, 5]. Engaging in physical activity is widely acknowledged as highly beneficial for treatment of various diseases [6, 7]. Physiological phenomenon characterized by structural and functional adaptations to regular physical exercise is called ‘‘athlete’s heart’’ [7]. Recent studies have shown that long impulsive training can lead to left ventricular dilatation and hypertrophy, as well as an increase in left ventricular mass. Such changes can be identified with the echocardiography-Doppler analysis which can examine the ability of filling capacity of the heart [5, 8]. Indeed, knowing the filling capacity can be crucial for the athletes allowing their cardiac function to be assessed and used for the further development in their body physique and sports. One of the measurements that can be obtained through heart echocardiography is vortex formation time (VFT), which explains the process of vortex formation within the left ventricle (LV) and contributes to a better understanding of diastolic left ventricular function [9,10,11]. According to prior research, the morphological structure and physiological function of the heart vary among athletes who engage in different physical activities. One example is the difference in the hearts between strength-trained and endurance-trained individuals. During the performance of the physical exercise body undergoes many different morphological and chemical changes which can affect heart and its function [2, 3]. Previous studies suggested that “endurance-trained” heart would mainly lead to eccentric LV hypertrophy while a “strength-trained” heart would lead predominantly to concentric LV hypertrophy. However, recent studies suggest that there are no universal upper normal limits for LV dimensions correlated to different sporting disciplines. The concept of sport-specific standard values could serve as a method for identifying athletes whose cardiac dimensions, in relation to their gender and sport specialty, deviate from the norm. Therefore, while a certain degree of association may exist between training routines and cardiac adaptation patterns, this relationship is intricate and subject to variation, influenced by both the sport type and individual athlete [12]. Nevertheless, studies suggest that endurance exercise can induce sustained muscular strain, which, particularly in athletes, may contribute to increase of cardiac output and its consequent impact on blood pressure. Cardiac output is increased mainly from a surge in heart rate and stroke volume [13]. During the increase of the physical activity the heart increases its stroke volume, up to the maximal heart rate of 150 bpm. Beyond the maximal heart rate value, the stroke volume declines due to the shortened diastolic filling time [14]. However, the cardiac output continues to increase due to the combination of a higher heart rate and an improved ejection fraction. Moreover, the expansion of blood vessels within the active muscles, brought about by a reduction in peripheral vascular resistance, significantly contributes to the overall increase in cardiac output. Change in pressure can cause left ventricular dilation and thickening which leads to the increase of the left ventricular diameter with a proportional increase in ventricular thickness [5, 8, 15,16,17].
Cardiac properties and health status of an athlete
The adaptation of the heart is contingent on the specific nature of the exercise performed. Participating in elite-level endurance exercises like swimming, cycling, or running increases cardiac output, which, in turn, leads to increased blood pressure due to long-term muscular stress [1, 2]. As a result of the volume load, there is an increase in the left ventricular diameter and a corresponding increase in ventricular thickness (eccentric hypertrophy) [5]. This adaptation is the heart’s way of responding to the demands placed upon it during sustained aerobic exercise. Structural changes are essential for enhancing cardiac output, enabling the heart to effectively pump a larger volume of blood per beat. During endurance training, the body requires increased oxygen and nutrient delivery to active muscles, leading to a higher cardiac output. Eccentric hypertrophy helps to meet this demand by optimizing the heart’s ability to pump larger quantities of blood with each contraction. This adaptation is beneficial for athletes engaged in activities like long-distance running, swimming, or cycling [14]. Pressure overload and the subsequent increase in peripheral resistances that occur during high-intensity strength training, particularly in competitive athletes, are relatively brief physiological occurrences. Following this transient period of increased pressure, a compensatory vasodilation response ensues, effectively returning the athlete’s blood pressure to normal levels or, in some cases, even lowering it. This differentiation is essential, as it signifies that the brief pressure surge associated with strength training does not result in a lasting blood pressure increase, in contrast to conditions such as arterial hypertension or left ventricular outflow tract stenosis, where blood pressure remains chronically elevated [18]. Despite this thickening, the volume of blood that the LV can hold at the end of diastole remains unchanged. Considering the load on the heart recent studies suggest that long term exercise does not change the geometry of the heart in athletes and people who undergo rigorous training exercises [12, 19]. Consequently, it’s evident that these athletes encounter both volume load and pressure stress. A meta-analysis highlights that individuals participating in a combination of endurance and strength training possess increased left ventricular wall thickness and capacity in comparison to those exclusively engaged in either endurance or strength training [20]. In relation to left ventricular hypertrophy, both endurance and strength training contribute to a greater relaxation of the LV. It has also been demonstrated that an increase in left ventricular relaxation contributes to enhanced diastolic function in elite athletes [21]. There is an increase in cardiac mass and left ventricular hypertrophy in systemic hypertension. Alternatively, hypertrophy is related to ventricular stiffness and decreased relaxation in the LV [1, 21]. Since ventricular stiffness affects the filling of the LV and thus the formation of vortex in the LV, VFT is a potential variable to differentiate between pathological changes that occur in the LV during systemic hypertension and prolonged intense exercise [5].
Vortex formation and relation to the diseases
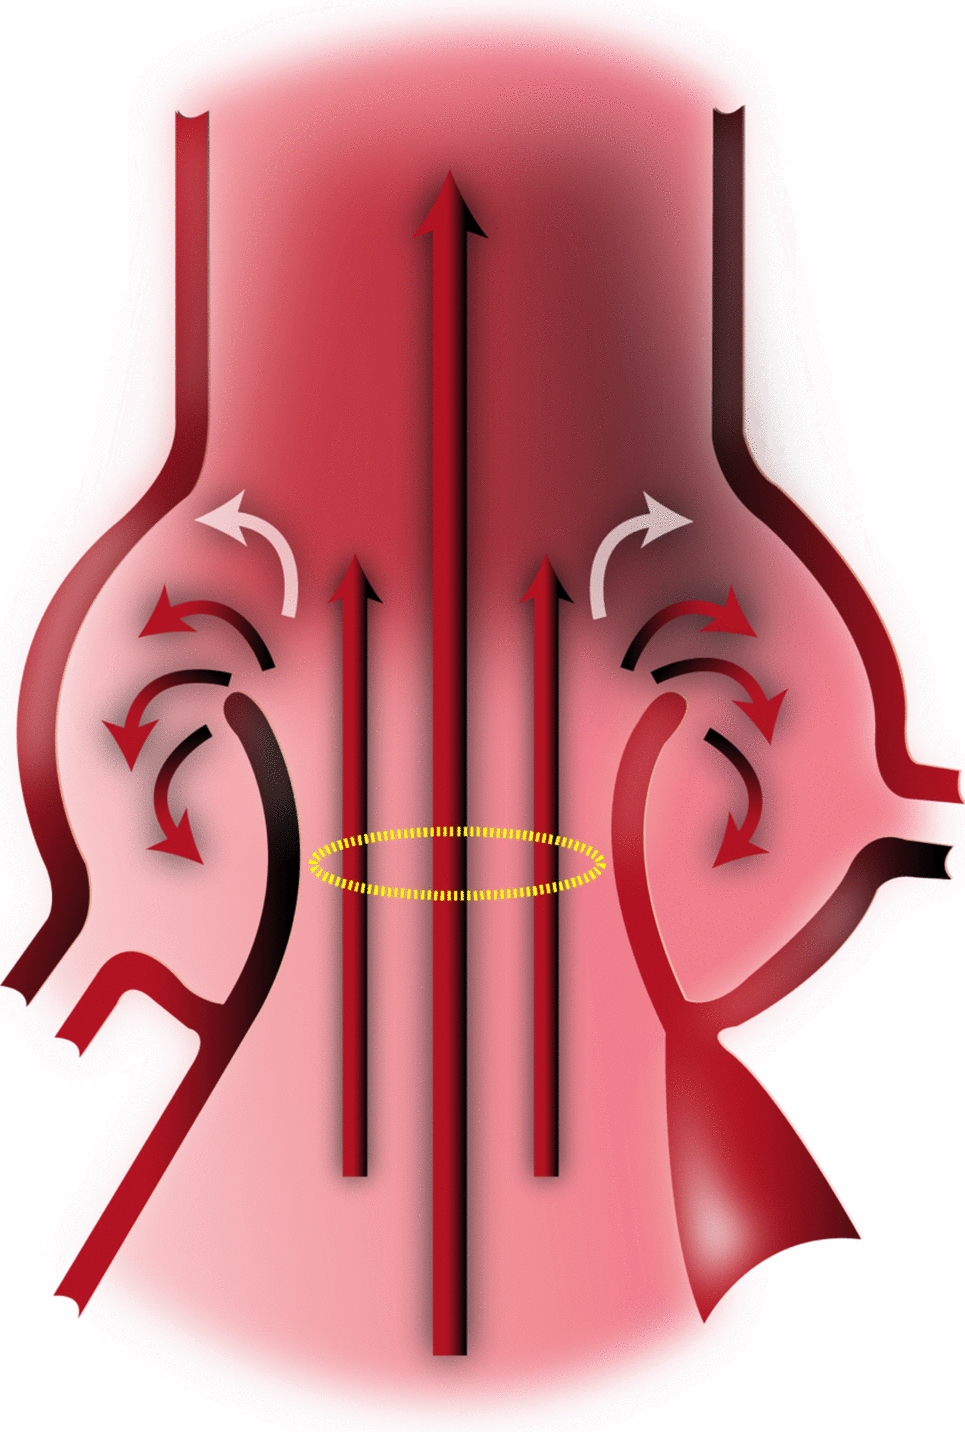
Previous studies have shown that diastolic filling dynamics of the LV play a crucial role in determining cardiac health. Early diastolic filling of the LV, or the E wave, is characterized by the formation of a vortex ring, a rotating fluid mass observed in both in vivo and in vitro studies [9, 22, 23]. Fluid transport by vortex ring formation has been shown to be more efficient than by a steady, straight jet of fluid, according to extensive in vitro experiments studying this process. In addition, it was recently found that vortex rings’ maximum growth is constrained by energetic considerations [24]. These findings point to the potential for optimization of vortex ring formation in fluid transport processes occurring in nature, which is particularly important for biological systems that rely on such processes for their survival. Vortex formation can, in theory, dictate the optimal kinematics of any biological fluid transport system, including the human heart, according to a study that used in vivo and in vitro data to back up this claim [25].
Vortex formation time and ejection fraction
Ejection fraction (EF) is measured when examining left ventricular systolic function. EF is expressed as a percentage and is defined as the proportion of the end-diastolic volume that is ejected during systole. According to the guidelines, the recommended method for calculating EF is Simpson’s biplane method [26,27,28].
$$EF\% = \frac \right) - End~Systolic~Volume~\left( \right)}}}~ \times 100$$
(1)
VFT is a dimensionless index used to measure vortex formation. As the index is dimensionless, it has the potential to be a useful measurement [29]. In previous studies, VFT was determined in vitro using a piston/cylinder design in a water tank based on average flow speed Ut, liquid duration (t), and pipe diameter (D) [24]. According to the study such correlation can be described with the Eq. 2.
$$T = \frac \cdot t}} = \frac$$
(2)
Thus, the equation can be expressed as a ratio of the length (L) to the diameter of the flow (D) [24]. According to the studies the maximal VFT is T ≈ 4 which is the most efficient and optimal transport of liquid [24]. By incorporating factors that impact blood flow from the left atrium (LA) to the LV, the equation may be altered to estimate the left ventricle’s vortex ring. Since mitral valve flow is linked to LV function, an EF-based index has been established according to the Eq. 3 and Eq. 4.
$$T = \frac} \cdot \alpha ^ \cdot EF$$
(3)
$$~\alpha = \frac} }}}}~$$
(4)
where indicates the ratio between the end-diastolic volume EDV1/3 and the diameter of the mitral annulus. Variable β represents the ratio of the atrial contraction volume to the total inflow via the mitral valve [24]. The range of VFT during normal left ventricular function is 3.3 to 5.5, as determined by previous in vitro vortex formation studies and observations of optimal VFT. Mitral valve stenosis and pathological conditions that impact mitral annulus diameter can result in an increase in VFT, whereas a reduction in EF can lead to a decrease in VFT by approximately 1.5 to 2.5. [24].
For the calculation of variable β needed for the further calculation of VFT, the variables from the Eq. 5 were used.
$$~~~\beta = ~\frac }} + VTI_ }}~$$
(5)
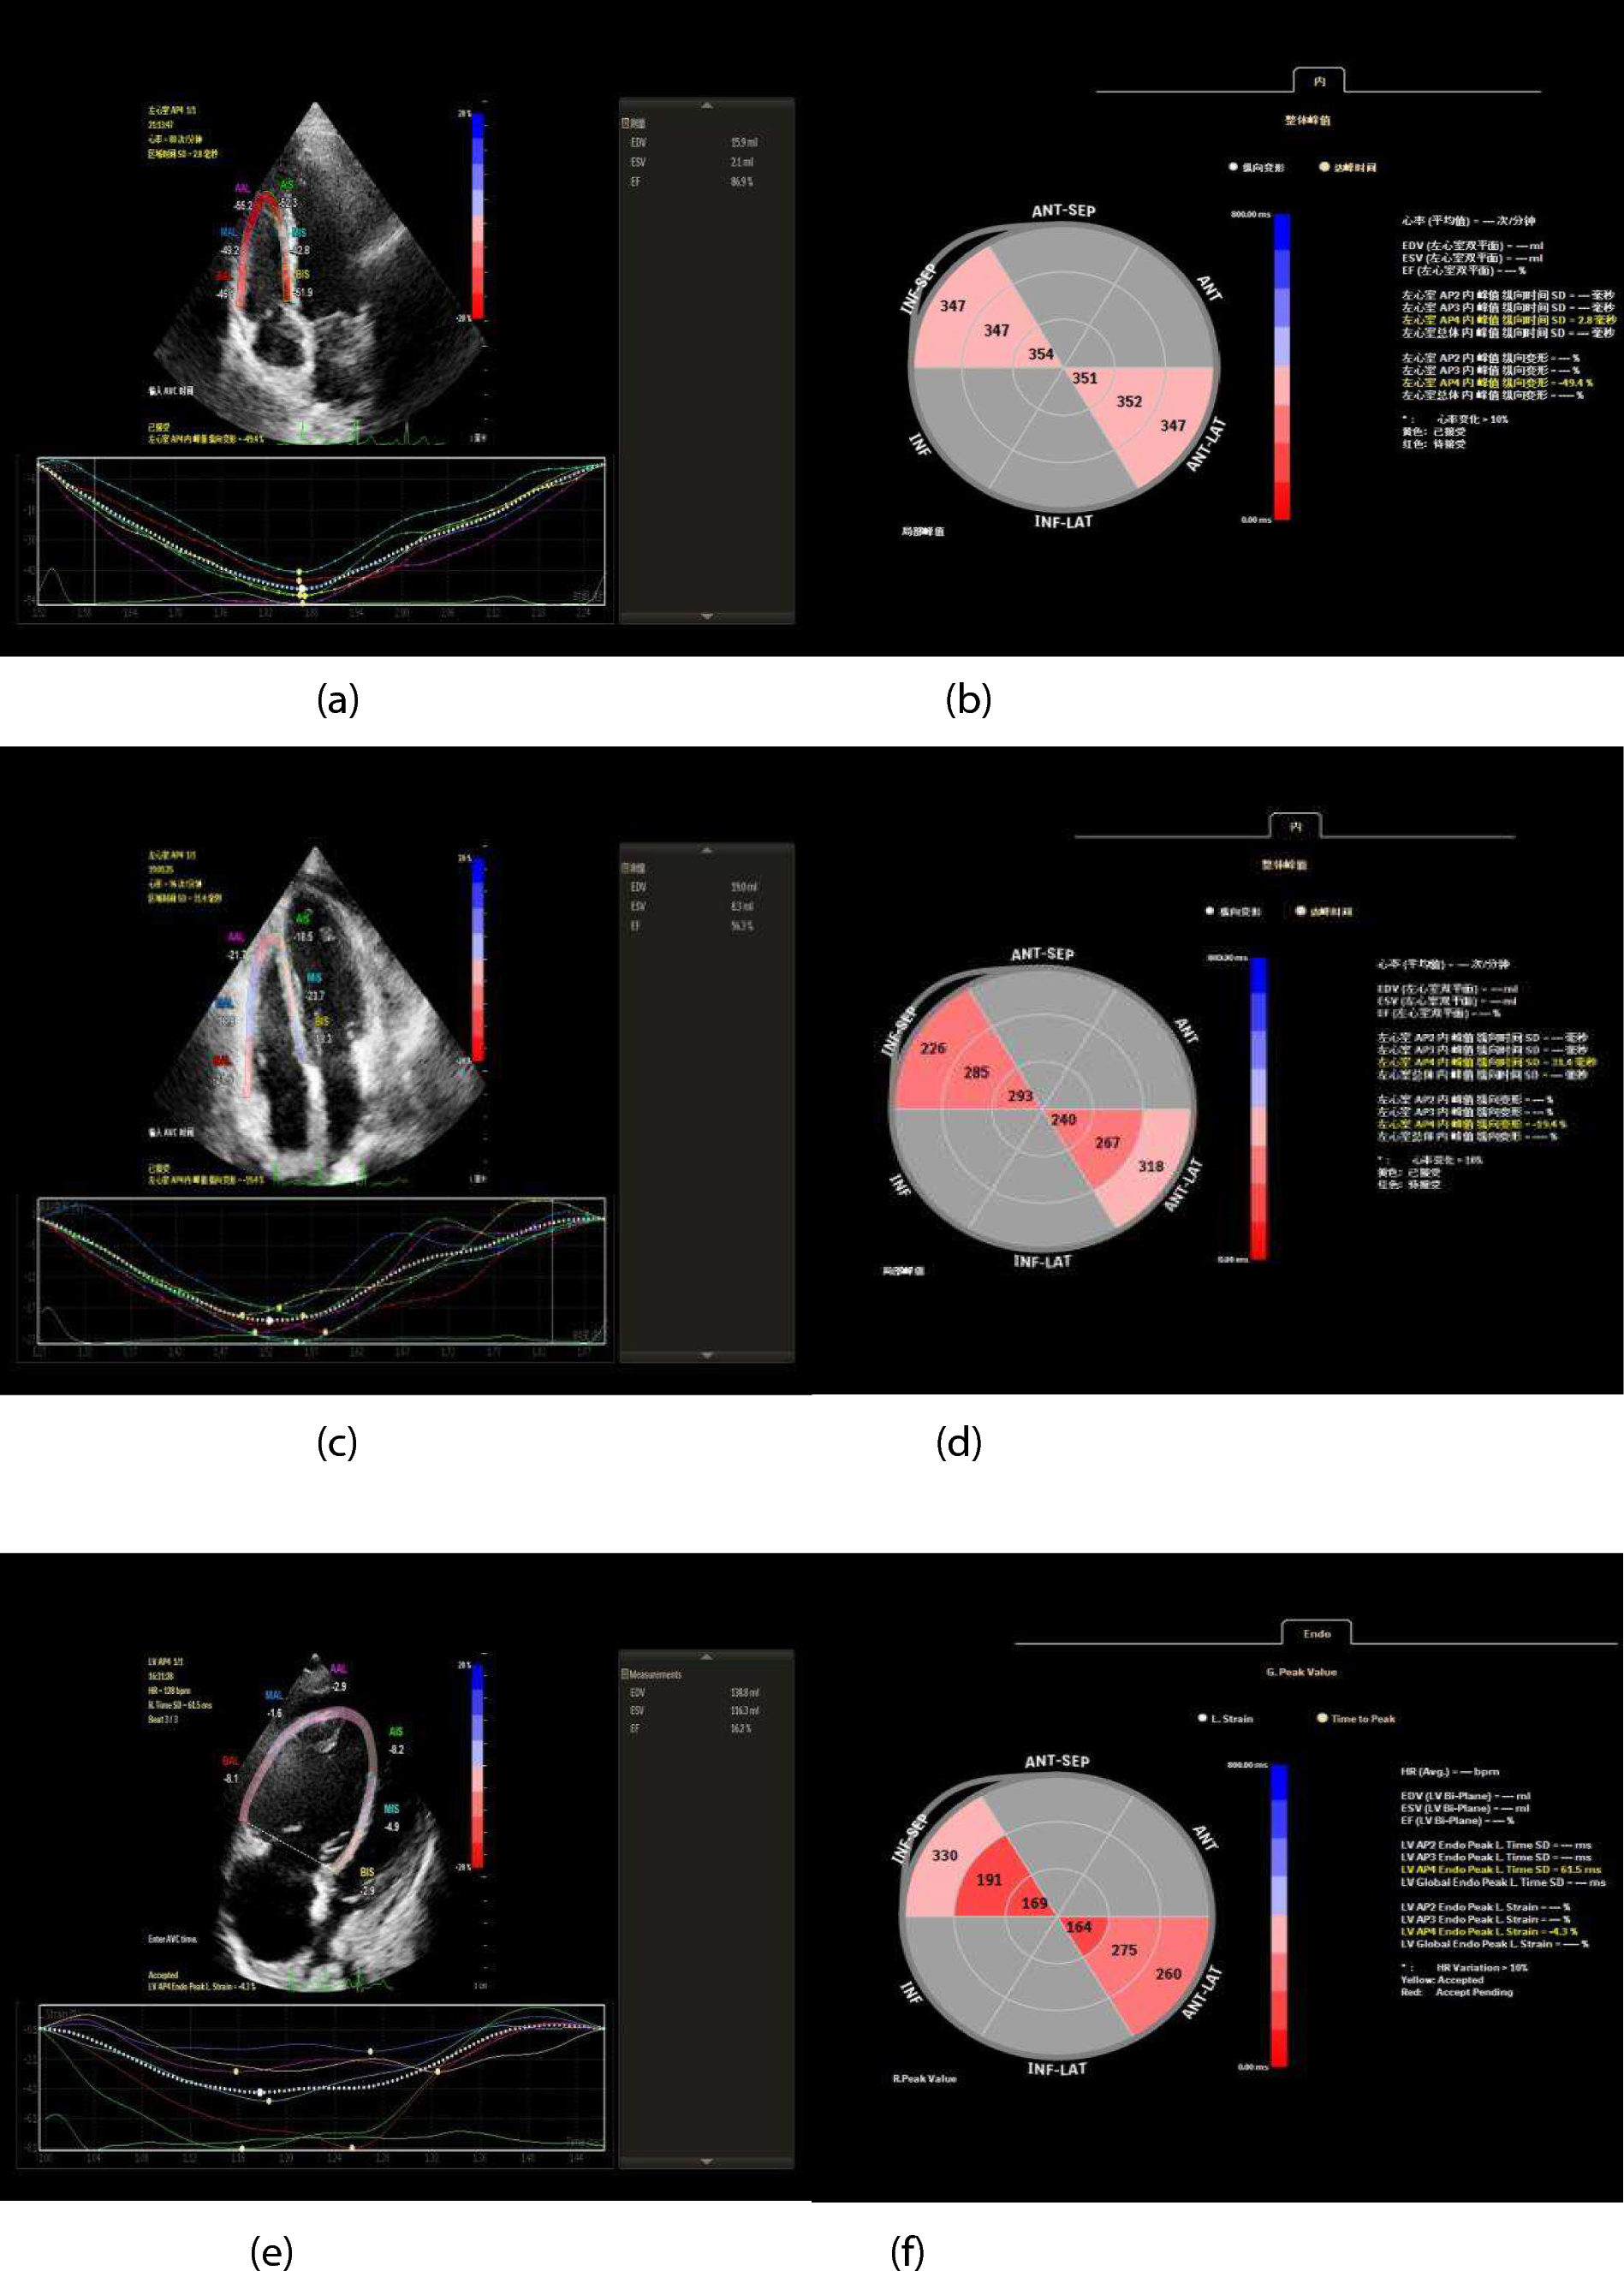
Velocity time integral A (VTIA) and Velocity time integral E (VTIE) were measured in order to determine, which is the ratio of VTIA to the total transmittal input (i.e., VTIE + VTIA). The determination of the inflow through the mitral valve is performed by using the pulsed doppler measurement method. The E and A waves were found while monitoring mitral inflow. The VTI is expressed in centimeters and is the inflow’s average velocity (cm/s) multiplied by the ejection time [29].
Mitral inflow and diastolic function
During the process of systole, blood is pumped through the aortic valve from the left ventricle. This results in the decrease of pressure in LV and the closure of aortic valve [30]. It comprises of four phases: Isovolumic relaxation time, fast filling, diastasis, and atrial contraction. After aortic valve closure, Isovolumic relaxation time (IVRT) occurs. This is followed by a rapid drop in left ventricular pressure and myocardial relaxation. The ending of IVRT appears when the pressure of the LA drops below the pressure in LV, causing the mitral valve to open [31]. During the rapid filling phase of the cardiac cycle, the flow of blood from the LA to the LV is induced by a pressure differential between the two chambers, with higher pressure in the LA causing blood to flow into the lower pressure in LV. During diastasis, the pressure difference between the left atrium and left ventricle is gradually equalized as blood flows into the ventricle, resulting in a period of decreased blood flow velocity in the absence of significant pressure gradients. Atrial contractions fill the LV as left atrial pressure surpasses LV pressure. Atrial contraction contributes 20% to healthy left ventricular filling [31, 32]. Using a pulsed wave doppler placed between the mitral valve tips in the apical four-chamber projection and measuring mitral inflow, the diastolic function of the LV can be evaluated. With pulsed wave doppler, the maximum speed during rapid filling (E) and atrial contraction (A) can be measured to characterize diastolic blood flow across the mitral valve [31].


留言 (0)