
記住我

An IRB-approved, retrospective study with waiver of informed consent analyzed imaging from all consecutive patients over a 12 month period who had a CMR for native AoV disease, and met the following criteria. (1) Aortic flow quantification obtained at AoV level plus at least 1 other level (STJ and/or AAo). (2) Complete LV volumetric assessment (short axis cine stack). (3) No ventricular septal defect (VSD), and no or trace MR documented both by the MRI and an echocardiogram done within a year of the MRI (with no interceding cardiac interventions) to ensure excellent expected correlation between LV SV and aortic forward flow. (4) No subaortic stenosis. (5) No supravalvar aortic stenosis or significant coarctation (clinical pressure gradient > 20 mm Hg). (6) No prior aortic valve interventions. (7) High quality complete MRI dataset.
Patients underwent CMR on a commercially available 1.5 Tesla scanner (Philips Achieva, 200 mT/m/ms gradient, 8-channel SENSE-XL-Torso coil, Philips Medical Systems, Best, The Netherlands) or 3 Tesla scanner (Philips Ingenia, 200 mT/m/ms gradient, 16-channel SENSE-XL-Torso coil, Philips Medical Systems, Best, The Netherlands). After the scout images, an axial, single shot, steady-state free precession (SSFP), non-electrocardiogram-gated stack of images was performed through the thorax during an end-expiratory breath-hold. Standard electrocardiogram-gated 2-, 3-, 4-chamber and short-axis as well as LVOT SSFP cine images were obtained using the following parameters: repetition time 2.5 ms, TE 1.3 ms, flip angle 70°, field of view 300_260 mm, matrix 128_128, SENSE reduction factor 1.3, 30 phases per cardiac cycle, and a typical breath-hold of approximately 12 s on the 1.5 T scanner, and repetition time 3 ms, TE 1.5 ms, flip angle 55°, field of view 320_320 mm, matrix 184_180, SENSE reduction factor 2, 30 phases per cardiac cycle, and a typical breath-hold of approximately 10 s on 3T scanner. In addition, a 5–8 slice SSFP cine stack (which we refer to as AoV Short Axis Stack) was obtained across LVOT, AoV, and aortic root, with a plane parallel to the AoV hinge points based on two double oblique LVOT cine images (Fig. 2). This stack was used for two purposes: (1) define AoV morphology, and (2) choose the slice position that best visualizes the aortic leaflets throughout systole, which was then used to perform flow quantification at the AoV.
Fig. 2
A shows axial slice of AAo at the level of the right pulmonary artery (RPA). B (LV 3 chamber view) and C (LVOT view) show the slice position of phase contrast velocity encoded sequences at the level of the AAo (dashed line) and STJ (dotted line). The AoV short axis stack (rectangle) consisted of a 5–8 slice SSFP cine stack with a plane parallel to the AoV hinge points as seen on 3 chamber and LVOT views
Through-plane electrocardiographically gated Phase Contrast Velocity Encoded sequences were done during a breath-hold at end expiration at AoV level, plus one or both of the following two locations: STJ, and/or mid AAo. Flow at AoV level was planned by choosing the slice position from the above-described AoV Short Axis Stack which best shows the entirety of the aortic valve leaflets throughout all of systole. If two slices met this criterion, the technologist chose the slice that showed the leaflet boundaries most clearly. Flow at the STJ was systematically planned by placing the slice at the sinotubular junction such that it is simultaneously perpendicular to the aorta as seen on two orthogonal planes (3 chamber view and LVOT view, as shown in Fig. 2). AAo flow was planned by initially selecting an axial slice of the AAo at the level of the right pulmonary artery (RPA), then adjusting the slice orientation to also be simultaneously perpendicular to the aorta on the above-mentioned orthogonal views (Fig. 2). Typical sequence parameters were repetition time 4.8 ms, echo time 2.8 ms, flip angle 12°, field of view 300_260 mm, matrix 128_98, SENSE reduction factor 2, 30 phases per cardiac cycle, and a typical breath-hold of 12 s. An encoding velocity of 200 cm/s was initially used, which was increased by 100–200 cm/s increments in case of aliasing.
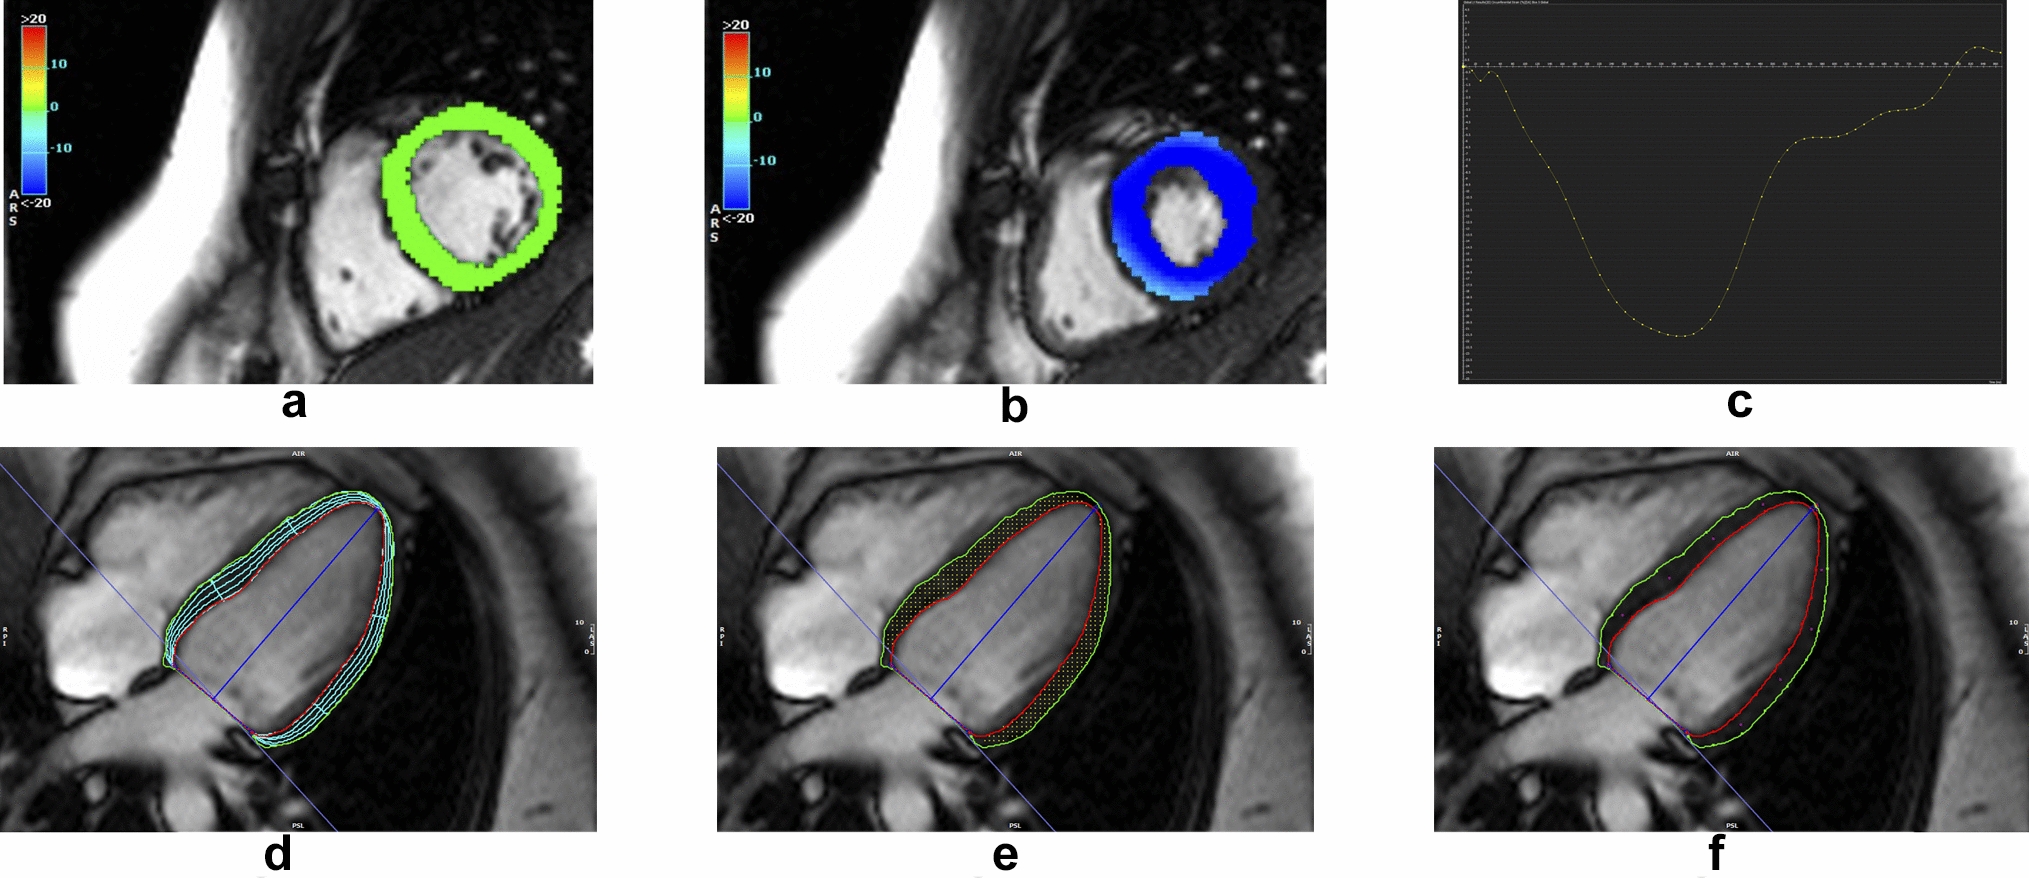
All studies were analyzed by one investigator (MY). Post-processing was performed using a dedicated software (CVI42 v. 5.1.0, Circle Cardiovascular Imaging Inc., Calgary, Canada). LV volumes included the LVOT, trabeculated myocardium and papillary muscles. Flow sequences at various levels were contoured to yield forward flow, reverse flow, and regurgitant fraction, using standard contouring (SC) methods, by placing contours around the entire cross section of the aortic lumen, as previously described in the literature [2, 3, 5]. In addition to SC at all levels, a novel contouring method was performed at AoV level, consisting of SSC of the area demarcated by the AoV leaflets, aided by both the magnitude and phase velocity map images from Phase Contrast acquisition. During diastole, the entire aortic cross section was included in the flow, similar to SC. Figure 3 shows examples of SSC for a bicuspid AoV (A and B) and tricuspid AoV (C and D). Care should be taken to accurately delineate the aortic valve leaflets during systole, as the leaflets move and change configuration, especially in early systole and end-systole as the valve is opening or closing with low velocity flow, whereby the magnitude images become particularly helpful to demarcate the valve opening. Figure 4 shows an example of how SSC was done on two representative phases in systole (peak systole, and end-systole right before valve closes, as well as during mid-diastole), in a patient with tricuspid AoV.
Fig. 3
SSC at AoV level demonstrated in patient with bicuspid AoV (A magnitude image, B phase velocity map image), and in another patient with a tricuspid AoV (C magnitude image, D velocity image). Note that the proper choice of aliasing velocity (just above Vmax) creates more visual contrast on the velocity map images that aids in contour placement
Fig. 4
SSC contouring at AoV level is demonstrated on magnitude images in a patient with tricuspid AoV, during select representative phases of the cardiac cycle: A (peak systole), B (end-systole), C (end-systole, contour omitted to show how the leaflet borders were visualized for demarcation), and D (mid-diastole, demonstrating how the whole lumen, not selective contouring, was done during diastole)
Additional MRI data collected included AoV morphology, AoV area by planimetry as previously described [1], and maximum aortic root and ascending aorta diameters (measured on multiplane reconstruction of 3D SSFP sequences).
As a quality measure, 10% of the studies were randomly selected and blindly contoured by another investigator, DK, to assess the agreement between two readers with respect to forward flow and regurgitant fraction by SSC.
To assess the feasibility of SSC in patients without AoV disease, 10 controls were included who had a CMR between June and July 2020, and had: MRI-derived LVEF ≥ 55%, trileaflet AoV without stenosis or regurgitation, no VSD and no or trace mitral regurgitation verified by echocardiography and CMR, and Phase Contrast Velocity Encoded sequence performed at AoV plus one other level. Contouring and analysis was done using same methods described above.
Echocardiographic data which was collected included AoV morphology, maximum velocity (Vmax), and degree of aortic and mitral regurgitation assessed per American Society of Echocardiography.
Statistical analysisThe primary aim of this analysis was to assess the accuracy of four CMR aortic flow measurement techniques. Since included patients had little to no MR, true aortic forward flow was assumed to be equal to LV SV. The bias in each technique’s estimate of aortic forward flow (\(\overline\)) was therefore calculated as the mean difference between aortic forward flow and stroke volume. Limits of agreement (LOAs) [8], which characterize the precision of the technique as well as its bias, were also calculated. The LOAs were defined as \(\overline\pm 1.96s\), where \(s\) is the standard deviation of the differences between aortic forward flow and stroke volume.
Several variables were assessed as potential predictors of increased discrepancy between LV SV and aortic forward flow: Vmax by Echo, valve morphology, CMR-derived LVEF, aortic root max dimension, AAo max dimension, and AoV planimetry. A series of simple linear regression models were fit, where the discrepancy between LV SV and aortic forward flow was the dependent variable. Each MRI measurement technique was assessed separately, and Holm’s adjustment method was used to maintain a family-wise error rate of 0.05.
To assess the agreement between the two readers with respect to SSC in 10 randomly selected individuals, the intra-class correlation coefficient was computed. A two-way random effects model was used, assuming a single rater.
留言 (0)