
記住我
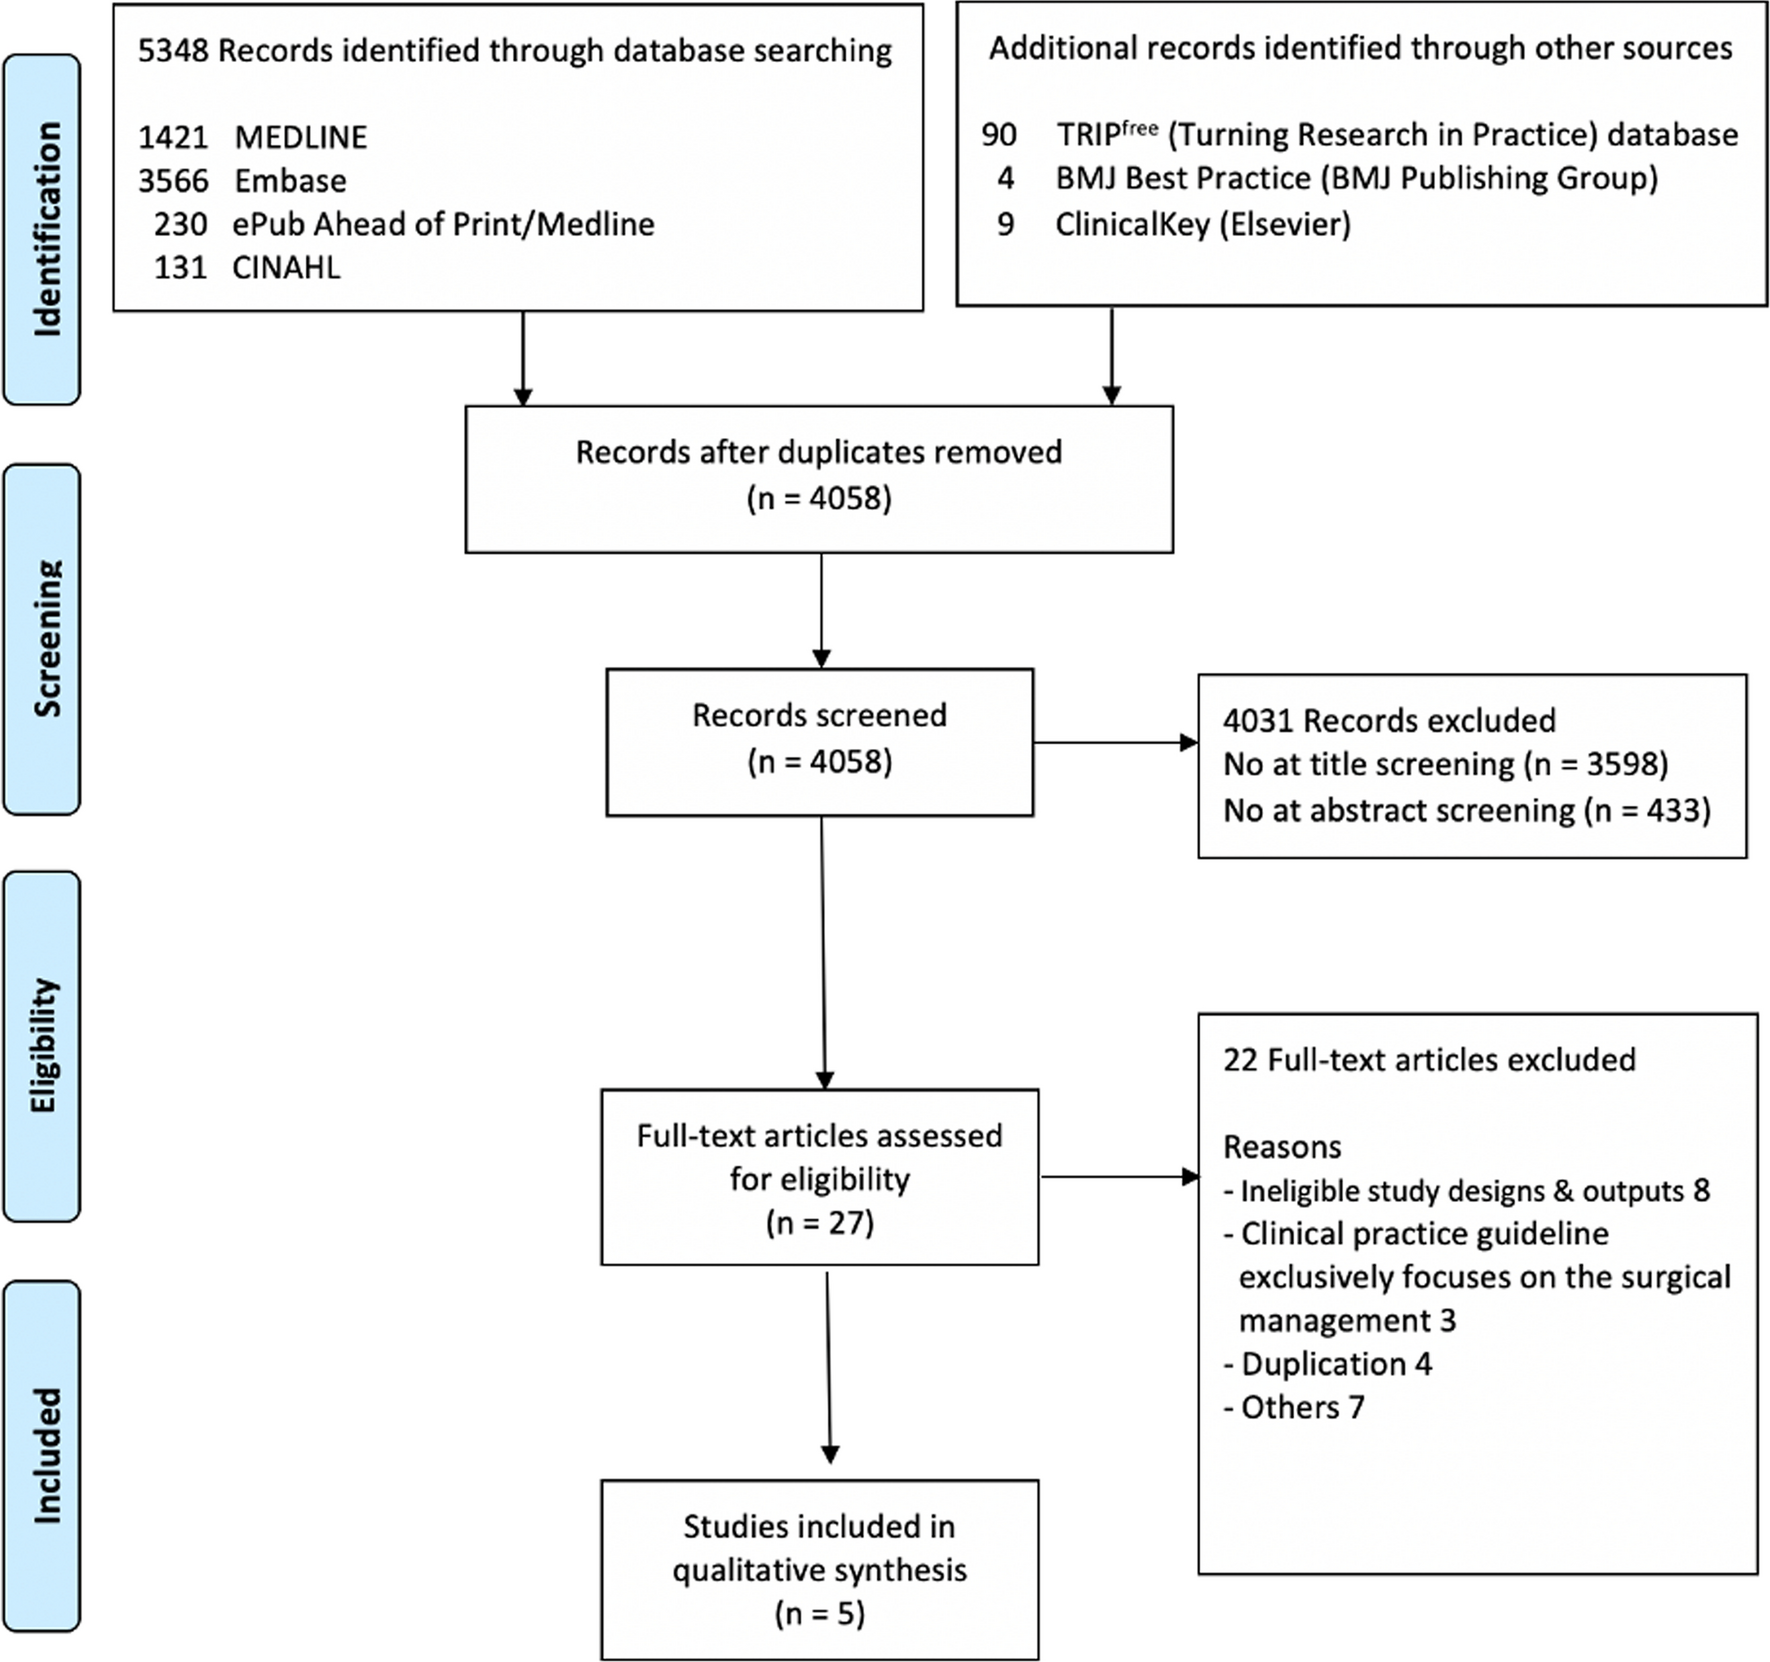
The literature search identified 332 potentially relevant articles. Eighty-six studies were immediately identified to be unrelated and excluded. The remaining 246 articles were carefully read to determine whether they met our eligibility criteria. A further 226 studies were excluded for the following reasons: trial performed in mannequins (n = 88); not a randomized controlled trial (n = 51); laryngeal mask airway used (n = 27); a review article (n = 15); a cardiopulmonary resuscitation trial (n = 14); indirect laryngoscope not used (n = 13); not involving novice operators (n = 9); other reason (n = 8); involving pediatric patients (n = 4); and nasal intubation used (n = 2). The remaining 15 articles (17 trials) met our inclusion criterion and contained the data necessary for comparison (Fig. 1). These 15 articles are summarized in Table 1.2,15,16,17,26,27,28,29,30,31,32,33,34,35,36,37
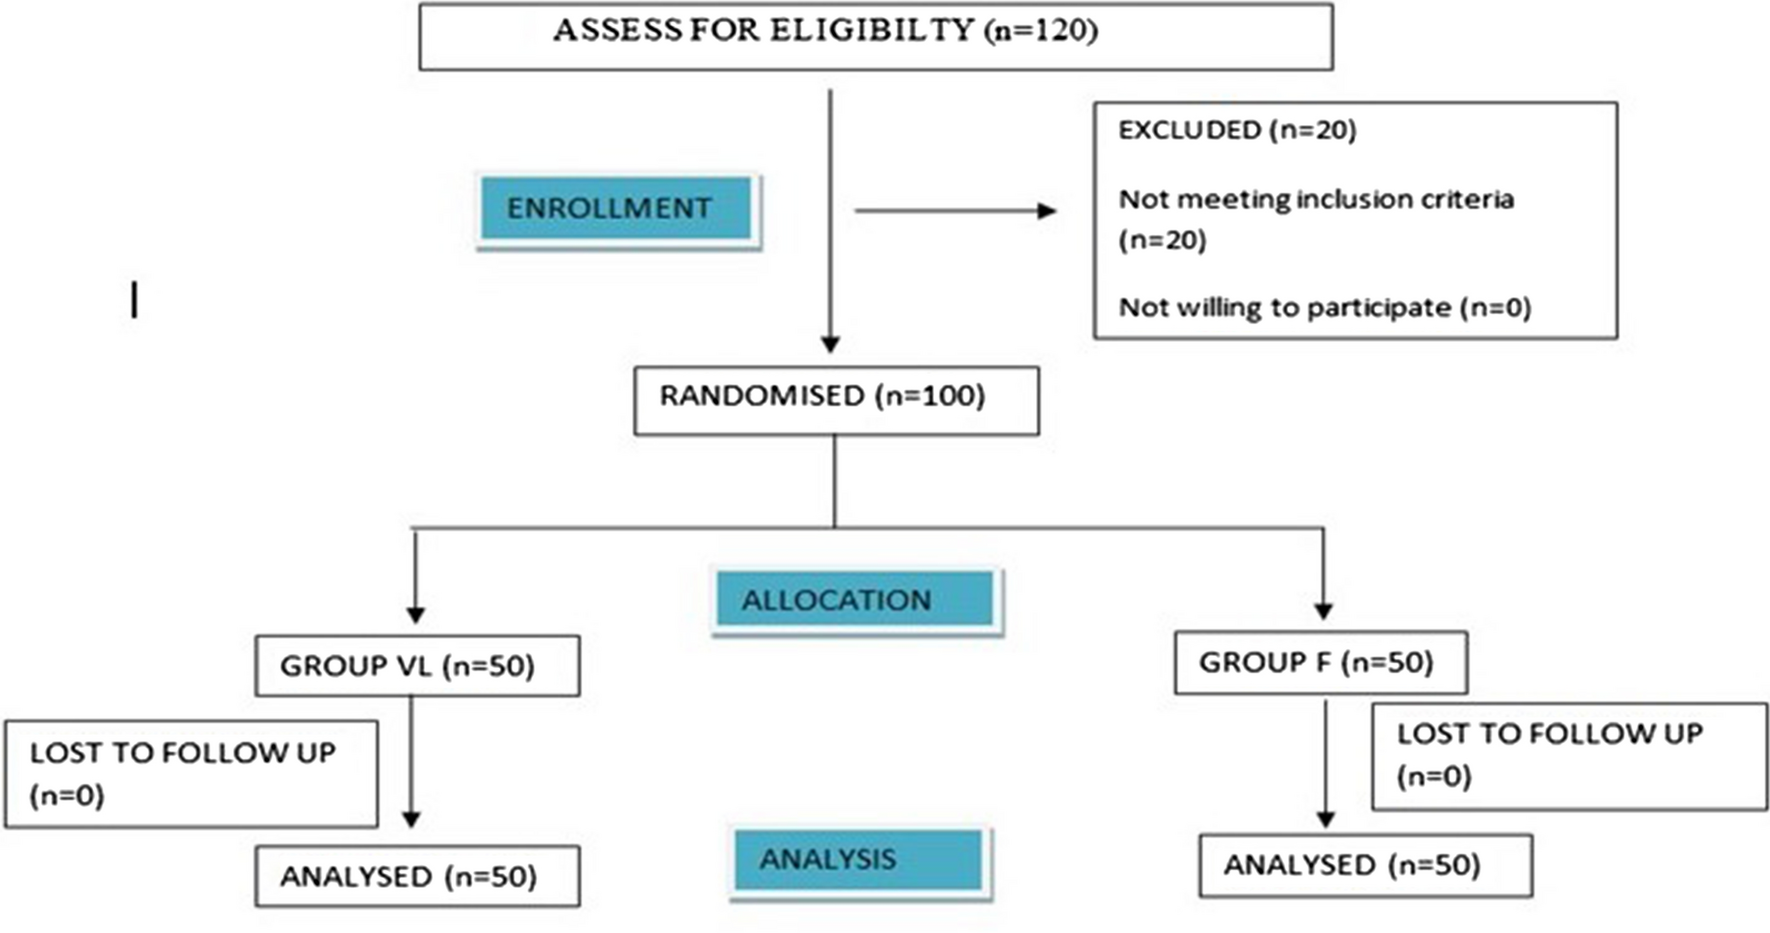
Fig. 1
Systematic review and meta-analysis flow chart
RCT = randomized controlled trial
Table 1 Characteristics of included studiesThe included studies were published between 2009 and 2018. The most common indirect laryngoscope used was the Airtraq™ (Mercury Medical®, Clearwater, FL, USA; six trials), followed by the GlideScope® (Verathon Inc., Bothell, WA, USA; four trials), the McGRATH™ (Medtronic PLC, Dublin, Ireland; three trials), the Pentax Airway Scope (Nihon Kohden Corp., Tokyo, Japan; two trials), the C-MAC® (Karl Storz SE & Co. KG, Tuttlingen, Germany; one trial), and the Truview EVO2 (Leica Geosystems AG, Heerbrugg, Switzerland; one trial). The definition of a novice operator was a resident in ten trials and a medical student in the remaining five trials. The preoperative condition of the airway was reported to be normal in all but one trial. All direct laryngoscopes used were Macintosh laryngoscopes (Table 1).
Meta-analysis resultsIn total, 1,169 patients were intubated using an indirect laryngoscope and 1,121 using a direct laryngoscope.
Intubation performanceIn the 17 trials, the tracheal intubation success rate was significantly higher with an indirect laryngoscope than with a direct laryngoscope (RR, 1.15; 95% CI, 1.07 to 1.24; P = 0.0002; Cochrane’s Q = 134.2; I2 = 88%; Fig. 2). Absolute risk reduction was 17.7% (indirect laryngoscopy, 89.1% vs direct laryngoscopy, 71.9%). For success rate, our TSA revealed that the Z-curve crossed the efficacy boundary, although the RIS was not reached (ESM eFig. 4).
Fig. 2
Forest plot of the success rate of tracheal intubation using indirect laryngoscopy versus direct laryngoscopy
Glottic visualization was evaluated in nine trials and was better when an indirect laryngoscope was used (RR, 1.76; 95% CI, 1.36 to 2.28; P < 0.001; Cochrane’s Q = 45.5; I2 = 85%; Fig. 3). Absolute risk reduction was 36.6% (indirect laryngoscope 83.3% vs direct laryngoscope 47.6%). The Z curve did not reach the TSA monitoring boundary for benefit, and the accrued sample size (n = 984) was 22.7% of the required sample size (n = 4,328) (ESM eFig. 5).
Fig. 3
Forest plot of glottic visualization with indirect laryngoscopy versus direct laryngoscopy (Cormack–Lehane grade 1 and 2 vs other grades)
Intubation time was significantly shorter with an indirect laryngoscope than with a direct laryngoscope (WMD, −9.06 sec; 95% CI, −16.4 to −1.76; P = 0.02; Cochrane’s Q = 508.3; I2 = 98%; Fig. 4). The Z curve crossed the futility boundary. Trial sequential analysis revealed that the accrued information size (n = 1,990) was 76.5% of the estimated RIS (n = 2,600) (ESM eFig. 6).
Fig. 4
Forest plot of intubation time for tracheal intubation using indirect laryngoscopy versus direct laryngoscopy
Subgroup analysisIn addition, the indirect and direct laryngoscopy groups were classified and analyzed according to whether a tracheal tube guide was used. The subgroup analysis according to whether or not a tracheal tube guide was used found that successful intubation and glottic visualization rates were significantly better with both indirect laryngoscopes than with a direct laryngoscope (with tracheal tube guide, success rate: RR, 1.24; 95% CI, 1.06 to 1.44; P < 0.006; Cochrane’s Q = 68.7, I2 = 90%; glottic visualization: RR, 2.38; 95% CI, 1.59 to 3.57; P < 0.001; Cochrane’s Q = 14.7; I2 = 80%, without tracheal tube guide, success rate: RR, 1.11; 95% CI, 1.01 to 1.23; P = 0.03; Cochrane’s Q = 61.5, I2 = 88%; glottic visualization: RR, 1.76; 95% CI, 1.36 to 2.28; P < 0.001; Cochrane’s Q = 45.5; I2 = 85%) (Figs 2 and 3). Nevertheless, intubation time using an indirect laryngoscope with or without a tracheal tube guide was comparable to that using a direct laryngoscope (Fig. 4).
Adverse eventsAdverse events during tracheal intubation were compared according to whether an indirect laryngoscope or direct laryngoscope was used. The incidence of all adverse events during tracheal intubation was significantly lower with an indirect laryngoscope (esophageal intubation: RR, 0.16; 95% CI, 0.04 to 0.61; P = 0.007; Cochrane’s Q = 2.18; I2 = 8%; oropharyngeal injury: RR, 0.42; 95% CI, 0.23 to 0.76; P = 0.004; Cochrane’s Q = 2.50; I2 = 0.0%; oxygen desaturation; RR, 0.51; 95% CI, 0.27 to 0.97; P = 0.04; Cochrane’s Q = 0.08; I2 = 0.0%; Table 2).
Table 2 Comparison of adverse events during tracheal intubation using indirect laryngoscopy versus direct laryngoscopyQuality of evidenceThe quality of evidence for success rate, glottic visualization, and intubation time according to type of laryngoscope used by a novice operator was graded as “very low.” All of the included studies were found to have a moderate risk of bias because the operator could not be blinded to the type of laryngoscope used. Heterogeneity was high for all parameters, and there was publication bias in terms of the success rate and glottic visualization rate. Accordingly, the quality of evidence was downgraded to “very low” (Fig. 5).
Fig. 5
The Grading of Recommendations Assessment, Development and Evaluation (GRADE) approach
Results of publication biasThe Begg’s test identified publication bias for success rate (Kendall’s statistic = 50.0; Z = 1.85; P = 0.02) and glottic visualization (Kendall’s statistic = 20.0; Z = 2.09; P = 0.06). No publication bias was found for intubation time (Kendall’s statistic = −12.0; Z = 0.59; P = 0.4). Figure 6 summarizes the risks of bias.
Fig. 6
Green circles, red circles, and yellow circles indicate “low risk of bias,” “high risk of bias,” and “unclear risk of bias,” respectively
留言 (0)