Participants
The SKYLIGHT 1 and 2 study methodologies (NCT04003155 and NCT04003142, respectively) have been published previously [14, 15]. Briefly, SKYLIGHT 1 and 2 were identical, phase 3, randomized, placebo-controlled, double-blind studies conducted in Europe and North America that investigated fezolinetant efficacy and safety. Individuals who were female at birth (≥ 40–≤65 years) with moderate-to-severe VMS (seven hot flashes/day) were enrolled. The participants were randomized to receive once-daily doses of fezolinetant 30 mg, fezolinetant 45 mg, or placebo (1:1:1) during a 12-week double-blind period. Completers entered a 40-week active treatment extension, where fezolinetant-treated individuals continued their initial dose, while the placebo group was re-randomized to receive fezolinetant 30 mg or 45 mg.
PROMIS SD-SF-8b
The PROMIS SD-SF-8b comprises eight items selected from the PROMIS bank to measure sleep disturbance over the past 7 days [21, 22]. Total score is calculated by summing the items (range: 8–40; higher score: more disturbed sleep). If some items were not completed, it was not possible to calculate the total score and the result was considered missing.
Additional patient-reported outcome (PRO) measures
Eight PRO measures were used to evaluate PROMIS SD-SF-8b; VMS episodes captured using an electronic diary; PROMIS Sleep-Related Impairment – Short Form 8a (PROMIS SRI-SF-8a; eight items); Menopause-Specific Quality of Life (MENQOL) questionnaire (29 items); Patient Global Impression of Severity Sleep Disturbance (PGI-S SD) measure (single item); Patient Global Impression of Change Sleep Disturbance (PGI-C SD) measure (single item); Patient Global Impression of Change Vasomotor Symptoms (PGI-C VMS) measure (single item); EQ-5D-5 L (five questions) including EQ Visual Analog Scale (VAS); and Work Productivity and Activity Impairment questionnaire specific to Vasomotor Symptoms (WPAI-VMS; six items; Additional file 1: Further Methods) [23,24,25,26]. Given the nature of these specific measures, it is likely that useful associations can be derived following the psychometric evaluation of the PROMIS SD-SF-8b.
All the PRO assessments were self-administered during the site visit before any other study procedures were performed. The assessments were conducted electronically using a tablet. All assessments were completed at baseline and weeks 4 and 12, apart from the PGI-C assessments (weeks 4 and 12 only because PGI-C analyzes change from baseline). The assessments were consistently conducted in the following order: PGI-C VMS, PROMIS SD-SF-8b, PGI-S SD, PGI-C SD, PROMIS SRI-SF-8a, MENQOL, EQ-5D-5 L, and WPAI-VMS.
Descriptive analyses
Completion rate was calculated by dividing the number of individuals who completed the PROMIS SD-SF-8b at each visit by the number of individuals in the full analysis set (FAS).
Descriptive statistics were provided for the PROMIS SD-SF-8b total score and the number of individuals who selected each answer. Baseline floor and ceiling effects were investigated, which were defined as > 20% of the responses for the lowest/least severe or highest/most severe options, respectively (calculated as 100% divided by the number of options [five]).
Psychometric evaluation
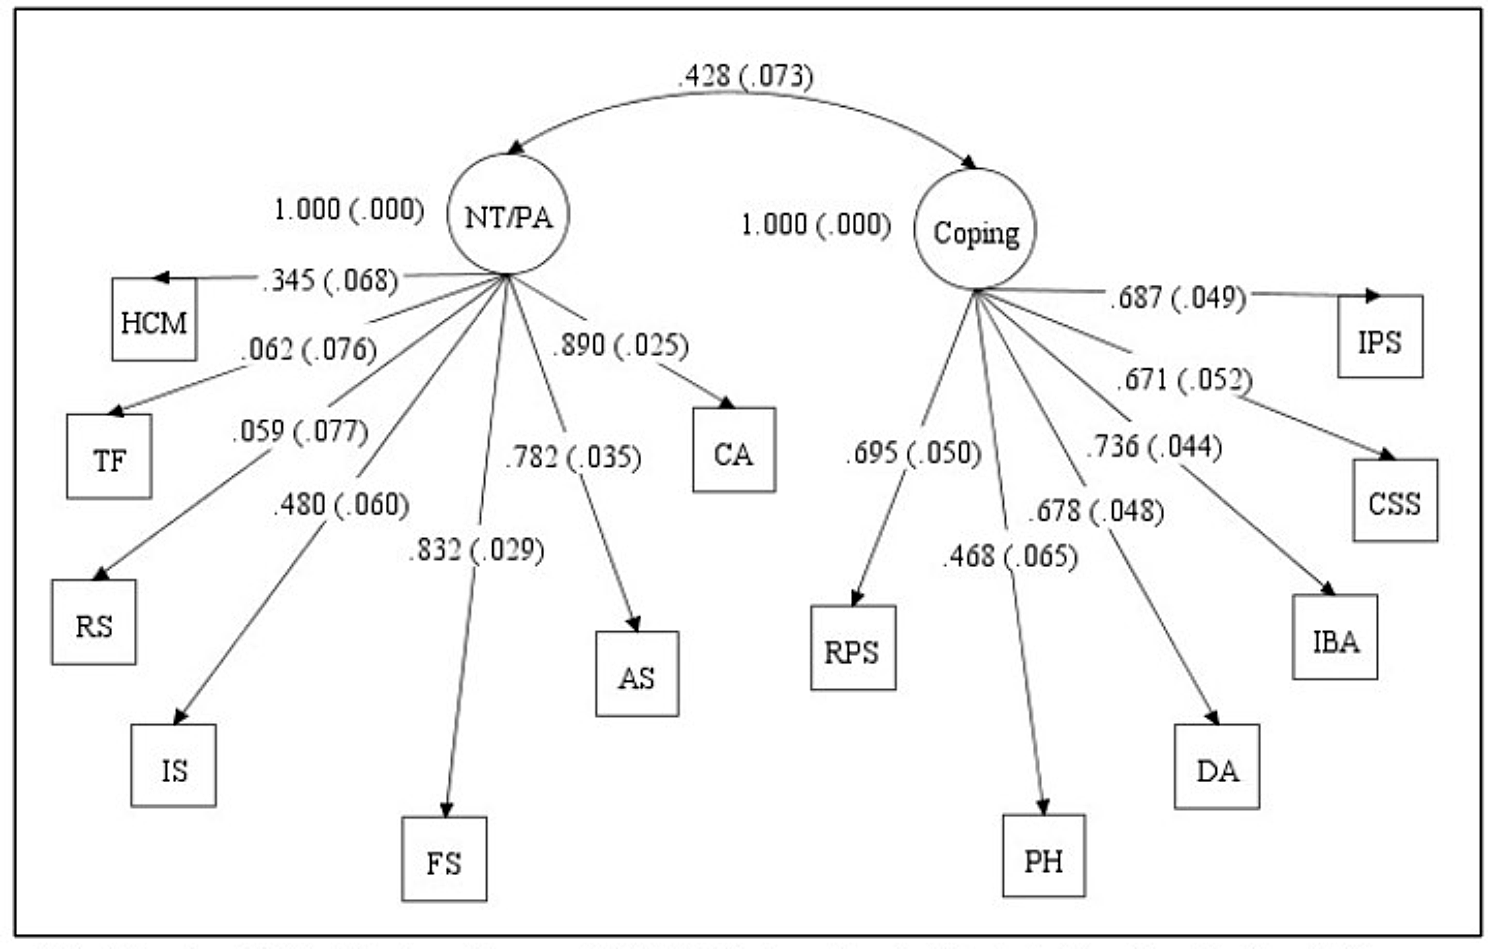
At baseline, a confirmatory factor analysis (CFA) was performed for the PROMIS SD-SF-8b items. As the data were categorical, the factor structure was defined using the unweighted least squares method. This method does not assume multivariate normality and is appropriate for ordinal data with ≤5 categories, like the PROMIS SD-SF-8b. Goodness-of-fit measures were developed to evaluate the model; standardized root mean residual (SRMR) and non-normed fit index (NNFI). To demonstrate good fit, the SRMR had to be below the recommended threshold of 0.08 and the NNFI had to be above 0.95 [27].
Internal consistency was assessed using Cronbach’s alpha coefficient (values ≥ 0.70: acceptable reliability [28]). Alpha-if-item-deleted results were derived, and McDonald’s omega was calculated (values > 0.80: good internal consistency) [29, 30]. Item-to-item correlations were calculated at baseline and item-total correlations were calculated at baseline and week 12. Among items expected to measure the same construct, correlations should fall in the 0.4 to 0.8 range [31]. For item-total correlations, however, too large a coefficient (e.g., ≥ 0.80) might suggest redundancy (e.g., one item is a restatement of another). The correlation between individual items and the total score omitting the item is provided for the item-total correlations. Test-retest reliability was evaluated using a two-way mixed, absolute agreement, single measure intraclass correlation coefficient (ICC; values 0.50–0.90: moderate-to-good reliability, values > 0.90: excellent reliability [32]). Test was defined as baseline and retest was defined as week 4. Stable individuals were required and were defined as participants reporting no change in PGI-S SD over this time.
Construct validity was evaluated using Spearman coefficients for convergent validity and analysis of variance with orthogonal planned comparisons for known-groups validity. For convergent validity, correlations were examined between PROMIS SD-SF-8b scores and other PRO measures at baseline. At least moderate correlations between overall/scale scores of similar constructs (r: >0.40) were expected [31]. Known-groups validity was assessed by examining baseline PROMIS SD-SF-8b scores across PGI-S SD categories to test whether PROMIS scores differed between adjacent PGI-S groups (i.e., “no problems” versus “mild problems”). The known-groups was the independent variable and PROMIS SD-SF-8b scores were the dependent variables.
Sensitivity to change was examined using Spearman correlations and analysis of covariance (ANCOVA). Correlations between changes in PROMIS SD-SF-8b and several PRO scores from baseline to week 12 were calculated. Concurrent improvement in PRO measures would result in moderate-to-strong correlations. In separate ANCOVA models controlled for baseline values, changes in PROMIS SD-SF-8b scores from baseline to week 12 were assessed for individuals reporting improvement (responders) versus individuals reporting no change/worsening (non-responders) for the PGI-S SD and PGI-C SD. The groups were identified using the PGI-S SD change from baseline to week 12 results and the PGI-C SD response at week 12.
As recommended by the Food and Drug Administration [19, 20], thresholds for meaningful within-patient change for PROMIS SD-SF-8b were estimated using anchor-based approaches, supplemented with distribution-based estimates and receiver operating characteristic (ROC) curves. Meaningful within-patient change was evaluated using the PGI-S SD and PGI-C SD as anchors. Spearman correlations between changes in anchor (Additional file 1: Table S1) and PROMIS SD-SF-8b scores were assessed between baseline and weeks 4 and 12 (suitable anchor correlation: >0.30 [33]). The distribution-based estimates included the effect size (Cohen’s d), half the baseline standard deviation (SD), and standard error of measurement (SEM; SD*√[1–r], where r equals internal consistency). Interpretation was based on conventional benchmarks (small [0.2], medium [0.5], or large [0.8] effect size [34]). For the anchor-based approach, descriptive statistics for change between baseline and weeks 4 and 12 were calculated based on improvement, no change, or worsening on the anchors. Multiple estimates are presented for each score owing to the multiple anchors and methods used to estimate responder definitions. Using the PGI-S SD and PGI-C SD, the thresholds for meaningful within-patient change were defined as a 2-point improvement and feeling “moderately better”, respectively. Mean changes in PROMIS SD-SF-8b for the PGI-S SD and PGI-C SD anchors were also calculated for the other change categories (Additional file 1: Table S1). For the triangulation, the thresholds were selected based on the within-patient change for anchor improvement categories (PGI-S SD: 2-point improvement, PGI-C SD: “moderately better”), sufficient anchor correlations ≥ 0.30, and the lower 95% confidence interval (CI) estimates for the individuals experiencing “no change” on the anchors (the lower CI: greatest improvement). ROC curves were consulted as these provide the best estimate of the point that divides individuals who report minimal/little/no change and those who report change. Due to the variability in the change estimates between the PGI-S SD and PGI-C SD anchors, the selected thresholds were in the middle of the range. For the anchor-based approach (ROC curve), sensitivity and specificity were calculated to characterize the association between PROMIS SD-SF-8b changes and anchor improvement. ROC curves were derived using logistic regression analyses. For this analysis, the change groups in Additional file 1: Table S1 were collapsed into two groups: improvement and minimal/no improvement (Additional file 1: Table S2). Responder status was the dependent variable and change from baseline in PROMIS SD-SF-8b score was the independent variable. The clinically meaningful threshold was defined by the change value corresponding to the cutpoint in the ROC space that minimizes the sum of squares of (1-sensitivity) and (1-specificity), closest to the top-left corner (1,0) of the ROC space [35].
Statistical analyses
All analyses were conducted using pooled treatment data from SKYLIGHT 1 and 2. All PRO analyses were performed on the FAS (all randomized individuals who received ≥ 1 dose of study drug). Statistical comparisons involved two-sided tests at the α = 0.05 level. For point estimates, 95% CIs were used. All data processing was performed using SAS Version 9.3 or higher (SAS Institute, Cary, North Carolina, USA).


留言 (0)