Data source and study population
The NHANES is a continuing series of cross-sectional surveys, a nationally representative health survey conducted by the National Center for Health Statistics (NCHS) of the Centers for Disease Control and Prevention. The NHANES is a program of studies designed to examine the health and nutritional status of adults and children in the U.S. [22]. The surveys use a multistage, probability sampling design to develop a population sample that is representative of the 50 states of the U.S., including the District of Columbia on the basis of key demographic factors. The program is designed to examine adults' and children's health and nutritional status of a representative sample of the civilian, non-institutionalized U.S. population [22]. Beginning 1999, the survey became a continuous program that has a developing focus on a variety of health and nutrition measurements to accommodate emerging needs [22]. It is a national representative sample of the civilian, non-institutionalized U.S. population located in counties across the U.S. [22]. In other words, the survey does not include persons residing in nursing homes, institutionalized persons, or U.S. citizens living abroad. The surveys include demographic, socioeconomic status, dietary, and health-related questions. The NHANES program also includes physical examination component performed at the mobile examination center (MEC) and a series of laboratory tests. Details on the NHANES Laboratory/Medical Technologists Procedures and Anthropometry Procedures are described elsewhere [23]. The survey protocol is approved annually by the NCHS Research Ethics Review Board, and all participants provided written informed consent [24]. Details information about the dietary interview portion has been published previously [25].
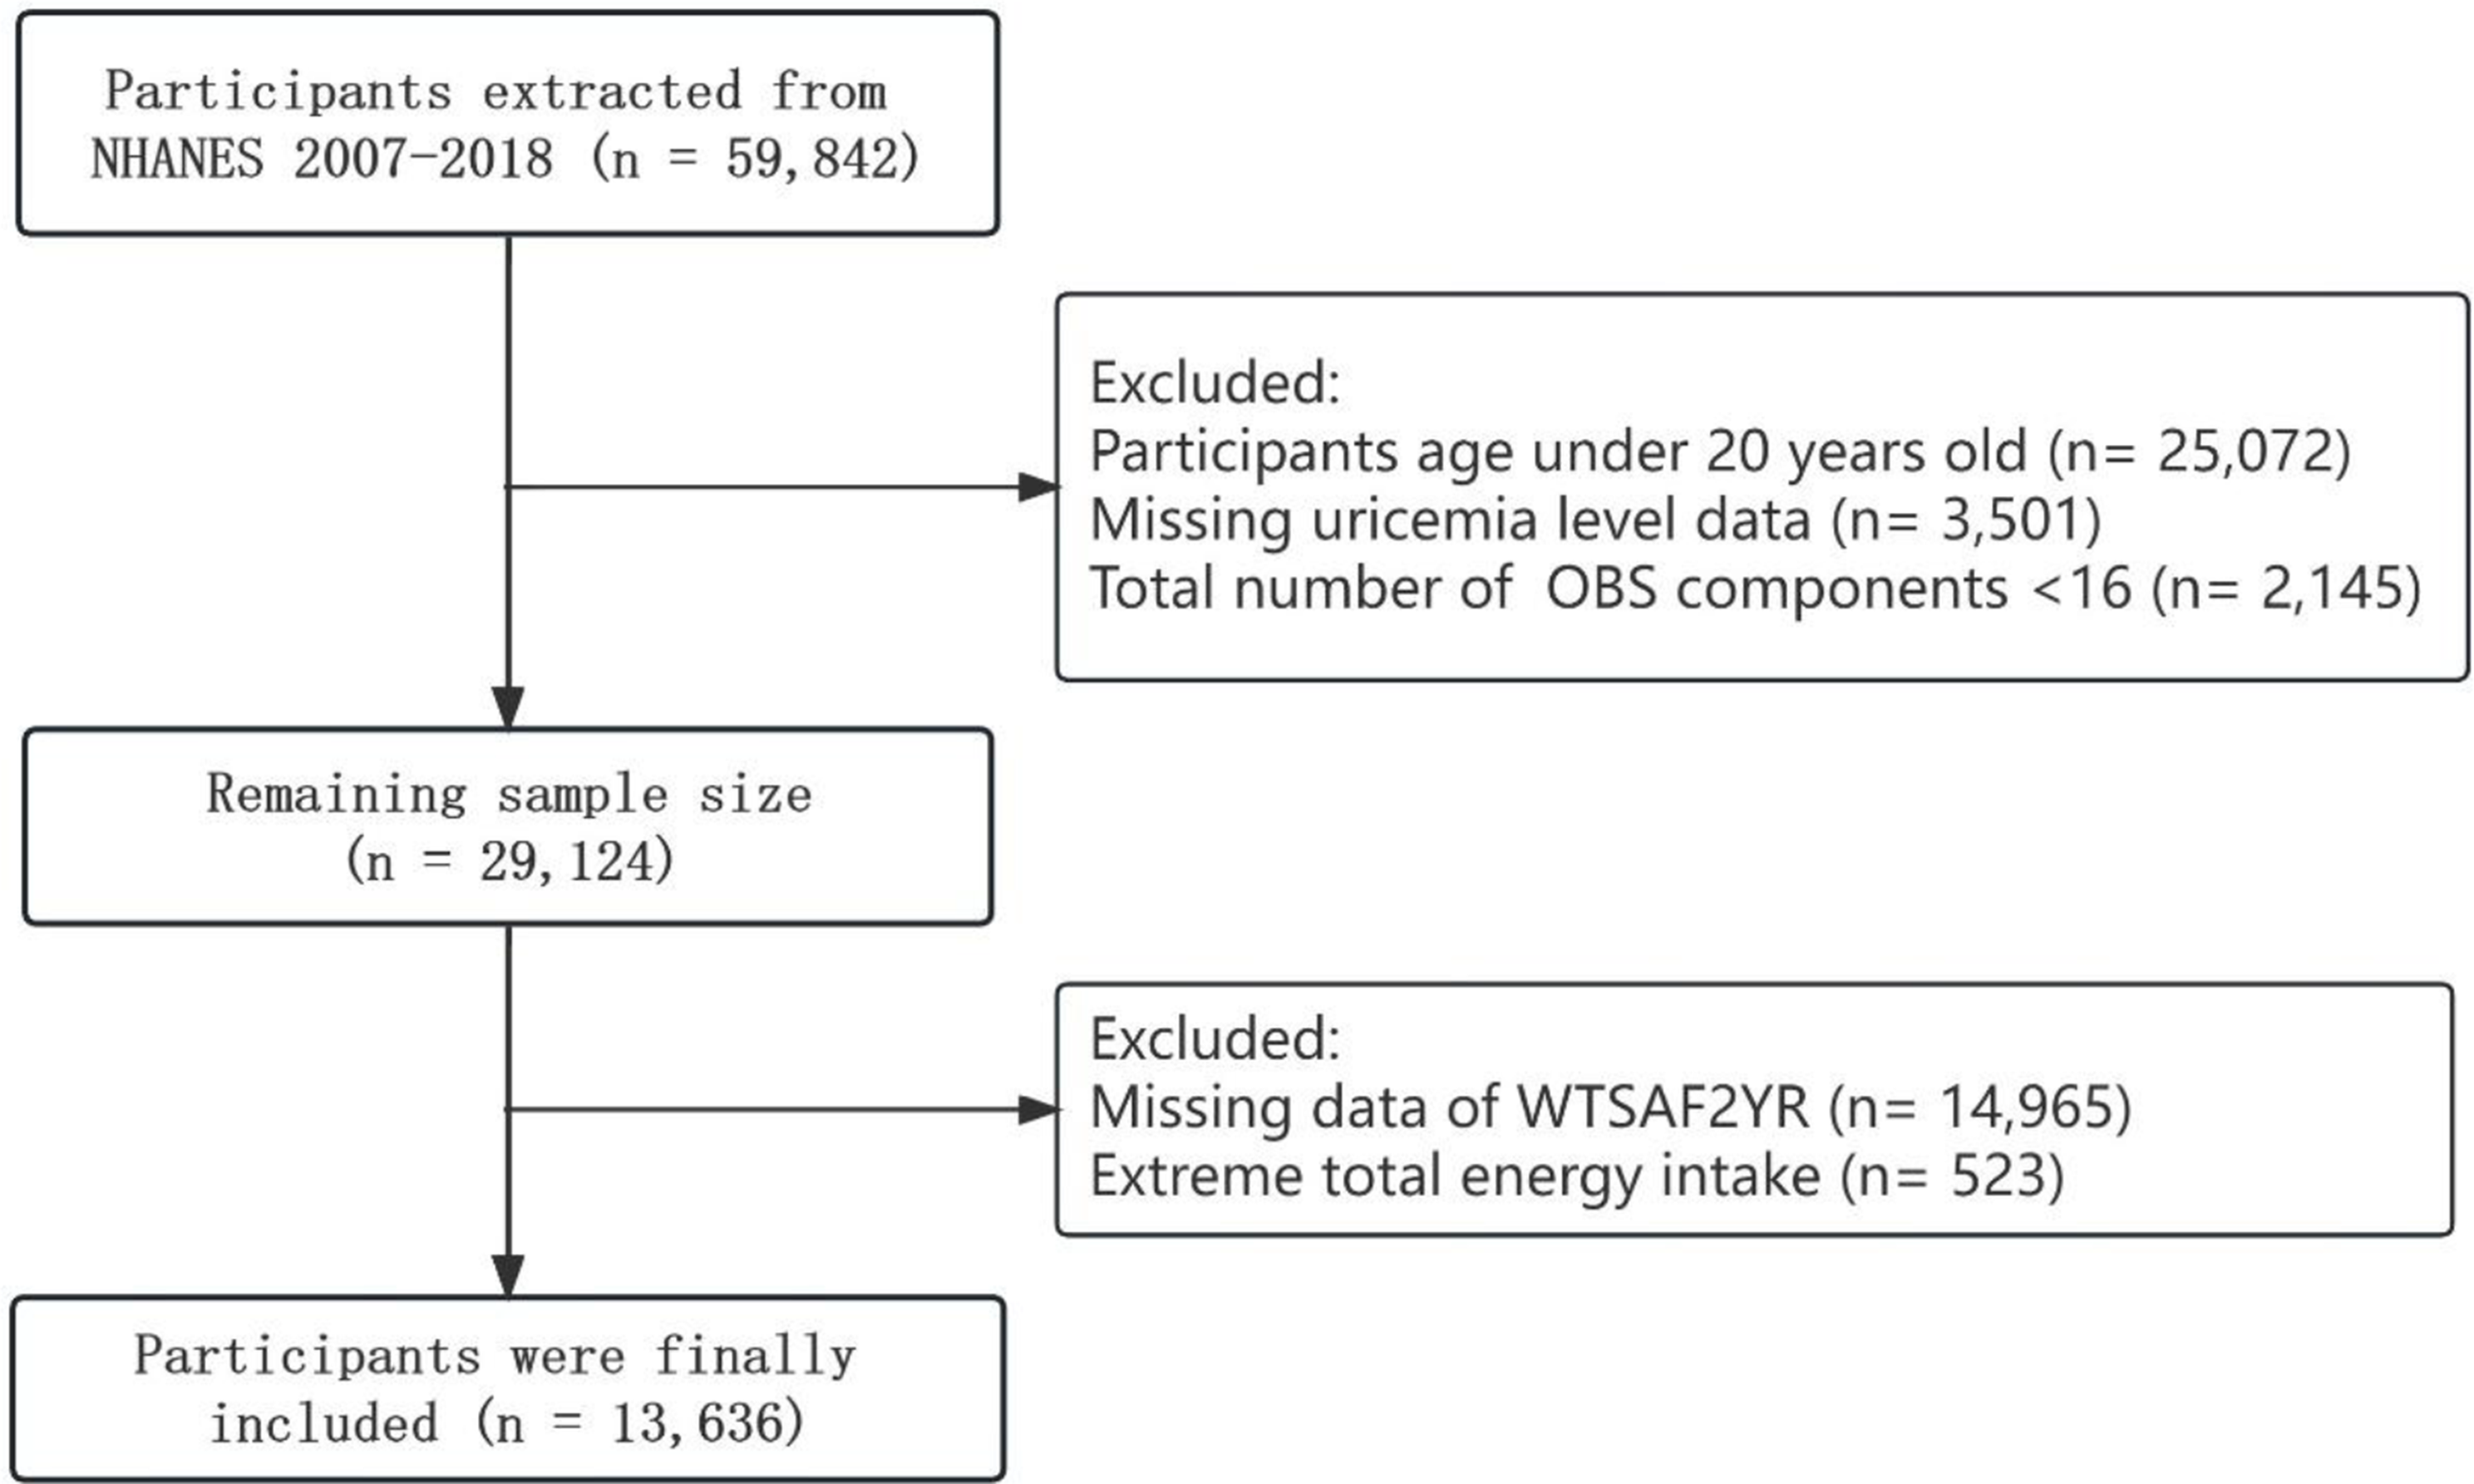
Since NHANES data are de-identified and publicly available, thus, the Institutional Review Board at the researchers’ institution does not consider this to be human subject research. Therefore, human subjects’ approval was not necessary. Of 23,226 participants of NHANES aged ≥ 40 from 2007–2018, 609 participants with implausible daily energy intake (< 800 kcal or > 4,200 kcal for men and < 500 kcal or > 3,500 kcal for women), 2,257 participants with missing uric acid levels, 1,624 with incomplete dietary data, 1,258 with history of gout or missing, 8,091 with history of heart disease, stroke, drugs for gout, antihypertensive, anti-diabetic, 210 with impaired kidney function (estimated glomerular filtration rate, eGFR, < 60 mL/min/1.73m2), and 3,399 with missing covariates of interest were excluded. Thus, 5,778 American individuals (2,934 men and 2,844 women) were analyzed in this study.
The NILS-LSA is a Japanese population-based prospective cohort study designed to investigate the processes of normal aging and the development of age-related diseases. The study recruited participants using age- and sex-stratified random sampling from Obu and Higashiura Town in Aichi Prefecture, Japan. The first-wave examination of the NILS-LSA was conducted from November 1997 to April 2000, enrolling 2,267 individuals, all aged between 40 and 79 years. Subsequent to this initial assessment, participants underwent biennial follow-up evaluations, and participants (aged 40–79 years) who were unable to continue their participation were replaced by new, randomly recruited, age- and sex-matched individuals. Notably, individuals aged 40 years were annually recruited. Details of the NILS-LSA have been reported previously [26]. This research involving human participants strictly adhered to the principles outlined in the Declaration of Helsinki. The Committee on the Ethics of Human Research of the National Center for Geriatrics and Gerontology approved the study protocol (No. 1665–2), and written informed consent was obtained from all participants. All participants provided written informed consent for data collection and analysis before participating in the study.
The participants in this study were selected from the first to the seventh waves of the NILS-LSA, spanning from November 1997 to July 2012. In this study, the initial participation of each participant was used as the baseline, and the follow-up began from the date of their baseline participation. Among the initial 3,983 participants, 3,849 individuals with complete dietary survey data were included, while 1,363 participants who took part in less than two follow-up surveys were excluded. Additionally, 508 individuals with a history of kidney disease, gout, hyperuricemia, or impaired kidney function (eGFR, < 60 mL/min/1.73m2) at baseline, and 180 individuals with unavailable self-reported history of stroke, heart disease, and cancer data at baseline, or a history of any of these diseases, were also excluded. Furthermore, 19 participants had incomplete baseline covariate data, and 41 were taking medications (such as thiazide antihypertensive diuretics, loop diuretics, bronchodilators, drugs for gout and hyperuricemia, antimetabolites, and anti-tumor drugs) that could potentially impact serum UA concentration levels were excluded. Consequently, the analysis included a total of 1,738 Japanese individuals (799 men and 939 women) aged between 40 and 79 years.
Assessment of mushroom consumption
In NHANES, dietary data were collected using up to two 24-h dietary recall interviews in which respondents reported all foods and beverages consumed during the preceding 24-h. Day 1 dietary recall data were collected in-person at the MEC by trained interviewers. Day 2 interviews were administered by telephone 3 to 10 days after MEC interviews. The 24-h dietary recalls were collected using the computerized method of the U.S. Department of Agriculture (USDA) Automated Multiple-Pass Method to account for day-to-day variation [22].
The U.S. Department of Agriculture Food and Nutrient Databases for Dietary Studies was used to determine the nutrient content of foods. Mushroom consumption was identified using USDA food codes that were mostly mushrooms or mushrooms alone, for example, egg omelet or scramble egg, with sausage and mushrooms, steak with mushrooms served on the side or dish that was mainly mushrooms, such as stuffed mushrooms sautéed mushrooms, creamed mushrooms. Since mushrooms are also incorporated into mixed dishes, the present analysis separated out mushrooms in mixed dishes using the U.S. Environmental Protection Agency-USDA Food Commodity Intake Database commodity codes [27]. Detailed information regarding the Food Commodity Intake Database and the process is described elsewhere [28,29,30,31].
In NILS-LSA, dietary assessments were conducted using 3-day dietary records (3DRs). These records required participants to document their dietary intake over a period of three consecutive days, encompassing two weekdays and one weekend day. The majority of participants completed these records at home and returned them within 1 month. During the assessment, food items were individually weighed using a 1-kg kitchen scales (Sekisui Jushi, Tokyo, Japan) before being cooked or portion sizes estimated. Additionally, participants used a disposable camera (27 shots; Fuji Film, Tokyo, Japan) to capture images of their meals before and after eating. Dietitians used these photos to complete missing data, and when necessary, they telephoned participants to clarify discrepancies or obtain further information, and calculated the average daily consumption of each food for each participant. Averages for 3-day nutrient and energy intakes were calculated according to the Standard Tables of Foods Composition 2010 in Japan and other sources [32].
Ascertainment of hyperuricemia
In the continuous NHANES 2007–2018, serum UA was measured on a Beckman Synchron LX20 using an automated colorimetric method, which had been validated against a uricase assay [33]. Based on a previous study, hyperuricemia was defined in this study as serum UA levels > 420 μmol/L in men and > 350 μmol/L in women [21].
In NILS-LSA, venous blood was sampled using tubes containing ethylenediaminetetraacetic acid (disodium salt, 50 mM) in the morning immediately after fasting for ≥ 12 h. Serum UA (mg/dL) were measured by enzymatic method (Uricase-Peroxidase reaction) using the automatic analysis device (JCA-BM8000 Series; JEOL, Ltd.) [34]. The lower detection limit for UA was 0.2 mg/dL. Based on the Japanese guideline for the management of hyperuricemia and gout: second edition [35] and previous studies [36,37,38], hyperuricemia was defined as a serum UA level of > 7.0 mg/dL in men and ≥ 6.0 mg/dL in women. In order to facilitate comparison with NHANES, serum UA values were multiplied by 59.48 [39] to convert the units from mg/dL to μmol/L. That is, hyperuricemia was defined as > 416.4 μmol/L for men and ≥ 356.9 μmol/L for women.
Assessment of covariates
Based on the previous literature, the following covariates were included in our analysis of NHANES: age (years), sex (men/women), ethnicity-race (Mexican American, other Hispanic, Non-Hispanic White as the referent group, other race-multi-racial), total physical activity (assessed according to metabolic equivalent of task (MET) scores (METs-h/day)), body mass index (BMI; kg/m2), education (less than high school, high school, above high school), family poverty income ratio (PIR; ≤ 1.30, > 1.30), smoking status (never, current smoker), alcohol intake (g/day), total energy intake (kcal/day), history of hypertension history of diabetes (yes or no for each), and consumption of fish and shellfish (oz/day), meat (oz/day), vegetables (svg/day), and fruit (svg/day). The family PIR is the ratio of family income to the poverty threshold. It is calculated by dividing the family income by poverty guidelines set forth by the U.S. Department of Health and Human Services, specific to family size, year, and state. BMI calculated as weight in kilograms divided by height in meters squared. Total physical activity was self-reported [40] and was measured using the Global Physical Activity Questionnaire [41]. The eGFR (mL/min/1.73m2) was calculated based on sex-age-specified serum creatinine (scr; mg/dL) (for men, if scr ≤ 0.9, eGFR = 142 × (scr/0.9)-0.302 × 0.9938age, and if scr > 0.9, eGFR = 142 × (scr/0.9)-1.200 × 0.9938age; for women, if scr ≤ 0.7, eGFR = 142 × (scr/0.7)-0.241 × 0.9938age × 1.012, and if scr > 0.7, eGFR = 142 × (scr/0.7)-1.200 × 0.9938age × 1.012.) [42]. Hemoglobin A1c (HbA1c) levels in NHANES were measured during the MEC by boronate affinity high-performance liquid chromatography (HPLC), which could differentiate between glycated and non-glycated forms of A1c as described in the NHANES Laboratory Procedure Manual, Glycohemoglobin [43]. Systolic and diastolic blood pressure was measured by trained certified blood pressure examiners using Mercury Sphygmomanometer with the participant in a seated position following 5 min of quiet rest. The average of 2nd and 3rd blood pressure was used for the present study [44, 45].
In the NILS-LSA, in each wave, data on age, disease history (kidney disease, gout, stroke, hypertension, heart disease, dyslipidemia, diabetes, cancer; yes or no for each), smoking status (never, former, current), and education level (years; grouped into three categories: less than high school (≤ 9 years), high school (10–12 years), and above high school (≥ 13 years)) were collected using self-reported questionnaires. Height (meters) and weight (kilograms) were measured using digital scales, and BMI (kg/m2) was calculated as weight divided by height squared. The 24-h total physical activity (METs-h/day) was METs-h/dayobtained from participant interviews conducted by trained interviewers using a semiquantitative assessment tool [46]. Food consumption (g/day) and alcohol intake (g/day) was measured by 3DRs, and medication data were recorded according to the participant's prescription drug pick-up booklet. Serum concentration of creatinine was tested and eGFR (mL/min/1.73m2) was calculated using same equations with NHANES. HbA1c levels were measured using a latex aggregation immunoassay (SRL, Tokyo, Japan) with venous blood samples collected in the early morning following a minimum 12-h fast. The HbA1c values were calculated as National Glycohemoglobin Standardization Program equivalent values using the following formula: HbA1c (%) = 1.02 × HbA1c (Japan Diabetes Society) (%) + 0.25% [47]. Systolic and diastolic blood pressure was measured with an automatic blood pressure manometer (BP-204RV, Colin, Inc.) while subjects were in a seated position, following at least 5 min of rest.
Statistical analysis
In the NHANES, mushroom consumption (g/day) were divided into three groups: the non-consumer group (0 g/day, n = 5,516), the middle group (median intake = 4.4 g/day, n = 133), and the highest group (median intake = 19.6 g/day, n = 129). The non-consumer group was considered the referent group.
Consistent with the NCHS guidelines for analyzing the NHANES data, all analyses were conducted using appropriate sampling weights, clustering, and stratification to account for the complex sampling design [22]. Univariable analyses were performed to assess the statistical differences in weighted percentages for categorical variables using the Rao-Scott χ2 test and weighted means for continuous variables using analysis of variance to describe the characteristics of the study participants. We performed multivariable logistic regression models stratified by gender using the SAS surveylogistic procedure to examine the association of mushroom consumption with hyperuricemia. Model 1 was adjusted for baseline information on age (years; continuous), ethnicity-race (Mexican American, other Hispanic, Non-Hispanic White, Non-Hispanic Black, other race), education (less than high school, high school, above high school), family PIR (≤ 1.30, > 1.30), BMI (kg/m2; < 24.9, 25.0–29.9, ≥ 30.0), disease history (hypertension, diabetes; yes or no for each), eGFR (mL/min/1.73m2; continuous). Model 2 was adjusted for the covariates specified in Model 1 as well as baseline information on smoking status (never, former, current, alcohol drinking (g/day, and total physical activity (METs-h/day; continuous). Parsimonious Model 3 was adjusted for Model 2 plus baseline information on consumption (g/day; continuous) of fish and shellfish, meat, vegetables, and fruit, and energy intake (kcal/d; continuous). The multivariable logistic regression results were presented as adjusted proportional odds ratio (pOR) and the 95% confidence intervals (95% CIs).
In the NILS-LSA, mushroom consumption (g/day) were divided into three groups: the non-consumer group (0 g/day; n = 327), the middle group (< sex-specific median value (13.3 g/day for both gender); median intake = 6.7 g/day, n = 699), and the highest group (≥ sex-specific median value; median intake = 22.9 g/day, n = 718). The non-consumer group was considered the referent group.
To investigate associations between mushroom consumption and hyperuricemia, multivariable-adjusted generalized estimation equation were used to calculate OR and 95% CI by gender. Model 1 was adjusted for baseline information on age (years; continuous), BMI (kg/m2; < 18.5, 18.5– < 25, ≥ 25), disease history (hypertension, dyslipidemia, diabetes; yes or no for each), eGFR (mL/min/1.73m2; continuous), serum UA concentration level (μmol/L), education (less than high school, high school, above high school), and follow-up time (days; continuous). Model 2 was adjusted for the covariates specified in Model 1 as well as baseline information on smoking status (current smoker, others), alcohol drinking (current drinker, others), and total physical activity (METs-h/day; continuous). Model 3 was adjusted for Model 2 plus baseline information on consumption (g/day; continuous) of fish and shellfish, meat, vegetables, and fruit, and energy intake (kcal/d; continuous).
In the above analysis, we observed a potential preventive effect of mushroom consumption on hyperuricemia among men in NILS-LSA. Considering previous evidence indicating a higher risk of hyperuricemia in middle-aged population [48], we performed age-stratified analyses (for the middle-aged subgroup < 65 years and the older subgroup ≥ 65 years) among men in NILS-LSA.
Statistical analysis was performed using SAS software (version 9.4-SAS institute) and R Statistical Software (version 4.3.0; R Foundation for Statistical Computing, Vienna, Austria). Two-sided exact P-values of < 0.05 were considered the threshold for statistical significance.


留言 (0)