
記住我

Eighty-five healthy volunteers, with no referred symptoms of lumbar pain, were prospectively recruited from September 2021 to May 2023 and underwent MRI lumbar spine on a 1.5T MR scanner at the Sant'Andrea University Hospital, Rome, Italy. Individuals with incompatible MRI devices, claustrophobic and MRI acquisition with severe motion artifacts were excluded.
This study was IRB-approved and informed consent was obtained by all participants.
MRI protocol and deep learning image reconstruction (DLR)All the examinations were performed with a 1.5T MR scanner (Signa Voyager - GE Healthcare, Waukesha, WI) with a dedicated array with 32 coil elements integrated into the patient table (https://integritymed.com/product/ge-signa-voyager-xt-15). Conventional sagittal T1-weighted (T1W) fast spin echo (FSE), T2W FSE, short-tau inversion recovery (STIR) images, and axial multislices T2W FSE images were acquired to compare standard and DLR protocols (Fig. 1). No contrast medium was injected. Acquisition time of each protocol and sequence was collected. Table 1 shows acquisition parameters of both DLR algorithm and standard sequences.
Fig. 1
Sequences acquired. On top (A–E) DLR algorithm. A, D and E T2W FSE; B T1W FSE; C STIR. Below (F–J) conventional protocol. F, I and J T2W FSE; G T1W FSE; H STIR. DLR improves signal-to-noise ratio (SNR), contrast-to-noise ratio (CNR) and image sharpness and reduces artefacts. DLR images appear smoother than standard
Table 1 Acquisition parameters of both DLR algorithm and standard sequencesAIR Recon DL™ was the algorithm installed on the scanner used to reconstruct images. Its pipeline includes a deep convolutional neural network that reconstructs images with higher SNR, reduced truncation artefacts, and higher spatial resolution. It was trained with a supervised learning approach, using sets of images representing near-perfect and conventional MRI images to generate the high-quality images from low-quality dataset. The software incorporates an adjustable noise reduction factor, ranging between 0 and 1, which represents the fraction of the noise variance to be removed (100% corresponds to removing of all the predicted noise from the image). This pipeline can be applied to 2D sequences in multiple anatomic regions and for various sequences, contrast weightings, field strengths, and coil configurations [6].
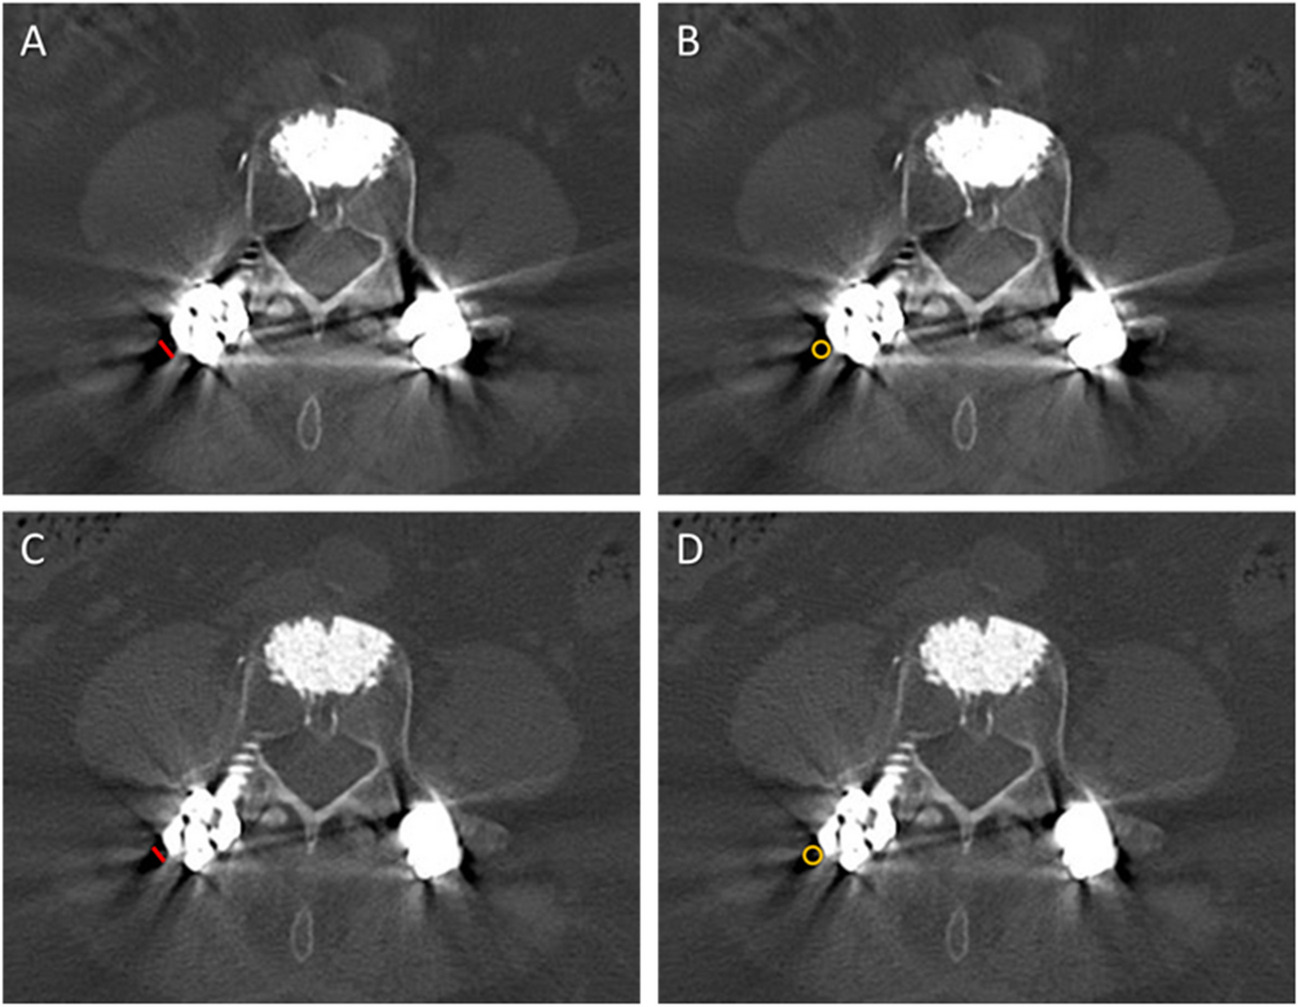
Image analysisQuantitative image analysisTwo radiologists in consensus (MZ and DDS, with 5 and 7 years of experience in MRI imaging, respectively), blinded to patient details and reconstruction technique, performed quantitative image analysis on a commercially available advanced workstation (AW Server 3.2 Ext. 3.4 - GE Healthcare) by drawing and cloning for each patient/set of images a 10mm2 region of interest (ROI) on the fourth lumbar vertebral body (L4) and on the intervertebral disc (L4/L5) in both DLR and standard protocol images (Fig. 2).
Fig. 2
Image analysis process on vertebra and disc of T2W FSE DLR images. A Sagittal; B and C axial images. ROIs are in red. The same analysis was performed on standard protocol images
Signal intensity, SNR, and CNR were collected. In particular, the average signal intensity of the ROIs was used as the signal intensity, while the standard deviation (SD) was used as the noise. The SNR was calculated for both vertebrae and disc as the signal intensity of tissue divided by the SD of tissue:
The CNR was calculated as the SNR difference between tissues [15]:
$$\mathrm=\left|}_}-}_}\right|.$$
Qualitative image analysisOther two radiologists (FP and DC, with 3 and 10 years of experience in MRI imaging, respectively), blinded to reconstruction technique, independently analysed on a picture archiving and communication system (PACS) all the sequences of both DLR and standard protocol. A five-point Likert scale (5 = excellent; 4 = good; 3 = acceptable; 2 = poor; 1 = non-diagnostic) was used to evaluate the overall image quality.
Pathologic findings and diagnostic confidenceTo avoid recall bias, the two radiologists that performed qualitative analysis, in consensus and still blinded to the reconstruction technique, reanalysed the images after 2 weeks, assessing the presence of pathologic entities including vertebral haemangiomas, Schmorl’s nodes, protrusions, and Modic changes. The analysis included per-patient frequency of pathologic findings and the assessment of diagnostic confidence, using a 5-point scale (1 =non-diagnostic; 2 =poor; 3 =moderate; 4 =good; and 5 =excellent) [16].
Statistical analysisCategorical variables are given as median and interquartile range (IQR), continuous variables as mean and standard deviation. Kolmogorov-Smirnov test was performed to establish normality.
Paired t-test and Wilcoxon matched paired test were performed to compare data between conventional and DLR images, as appropriate.
Interobserver variability was calculated with the kappa test for the scoring of overall image quality, and it was considered as slight <0.20, fair 0.21–0.40, moderate 0.41–0.60, substantial 0.61–0.80, and almost perfect 0.81–1.00 [17].
Statistical analysis was carried out using MedCalc (MedCalc Software, version15, Ostend, Belgium) with a p value < 0.05 that was considered significant.
留言 (0)