
記住我
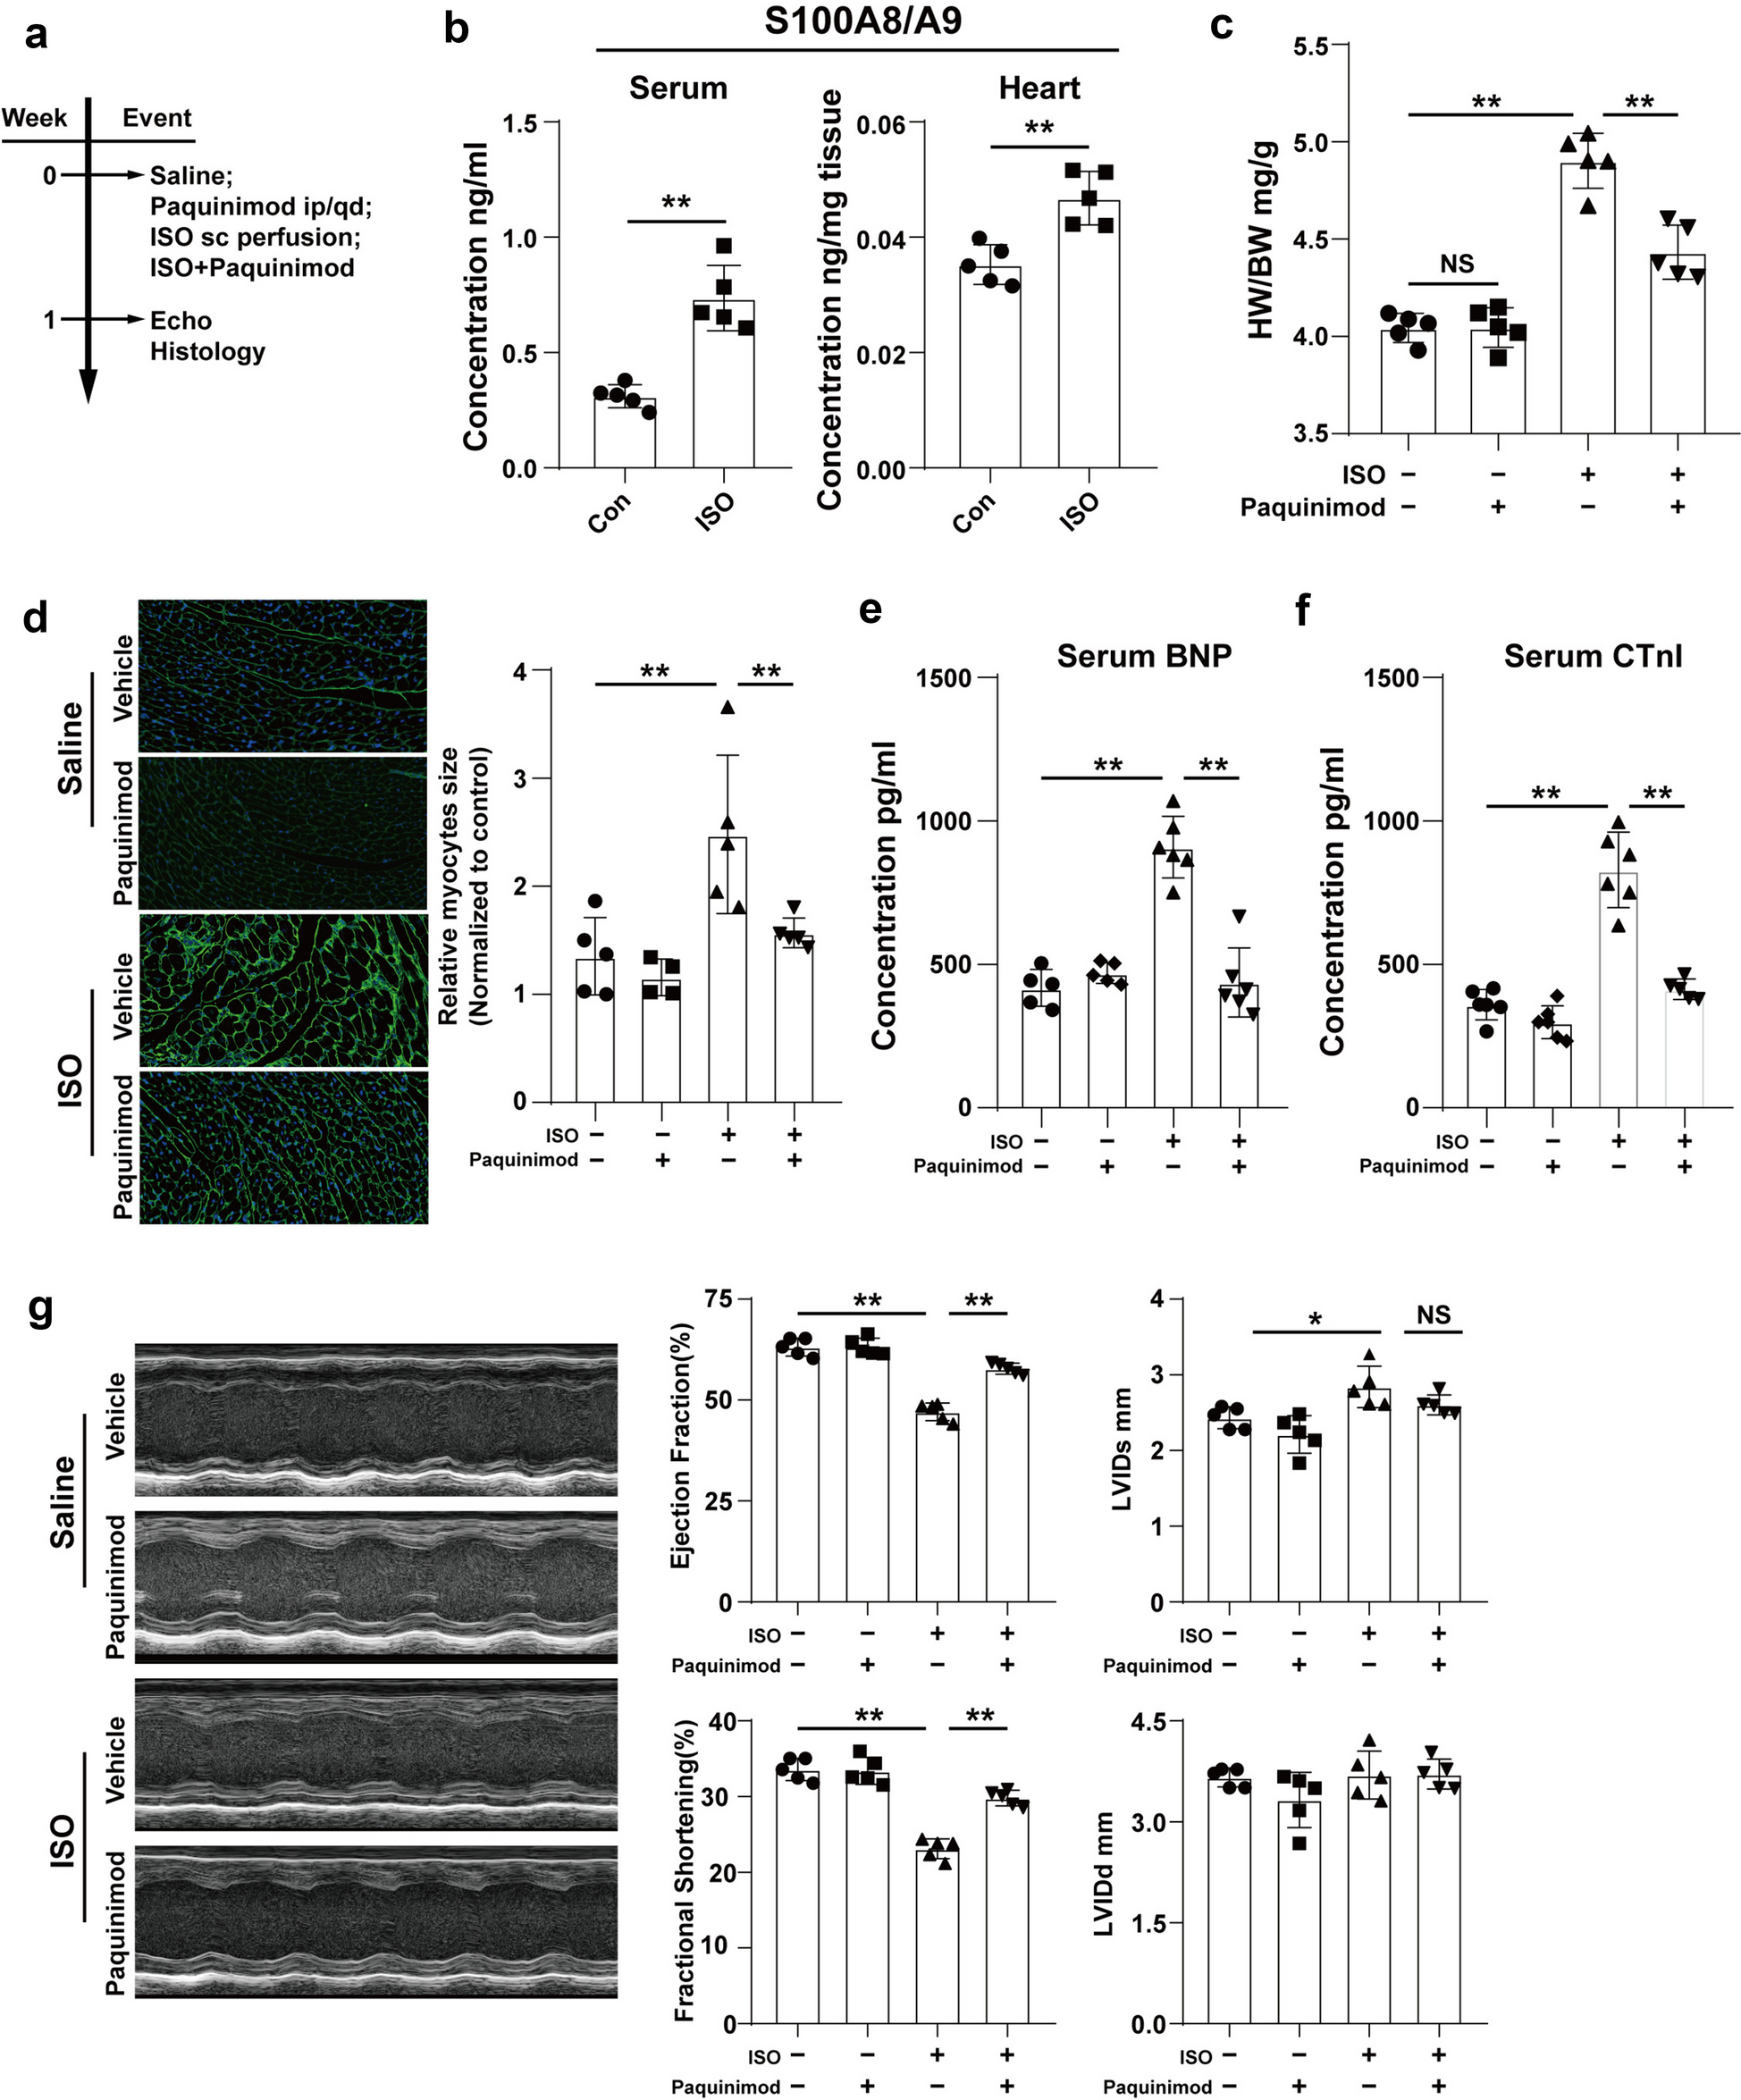
In this study, a total of 50 female Sprague–Dawley (SD) rats (female rats were selected as their urethra is short and wide, which facilitates their care after SCI), 10 weeks old, weighing 220 ± 20 g, were purchased from Specific Biotechnology Co., Ltd (Beijing, China; License No.: SCXK[Beijing]2019-0010). The animals were randomly divided into 3 groups—a control group (no treatment, n = 10), a SCI group (modeling of severe SCI at the T10 level, n = 20), and a GlyNAC+SCI group (modeling of severe SCI at the T10 level plus GlyNAC intervention by gavage, n = 20) (Fig. 1).
Fig. 1
Experimental procedure and time points. The rats were randomly divided into three groups, in which the SCI group and the GlyNAC+SCI group underwent modeling surgery for spinal cord injury at the level of T10. GlyNAC was administered by gavage 1 day after modeling and BBB scores were assessed on days 1 and 3 after modeling to determine if modeling was successful. The body weight of the rats was measured once before modeling and then once a week for 8 consecutive weeks after modeling. Biochemical tests, behavioral assessments, and western blotting assays were performed at 4 and 8 weeks after injury while immunofluorescence staining assays were performed at 8 weeks. BBB, Basso–Beattie–Bresnahan; GlyNAC, glycine and N-acetylcysteine; SCI, spinal cord injury.
GlyNAC PreparationGlycine (Catalog No. 410225) and N-acetylcysteine (Catalog No. A7250) were purchased from Sigma-Aldrich Trading Co., Ltd. (Shanghai, China). Glycine and N-acetylcysteine were dissolved in the daily drinking water of the rats. The glycine stock solution was stored at room temperature and the N-acetylcysteine stock solution was stored at 4 °C. The two solutions were mixed in a 1:1 ratio 10 min before use.
SCI Modeling Preparation and Gavage InterventionThe rats were anesthetized with isoflurane and were placed flat in a prone position on an insulating mat. After shaving and sterilizing, the skin and muscles in the back of the animal at the level of T10 were cut longitudinally to fully expose the vertebral plates and pedicles of T9–T11. The T10 vertebral plate was excised to expose the spinal cord of the T10 segment, which was then rinsed and moistened with saline. The T9 and T11 vertebral plates of the rats were subsequently clamped, and the rats were placed on a spinal cord percussion device (Precision Systems and Instrumentation IH Spinal Cord Percussion Device, USA) with the percussion force set to 250 kdynes, resulting in a moderate SCI model. Spasticity in the tail swing of the rats could be observed after the blow, following which the surgical incision was sutured, and 1.5 mL of saline, as well as 1 mL of penicillin solution, was injected subcutaneously for rehydration and antimicrobial treatment. After surgery, the rats were placed in an incubator and were returned to the rearing cage box when they woke up.
GlyNAC intervention (200 mg/kg, pre-experimentally determined) started at 10:00 h on postoperative day 1. After mixing, the GlyNAC solution was administered via a gavage needle (Zhongke Hengtian, Beijing China). Body weight was assessed once a week and the dosage was adjusted according to the change in body weight. Gavage was performed for 4 weeks in total. Bladder care was carried out once every 12 h and the rats were helped with urination for approximately 1–2 weeks. If the rats had hematuria, penicillin injection was continued and the animals were closely monitored (Fig. 1).
Basso–Beattie–Bresnahan (BBB) Locomotor RatingThe BBB score ranged from 0 to 21. Locomotor function in the model rats was assessed using BBB scores on days 1 and 3 after modeling. If the rats showed any movement of the lower limbs (score > 0), they were excluded from the experiment. Two observers blinded to the experimental grouping were selected to evaluate the BBB scores and complete the recordings after modeling. The rats were allowed to move freely in an open field for 15 min and the two observers scored and recorded the scores once a week for 8 consecutive weeks (Fig. 1).
Body Weight DeterminationThe body weights of the rats were assessed before modeling (day 0) and for 8 consecutive weeks after modeling. Changes in body weight were calculated by subtracting the preoperative body weight from the body weight assessed in each postoperative week. During the first 4 weeks, the dosage of the intervention was adjusted for each rat according to the change in body weight of each of the postoperative rats.
Assessment of Mechanical and Thermal PainMechanical pain in rats was assessed using the Von Frey method. The rats were individually placed in a plastic cage with a metal mesh floor and the tests were performed after 15 min of acclimatization. The bottom of the rat’s hind paw was stimulated with Von Frey hairs of different thicknesses and the pain response was scored on the Von Frey Mechanical Pain Scale. If the rats had a violent reaction, such as foot shrinkage, foot lifting, and foot licking, then the rats were considered to have developed pain, which was labeled as “O”; otherwise, the rats were considered to have not developed a pain reaction, which was labeled as “X.” The interval between each stimulus was 5–10 min. For thermal pain, the hot plate method was used (Bioseb, Pinellas Park, FL, USA), in which the rats were placed on a plate heated to 50 °C and the time it took for the rats to lift or lick their feet was recorded. The thermal pain test was stopped if the time exceeded 30 s to prevent the paw from being burned. The average of three recordings was obtained for each (left and right) hind paw, with an interval of 10 min between each recording.
Determination of Superoxide Dismutase (SOD) ActivityWe applied the hydroxylamine method to measure SOD activity. SOD activity was measured in T10 spinal cord samples on days 28 and 56 after injury using a SOD kit (A001-1, Nanjing Jianjian Bioengineering Institute, Nanjing, China) according to the manufacturer’s instructions. Once homogenized samples had been thoroughly mixed with the reagents, the samples were incubated in a water bath at a constant temperature of 37 °C for 40 min. The color developer was then added and the OD value of the supernatant was measured at 550 nm using a microplate reader (Epoch, BioTeK). The protein concentrations of the spinal cord samples were also determined and a standard curve was plotted to calculate relative SOD activity.
Determination of Malondialdehyde (MDA) ConcentrationsWe used the TBA method to determine the concentration of MDA. MDA concentrations in T10 spinal cord samples were determined on days 28 and 56 post-injury using an MDA kit (G4300, Servicebio). The tissues were first homogenized and lysed, and, after standing, the supernatant was mixed with the assay solution and incubated at 95 °C for 40 min, transferred to an ice bath for 5 min, and then centrifuged at 10,000 × g for 10 min. Finally, the OD of the supernatant at 532 nm was detected using a microplate reader.
Determination of the Total Antioxidant Capacity (T-AOC)T-AOC was measured in gastrocnemius muscle samples on days 28 and 56 after injury using a T-AOC kit (A015-2, Nanjing Jianjian Bioengineering Institute) and the ABTS method. The tissue was first homogenized and lysed, and, after standing, the supernatant was added to the reagent and left to stand at room temperature for 6 min. Subsequently, the OD of the supernatant at 405 nm was detected in a spectrophotometer. Simultaneously, the protein concentrations of the gastrocnemius muscle samples were measured to calculate the T-AOC.
Measurement of the GSH ConcentrationFor the determination of GSH concentration, we used the microplate test method. GSH concentrations were measured in gastrocnemius muscle and T10 spinal cord samples on days 28 and 56 after injury using a GSH kit (A015-2, Nanjing Jianjian Bioengineering Institute) and the ABTS method. Once the tissues had been homogenized and lysed, the reagents were mixed and centrifuged at 3500 rpm for 10 min. The supernatant and the other reagents were then mixed and left to stand for 5 min. The OD of the supernatant at 405 nm was detected using a microplate reader, and the protein concentrations of the spinal cord and gastrocnemius muscle samples were determined to calculate the GSH concentration using the following formula: \(GSH\ concentration=\left(assay\ OD\ value-blank\ OD\ value\right)\)\(/\left(standard\ OD\ value-blank\ OD\ value\right)\)\(*standard\ tube\ concentration \left(20\ \upmu \mathrm/\mathrm\right)\)\(*sample\ pretreatment\ dilution \left(2\times \right)\)\(\div\ protein\ concentration\ of\ the\ homogenate\ to\ be\ measured\ (\mathrm/\mathrm)\).
The Gastrocnemius Wet Weight RatioBilateral gastrocnemius muscles (n = 4) were stripped under anesthesia from rats in the SCI and GlyNAC+SCI groups 4 and 8 weeks post-injury. The weights of the freshly harvested gastrocnemius muscles were measured on electronic scales and the values were divided by the pre-harvest body weights of rats to obtain the gastrocnemius muscle wet weight ratio. The specific calculation method was gastrocnemius wet weight ratio = (left gastrocnemius weight + right gastrocnemius weight)/2/body weight of rats before sampling. The wet weight ratio of the gastrocnemius muscle was also calculated for the control group and the final values of the three groups were compared.
Western Blot AnalysisGastrocnemius muscle samples were homogenized in RIPA lysis buffer (ServiceBio, Wuhan, China) containing a 50× protease inhibitor cocktail (ServiceBio, Wuhan, China). The protein concentrations of the tissue samples were determined using a BCA protein quantification kit. After denaturing in a boiling water bath, the proteins were separated by SDS–polyacrylamide gel electrophoresis (SDS–PAGE), transferred to a PVDF membrane, blocked with 5% milk in TBST for 30 min at room temperature, and then incubated with primary antibody at 4 °C overnight with shaking. After primary antibody recovery and three washes with TBST, the membranes were incubated with secondary antibody (GB23303, HRP-conjugated goat anti-rabbit IgG, 1:5000; Servicebio) at room temperature for 30 min. The protein bands were revealed with a chemiluminescence reagent. The absolute OD and the relative OD were determined using AIWBwell analysis software.
ImmunofluorescenceFresh rat gastrocnemius muscle tissues were cryopreserved at −80 °C and OCT-embedded 8 weeks after injury for sampling and sectioning. Frozen sections were rewarmed at room temperature; the tissue was circled with a histochemical pen, incubated with autofluorescence quenching agent (G1221, ServiceBio, Wuhan, China) for 5 min, and then rinsed. ROS stain (D7008, Sigma-Aldrich) was added dropwise within the circled area of the tissues, and the sections were incubated under light for 30 min (pH 7.4) three times, 5 min each. Then, the samples were counterstained with DAPI staining solution for 10 min at room temperature shielded from light, washed three times with PBS (pH 7.4), and sealed with an anti-fluorescence quenching agent. Finally, the ROS-positive cell rate, the area proportion, and the fluorescence intensity of ROS-positive cells were observed and analyzed with a fluorescence microscope (Eclipse C1, Nikon, Tokyo, Japan).
Statistical AnalysisStatistical analysis was performed using SPSS version 19.0 (IBM, Armonk, NY, USA). Independent samples t-tests were used for comparisons between two groups and one-way ANOVA followed by Bonferroni’s post hoc test was employed for comparisons among multiple groups. Data are shown as means ± standard deviation. P values < 0.05 were considered significant. GraphPad Prism version 9.3.0.463 (LLC, San Diego, CA, USA) was used for graphing.
留言 (0)