
Remember me


The Marseille database consists of 60 healthy volunteers, but MRI was unavailable in two. The remaining n = 58 volunteers with complete datasets (34 women) had an age of 50 ± 17 (range 21–78) years.
Participants had given written informed consent. Full inclusion and exclusion criteria can be found at https://clinicaltrials.gov/ct2/show/NCT00484523. A 15-min acquisition of PET data started 30 min after injection of 111 MBq of [18F]FDG. Participants were instructed to rest with their eyes closed during the uptake period. PET was obtained on a GE Discovery ST PET/CT (GE Healthcare, Waukesha, Wisconsin, USA), with a 6.2 mm axial resolution. Images were CT-corrected for attenuation and reconstructed into 47 contiguous 3.27 mm thick transverse sections using the ordered subsets expectation maximisation algorithm (OSEM), with 5 iterations and 32 subsets [24]. The final images had a voxel size of 1.17 mm isotropic in a matrix of 256 × 256 × 256 voxels.
Sagittal T1-weighted anatomical images were acquired on a Siemens SymphonyTim 1.5 T scanner (voxel size 1 mm isotropic, TR 1880 ms, TE 2.92 ms, inversion time 1100 ms, flip angle 15°).
iDB-MRXFDG databaseMRXFDG [1] is a database of anatomical MRI and PET [18F]FDG head images from 37 normal adult human subjects (age 38 ± 11.5 years, range 23–65). The PET data were acquired for 10 min on a Siemens Biograph mCT64 50 min after administration of a planned dose of 1.5 MBq/kg + 18.5 MBq of [18F]FDG (with an actual dose injected of 122.3 ± 21.3 MBq [1]). PET images were reconstructed with OP-OSEM 3D (12 iterations, 21 subsets), incorporating the system point spread function and time of flight in a matrix of 200 × 200x109 voxels with a voxel size of 2.04 × 2.04 × 2.03 mm3.
Sagittal T1-weighted MRI data were obtained on a Siemens Sonata 1.5 T scanner (voxel size 1.2 mm isotropic, TR 2400 ms, TE 3.55 ms, inversion time 1000 ms, flip angle 8°).
Patient group[18F]FDG PET data for 34 patients (17 men, 27 ± 11.9 years, range 13–48) were available from an ongoing service evaluation (King’s College Hospital, London, project reference 10/2021). All had histopathologically proven FCD type 2 [21,22,23]. [18F]FDG uptake is regularly decreased in FCD type 2 [17,18,19], and detection of decreased uptake was therefore used as an outcome parameter in this study. Patients were scanned 1994–2017 on three different imaging systems: a GE Discovery 710 with a full-width-at-half-maximum NEMA resolution of 5.3 mm (“VPFX”, a time-of-flight iterative OSEM, Ordered Subsets Expectation Maximisation reconstruction method), a GE Discovery ST with a resolution of 6.4 mm (Iterative Reconstruction (IR) or filtered back projection (FBP)) and a CTI ECAT 951/R with an estimated resolution on the image of ~ 8.9 mm [25] (FBP).
Image processingWe used SPM12 (https://www.fil.ion.ucl.ac.uk/spm/software/spm12/) and SPM8 (https://www.fil.ion.ucl.ac.uk/spm/software/spm8/), implemented in MATLAB.
Control data had been anonymised before transfer. The patient Digital Imaging and Communication in Medicine (DICOM) files were anonymised and converted with dcm2niix (MRIconGL software) to NIFTI format for SPM analysis.
Processing of the Marseille databaseVisual inspectionImages had already been reviewed by the creators of the database, EJ (Consultant Nuclear Medicine physician) and NG (Consultant Neuroradiologist). For the purposes of this analysis, images were additionally visually inspected by SOJ (Master student) and AH (Consultant Neurologist). Subject 1 was excluded from further analysis due to an incidental finding of a medial frontal arachnoid cyst which would have led to exclusion of this area in all subjects in SPM.
SPM analysis (Fig. 1)Fig. 1
Flowchart of SPM analyses comparing the MRXFDG and Marseille databases and comparing individual FCD patients against separate and combined databases. For details, see text
Reorientation and coregistrationThe origin of each PET and MRI image was manually set to centre of the images, and images were manually straightened using the pitch, yaw and roll reorient options in SPM. The origin was set approximately to the anterior commissure. All images were then coarsely aligned (but not resliced). Each T1-weighted MR image was finally coregistered (without re-slicing) to its corresponding PET image.
Spatial normalisationCoregistered T1 images were normalised to MNI space with the Segment function yielding a deformation field for each participant. PET images were normalised with the Normalise and Write function using those deformation fields and resampled at 1 × 1 × 1 mm voxel size using a 4th degree B-spline interpolation.
Intensity normalisationReconstructed PET images were normalised by (1) each subject’s weight and injected dose to obtain Standard Uptake Value (SUV) images (radioactivity concentration [kBq/cm3]/(decay-corrected dose [kBq]/weight [kg])) and (2) by each subject’s mean activity within the intracranial volume (ICV) mask provided by SPM12 to obtain Standard Uptake Value ratio (SUVr) images.
Leave-one-out SPM analysisEach of the participants was compared to the others via leave-one-out ANCOVA with images smoothed using an 8 × 8 × 8 mm full-width-at-half-maximum (FWHM) 3D Gaussian filter. Global values (calculated by SPM via its default method of taking the overall image matrix mean, taking 1/8th of it leading to a brain mask, and averaging within this mask) and age were used as linear covariates. Other settings were: grand mean scaling and ANCOVA; independent measurements; equal variance; overall mean for centring; relative threshold masking (0.8); implicit but no explicit masking; global calculation omitted. Global normalisation with overall grand mean scaling (to 100), ANCOVA. Hypometabolism (reduced uptake in the individual compared to the group) and hypermetabolism contrasts were investigated. Clusters were formed by voxels exceeding the threshold of p < 0.001 and were considered significant if their p value was < 0.05 at the cluster level (i.e., multiple comparison corrected via random field theory).
Regional analysisThe T1 MR images were anatomically segmented into 95 regions of interest (ROI) of the Hammers atlas database (http://brain-development.org/brain-atlases/adult-brain-atlases/individual-adult-brain-atlases-new/) [26,27,28,29] using the multi-atlas propagation with enhanced registration (MAPER) method [30]. Grey and white matter parts of mixed ROIs were separated using the approach described in Merida et al. [1]. Mean regional SUV and SUVr of the MR-coregistered PET were extracted in a selection of grey matter anatomical regions. We left out the white matter region corpus callosum and the ventricles, and combined all insular subregions into one label for comparison with Mérida et al. 2021. Right and left regions were combined.
The intra-regional coefficient of variation (COV) was calculated per participant and anatomical structure as the ratio between the SUV standard deviation and the mean SUV to represent regional SUV heterogeneity.
Processing of MRXFDG databaseThis had followed the same principles as for the Marseille database. Briefly, the images had been reviewed by two neurologists; the database included CT, T1, MRI, and FLAIR MRI and were coregistered to the PET scans using SPM12. Spatial normalisation was done in SPM12; intensity normalisation was conducted by calculating SUV (using subjects’ weight and injected dose) and SUVr (using the mean ICV mask provided by SPM12). Leave-one-out analyses had been conducted using the same methods used for the Marseille database. Region definition had been conducted using the same Hammers Atlas Database (i.e., the same regions) as for the Marseille database, but with the simpler method whereby a single maximum probability map in MNI space (containing information from all 30 atlases) was transferred back to individual space via the deformation fields derived from SPM (i.e. one registration per participant as opposed to 30 independent registrations per participant for MAPER). Full details of the process are provided in Merida et al. [1].
Processing of patient groupThe patient data were manually reoriented and realigned as above. However, as no MR images were available, normalisation to MNI space was performed using PET templates (cf. Figure 1). Three different templates were created from the PET images of control subjects normalised via their corresponding T1 MRI: (1) with the Marseille database only, (2) with iDB-MRXFDG only and (3) with both databases, each time using a ‘soft mean’ [31] equation within SPM’s imcalc function:
$$}\;} = \frac^ } }}^ \sim = 0} \right)} }}$$
where N is the total number of subjects and I is each PET image in the database.
The Normalise Estimate and Write function in SPM8 was then used to normalise the patient PET images to each of the three templates, resulting in three sets of normalised images. This PET-to-PET normalisation was then performed for both databases using their respective templates for comparison with patient data to ensure the database-specific normalisation method (i.e. MRXFDG controls normalised to the MRXFDG-derived template were compared with patients normalised to the MRXFDG template; Marseille controls normalised to the Marseille-derived template were compared with patients normalised to the Marseille template; combined controls normalised to the combined template were compared with patients normalised to the combined template; cf. Figure 1).
Merging of control databasesFor the Marseille and MRXFDG databases, we evaluated: (1) compatibility of resolution level, (2) systematic SUV differences at the voxel level, (3) age correlation with SUVs.
Image resolutionFrom visual inspection and as expected, the Marseille database had a lower resolution than MRXFDG. Such differences may be compensated by smoothing to a common resolution [14].
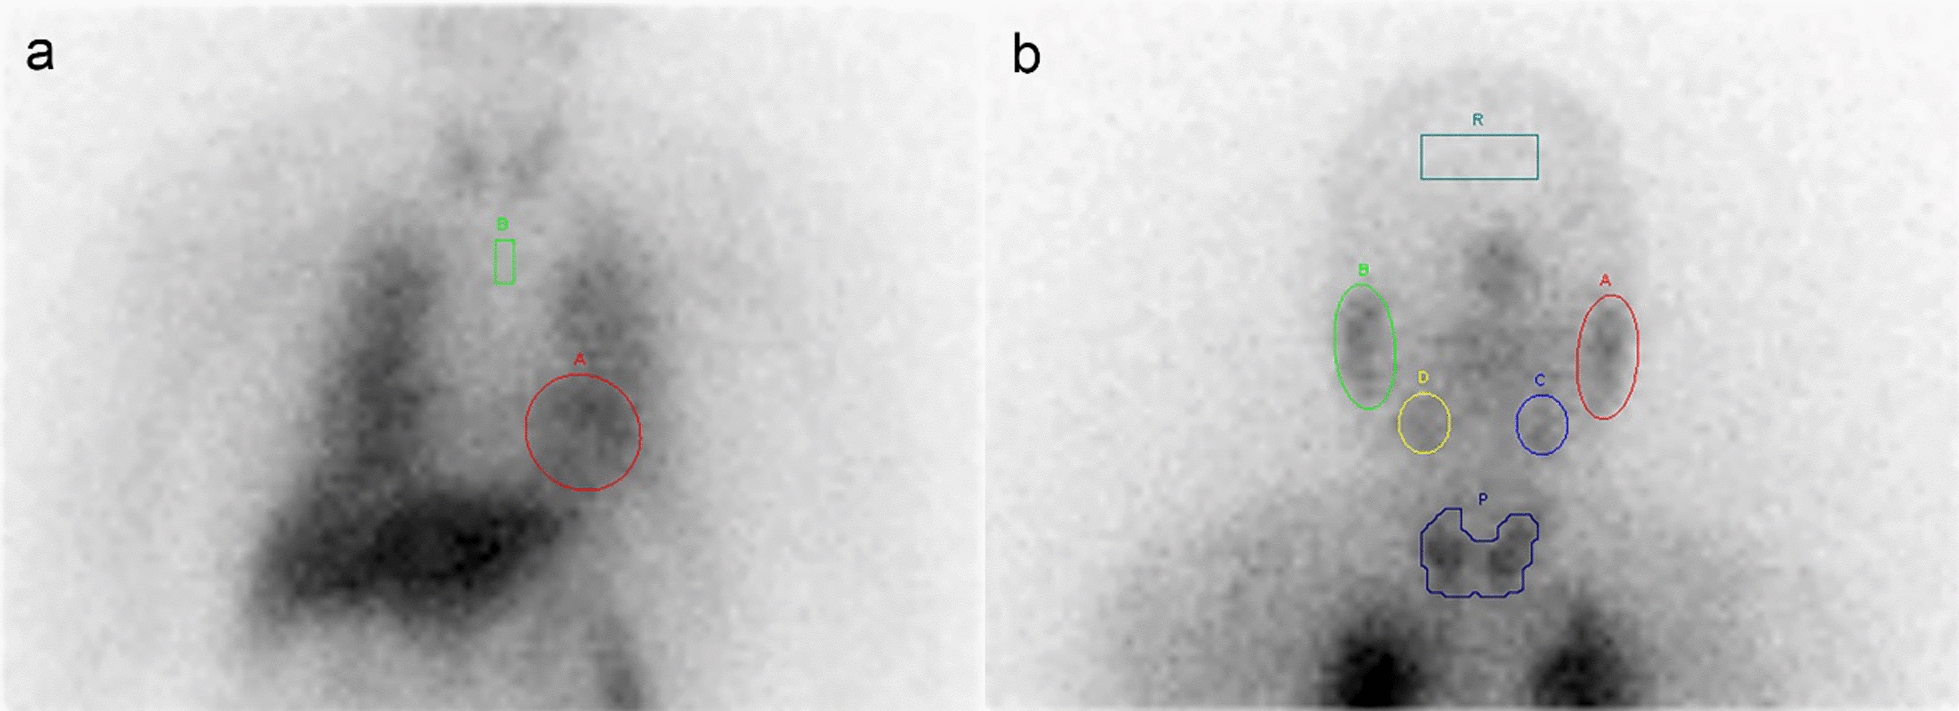
To determine the amount of smoothing needed for MRXFDG to reduce differences prior to SPM analysis, normalised PET images were smoothed with a Gaussian kernel of 8 × 8 × 8 mm FWHM, and MRXFDG additionally with a 10 × 10 × 10 mm FWHM kernel. We then selected an axial slice in the middle of the brain (slice 78) from 15 normalised ± smoothed PET images in each database, extracted intensity profiles from a diagonal line (Fig. 2), and measured the mean outer cortical gradient on the intensity profiles (between pixels 40–50 and 195–210). Absolute values of the gradients were compared and differences assessed via two-sample t tests with equal variance.
Fig. 2
Method for determining smoothness: selected slice and profile line (left side of Figure) and corresponding intensity profile (right side of Figure) for one subject of the Marseille database (top row) and one subject of iDB-MRXFDG (bottom row)
The optimised smoothing levels derived from this analysis were used in all subsequent experiments.
Age correlation analysisTotal brain volume decreases nonlinearly especially beyond the age of 60 [2, 32]. Correlations between [18F]FDG uptake and age were assessed with SPM12 on each control database. We then removed the oldest subjects by decade of age and repeated the analyses until most correlations disappeared.
Voxel-based differences in [18F]FDG mapsThe control databases were compared voxel-wise with a two-sample t test in SPM using the smoothing levels derived from the analysis of smoothness described above. The global values were taken into account as described above (section “Processing of the Marseille database—Leave-one-out SPM analysis”) including age as a linear covariate. Other settings were as above. Clusters were again formed and corrected for multiple comparisons as described above.
Detection of FCD-related decreases in [18F]FDG uptakeTo assess the FCD-related decreases in [18F]FDG uptake in patients with FCD in comparison with healthy subjects, different SPM models and ways to combine the two databases were explored, using the database-appropriate template as described above in the “Processing of patient group” section.
Analysis against each control database separatelyAn ANCOVA with group factor and age as covariate was performed against each database independently with the following settings: independent measurements; equal variance; grand mean scaling and ANCOVA; overall mean for centring; relative threshold masking (0.8); implicit but no explicit masking; global calculation omitted. Global normalisation with overall grand mean scaling (to 100), ANCOVA.
Analysis against combined control databasesTwo-sample t testA two-sample t test with age as covariate was conducted as for the separate control groups, simply combining the two databases into one.
Full factorial designThe full factorial design had three levels (patients and the two control groups) assumed to be independent (i.e., the global intensity ANCOVA was performed per group) and age as covariate. The other settings were the same as for the two-sample t tests.
Statistical assessment of patient resultsWe defined correct detection of the FCD as an area of significant decrease in uptake at the location of the area of resection of the histologically verified FCD.
Significant clusters were defined as in the leave-one-out analysis. However, as sensitivity is more important than specificity when screening for potential targets for intracranial EEG exploration, when no clusters were found at the initial threshold of p < 0.001, we also interrogated the SPMs at p < 0.01.
Influence of scanner type and patient characteristicsWe examined the detection rate for patients scanned on the three different cameras, using the best model derived above.
We also compared detection rates for patients whose FCD had been detected on MRI versus those who had been “MRI-negative”. The MRIs were classified as negative or positive after visual analysis by a neuroradiologist who had clinical information available both during reporting and during the multidisciplinary epilepsy surgery meetings.
Comments (0)