
記住我


Cancer-related financial hardship, defined as out-of-pocket costs and their accompanying financial distress, is a large and growing issue for individuals with cancer. Financial hardship affects individuals with cancer materially, such as trading off spending on food or housing to pay for medical bills; behaviorally, by delaying or foregoing medical care; and psychologically, through increased distress and decreased quality of life.1 Cancer-related financial hardship is also referred to as financial toxicity as it is increasingly considered an adverse side effect of cancer treatment that should be documented and addressed, similar to physical toxicities such as nausea or fatigue.2–4 Furthermore, studies have shown that minoritized or rural-dwelling patients experience more financial hardship than White or nonrural-dwelling patients.5–8
Currently, there are no standardized recommendations or guidelines surrounding oncologic financial hardship screening and follow-up.9 Thus, more research is needed to understand how to capture and use patient economic data to address financial hardship and improve patient outcomes in routine clinical settings. The aims of this study are to: (1) understand the feasibility of capturing patient economic data via integration of financial hardship screening as standard cancer care delivery10; and (2) describe the magnitude of and potential inequities in cancer-related financial hardship to help shape future interventions needed to reduce financial hardship experienced by individuals with cancer.
METHODS Study SettingThis secondary analysis of cross-sectional, clinic-based data evaluated both the feasibility and outcomes of financial hardship screening in routine oncologic care delivery at the University of Alabama at Birmingham (UAB). Financial hardship screening was piloted in patients aged 18 years or above initiating the treatment at the UAB Gynecologic Oncology clinic in October 2020 and expanded to the UAB Medical Oncology clinic in September 2021. Though screening is currently ongoing as standard care delivery, this study includes screening outcomes through May 2023. Research use of clinic-based, routinely collected patient-reported outcomes data was approved by the UAB Institutional Review Board.
Screening ImplementationFinancial hardship screening measures were incorporated into a standard-of-care treatment planning survey implemented as a practice transformation activity required within the Center for Medicare and Medicaid Innovation Center’s Oncology Care Model.10,11 This treatment planning document is generated from survey-based patient-reported data at cancer diagnosis and repeated every 6 months if still receiving treatment or at any treatment change. The treatment plan is embedded into the electronic medical record for provider review and patient education.10,12 Financial hardship screening measures were added to the survey in 2020. The screening was conducted by a trained lay navigator either in-person at a clinic visit or over the phone. Lay navigators were trained to refer patients who screened positive for financial hardship to the social worker, financial counselor, or billing office personnel. Any potential financial distress was addressed by a referral to psycho-oncology.
Financial Hardship ScreeningFinancial hardship screening comprised: (1) a validated measure of financial distress; and (2) 10 individual domains of financial difficulty.
Financial DistressThe 11-item COmprehensive Score for financial Toxicity (COST) tool was used to capture cancer-related financial distress.13,14 The COST is scored from 0 to 44, with lower scores indicating more financial distress. For this study, COST was dichotomized, with scores <26 or <14, indicating mild/moderate or severe financial distress, respectively.15,16
Domains of Financial DifficultyDomains included trouble paying for basic needs, utilities, transportation or lodging for treatment, medications, medical supplies, upfront medical payments, insurance or medical bills, child or eldercare, and employment or disability issues. Patients reported the degree of difficulty or problems affording each item, which was dichotomized as none (“no difficulty/problems”) versus any (“some difficulty/problems,” “a lot of difficulty/problems”).
Patient DataTo assess financial hardship outcomes for this study, patient demographic and clinical data were abstracted from the electronic medical record, including age at screening, race [White, Black, Indigenous, or persons of color (BIPOC)], sex (male, female), rurality (rural, nonrural), and cancer type. Zip codes classified patient residence as rural or nonrural using Rural-Urban Commuting Area Codes.17
AnalysisCompletion of financial hardship screening and reported financial distress were compared by patient sociodemographics using effect sizes (Cohen d and Cramer V). Feasibility, defined as 75% completion of the financial hardship screening, was evaluated using monthly proportions completed among those who completed a treatment planning survey. Proportions of financial distress and difficulty reported at the time of screening were also evaluated overall and by patient race and rurality. Modified Poisson models estimated the risk of financial distress by patient sociodemographics using risk ratios and 95% CIs. The sensitivity and specificity of reported financial distress were calculated using proportions of patients, also reporting any domain of financial difficulty.18
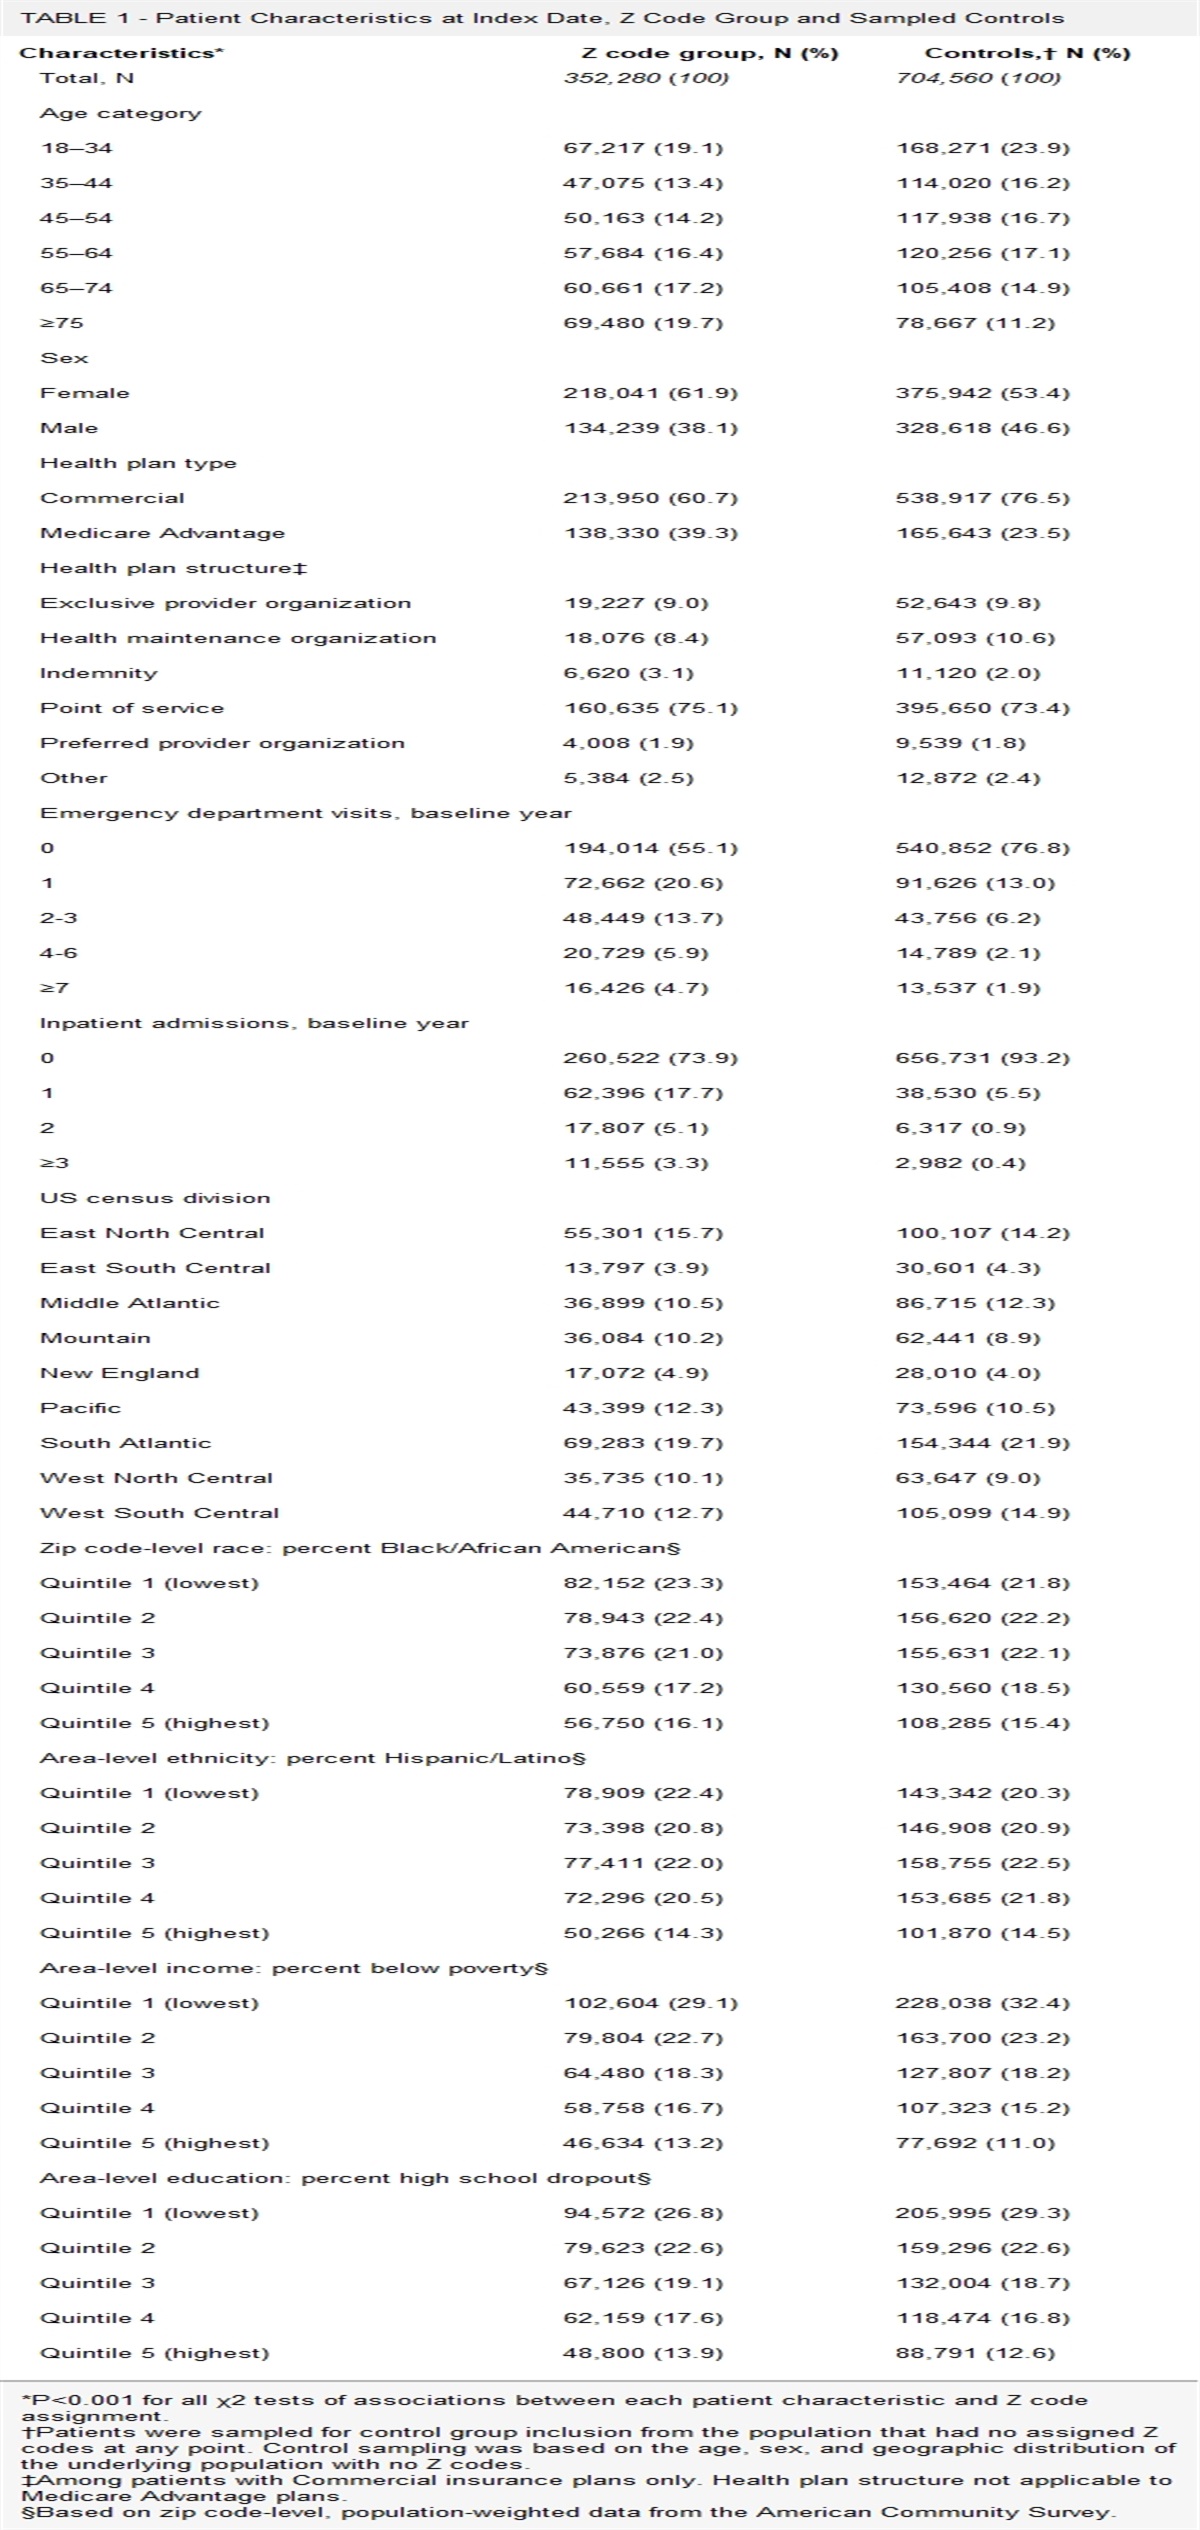
RESULTS Screening FeasibilityOf 2741 patients with cancer who completed a treatment planning survey, the median age at screening was 64 years (interquartile range 54–72), 18% were BIPOC, and 16% resided in a rural location (Table 1). Patients completed 3121 treatment planning surveys over 31 months, with similar sociodemographic and clinical characteristics found between patients completing and not completing screening (Table 2). The majority of patients who completed a treatment planning survey (n=2319) also completed financial distress (90%, monthly range 81%–100%) and financial difficulty (88%, monthly range 76%–100%) screening, which surpassed the target feasibility completion rate of 75% (Fig. 1). Completion was similar by race and rurality.
TABLE 1 - Sociodemographic and Clinical Characteristics for Patients Completing Financial Hardship Screening (N=2319) Patient characteristics Total N=2319 n (%) Reported financial distress n=858, n (%) No reported financial distress n=1461, n (%) V Age at screening (median, IQR) 64 (54–72) 60 (49–67) 67 (58–73) d=0.5 Sex — — — 0.01 Male 687 (30) 251 (29) 436 (30) — Female 1632 (70) 607 (71) 1025 (70) — Race — — — 0.15 White 1531 (66) 487 (57) 1044 (71) — Black/Indigenous/person of color 426 (18) 213 (25) 213 (15) — Unknown 362 (16) 158 (18) 204 (14) — Residence — — — 0.13 Rural 225 (10) 73 (9) 152 (10) — Urban 1171 (51) 370 (43) 801 (55) — Unknown 923 (40) 415 (48) 508 (35) — Cancer type — — — 0.11 Breast 520 (22) 218 (25) 302 (21) — Gastrointestinal 305 (13) 117 (14) 188 (13) — Genitourinary 109 (5) 33 (4) 76 (5) — Gynecologic 429 (19) 122 (14) 307 (21) — Hematologic 139 (6) 42 (5) 97 (7) — Other 260 (11) 108 (13) 152 (10) — Unknown 557 (24) 218 (25) 339 (23) — Financial difficulty Any reported financial difficulty 1169 (50) 758 (88) 411 (28) 0.59 No reported financial difficulty 1137 (49) 91 (11) 1046 (72) — Unknown 13 (1) 9 (1) 4 (0.3) —IQR indicates interquartile range.
IQR indicates interquartile range.
 FIGURE 1:
 Proportion and count of UAB oncology patients with a treatment planning survey who completed financial hardship screening from October 2020 to May 2023 (N=2741).
Financial Hardship OutcomesFinancial hardship screening revealed 34% of patients were experiencing any financial distress (monthly range 9%–64%) and 12% severe financial distress (monthly range 0%–55%; Fig. 2A). While few differences were seen when comparing financial distress by rural-dwelling and nonrural-dwelling patients, large differences were found by race and ethnicity with 49% of BIPOC patients screening positive for financial distress (monthly range 0%–100%) compared with 30% of White patients (monthly range 2%–60%; Fig. 2B). Adjusted models revealed BIPOC patients had 48% higher risk of financial distress compared with those who were White (risk ratio 1.48, 95% CI, 1.31–1.66; Supplemental Table 1, Supplemental Digital Content 1, https://links.lww.com/MLR/C703).
 FIGURE 2:
 A, Proportion of patients screened experiencing any financial distress (COmprehensive Score for financial Toxicity <26) and severe financial distress (COmprehensive Score for financial Toxicity <14; N=2741). B, Proportion of patients who were White (n=1804) versus BIPOC (n=505) experiencing financial distress. BIPOC indicates Black, Indigenous, or persons of color.
Patients most often reported financial difficulty with insurance or medical bills (32% of patients), upfront medical payments (29%), and medications (22%; Fig. 3). Large differences in the proportion of financial difficulty were found by race and ethnicity, including paying for utilities (33% BIPOC vs. 10% White), upfront medical payments (44% vs. 23%), insurance or medical bills (44% vs. 27%), and transportation for treatment (28% vs. 12%; Supplemental Table 2, Supplemental Digital Content 1, https://links.lww.com/MLR/C703). Small differences were found comparing financial difficulties by residence, including lodging for treatment (16% rural-dwelling vs. 12% nonrural-dwelling), medications (20% nonrural-dwelling vs. 16% rural-dwelling), and utilities (15% nonrural-dwelling vs. 13% rural-dwelling). Reported financial hardship showed acceptable sensitivity (88%) and specificity (72%) when comparing patient report of both financial distress and difficulty (Table 1).
 FIGURE 3:
 Proportion of patients reporting financial difficulty with specific medical and nonmedical items overall and by race and ethnicity (N=2741). BIPOC indicates Black, Indigenous, or persons of color.
DISCUSSIONThis study found that collection of patient-reported financial hardship data via routine clinical care was feasible and identified racial inequities at treatment initiation. Because of 34% of patients experiencing financial distress, our results revealed a need for response and triage to financial assistance or supportive resources. Efforts are currently ongoing to engage social workers and financial counselors with patients who screen positive for financial hardship as part of standard-of-care, as well as to solidify referral patterns to intervene upon and reduce the impact of cancer care-related financial hardship. Solidifying personnel bandwidth is particularly critical as rescreening at a follow-up interval (ie, 6 mo) can identify patients who develop financial hardship later in the treatment course.
Collection of patient-reported financial hardship data often comes at considerable time and cost, both of which are barriers to real-world data collection and response. Our 88%–90% feasibility rate of capturing these data was due to our almost 10-year-long effort building data capacity to capture patient-reported outcomes and, importantly, subsequent reimbursement via participation in the Oncology Care Model.11 Practices participating in the next iteration of the Oncology Care Model, Centers for Medicare & Medicaid Services’ Enhancing Oncology Model, will also receive payment incentives for health-related social needs screening. However, this model is voluntary and temporary. Given the resources required to collect such information, efforts by the Centers for Medicare & Medicaid Services and other payors should focus on the creation of a permanent billing code for financial hardship screening,19 which differs from existing ICD-10 diagnostic Z codes that capture general socioeconomic hardship.20 Ideally, use of ICD-10 procedure codes would properly reimburse for both technological and staff resources required for financial hardship screening, linkage to resources, and follow-up. Through sufficient reimbursement, billing codes could build the clinic-level and system-level capacity to address financial hardship and improve patient outcomes, but testing feasibility and efficacy of these codes across different systems are needed before implementation.
Improving data and care delivery capacity in this respect is imperative, as our screening initiative revealed 34% of patients were experiencing financial distress during treatment planning, assumedly before they were billed for larger cancer-related expenses. This finding is alarming since a recent study estimated 42% of individuals with cancer depleted their entire life assets within 2 years of their cancer diagnosis.21 Thus, longitudinal financial hardship screening throughout treatment and into survivorship is needed to identify and mitigate financial hardship as patients incur more medical and nonmedical bills related to their cancer care.22–27
Collection of patient economic data is also critical for tailored intervention development for health care systems in geographic areas where systemic issues, such as persistent poverty, Medicaid politics, and structural racism, create barriers to cancer care delivery. Notably, our sample is not nationally representative since 17% of Alabamians live below the federal poverty threshold compared with the national average of 13%.28 Alabama is also 1 of the 12 Medicaid nonexpansion states, leaving ~127,000 uninsured and economically under-resourced Alabamians in the coverage gap.29 Therefore, the design and implementation of interventions to address financial hardship should reflect the needs identified within the patient catchment area.
Financial hardship interventions should also be tailored to patient-level characteristics. One of the most striking findings of our study was the large inequities in reported financial hardship by race and ethnicity, with BIPOC patients having a 48% higher risk of financial distress than White patients, along with 7%–23% higher reported medical and nonmedical financial difficulties for every category included on the screener. Previous research has also shown patients who are Black or African American more often report cancer-related financial hardship, medical debt, care alterations, and lower health-related quality of life when compared with White patients.5,6,30 More research is needed to understand potential strategies to reduce cancer-related financial hardship stemming from impacts of broader societal forces such as systemic racism.
Conversely, few differences in reported financial hardship were found for patients living in rural or nonrural areas, which may stem from the timing of screening. Though previous studies found that rural cancer survivors more often report financial hardship when compared with survivors living in urban areas,7,8 most patients were ≥5 years from their last cancer treatment, while patients in our study were initiating treatment. Thus, cancer treatment costs incurred over time may result in differential financial burden for patients residing in rural and urban areas. Improved data capacity will enable a better understanding of what drives potential geographic inequities for individuals with cancer both during active treatment and into survivorship.
This study has several limitations. Our results may underestimate the prevalence of financial hardship for patients with cancer since patients who are of a lower socioeconomic status may seek to receive care locally or may delay or forgo cancer treatment. Treatment planning surveys implemented as part of OCM were more often completed by Medicare beneficiaries. This study was also conducted during the COVID-19 pandemic, which may bias who was willing or able to be seen in a clinical setting.
CONCLUSIONSThis initiative to collect financial hardship data in a routine clinical setting found lay navigator–led financial hardship screening to be feasible, and identified racial inequities in patients experiencing financial hardship at treatment initiation. Future efforts to collect patient-level financial hardship data should be designed to support the design, implementation, and evaluation of tailored, patient-centered interventions to improve equity and reduce the impact of financial hardship at cancer treatment initiation and throughout cancer treatment.
ACKNOWLEDGMENTSThe authors thank the funding from the Office of the Assistant Secretary for Planning and Evaluation (ASPE) to support travel to the Symposium on Building Data Capacity to Study Economic Outcomes for Patient-Centered Outcomes Research that was held on December 5, 2022, and provided an opportunity for the authors to present their work and receive feedback from attendees.
REFERENCES 1. Altice CK, Banegas MP, Tucker-Seeley RD, et al. Financial hardships experienced by cancer survivors: a systematic review. J Natl Cancer Inst. 2017;109:djw205. 2. Zafar SY. Financial toxicity of cancer care: it’s time to intervene. J Natl Cancer Inst. 2016;108:djv370. 3. Zafar SY, Abernethy AP. Financial toxicity, part I: a new name for a growing problem. Oncology (Williston Park). 2013;27:80–81; 149. 4. Zafar SY, Abernethy AP. Financial toxicity, part II: how can we help with the burden of treatment-related costs? Oncology (Williston Park). 2013;27:253–254; 256. 5. Hastert TA, Banegas MP, Hamel LM, et al. Race, financial hardship, and limiting care due to cost in a diverse cohort of cancer survivors. J Cancer Surviv. 2019;13:429–437. 6. Hastert TA, Kyko JM, Reed AR, et al. Financial hardship and quality of life among African American and White cancer survivors: the role of limiting care due to cost 2019;28:1202–1211. 7. Odahowski CL, Zahnd WE, Zgodic A, et al. Financial hardship among rural cancer survivors: an analysis of the Medical Expenditure Panel Survey. Prev Med. 2019;129(suppl):105881. 8. Zahnd WE, Davis MM, Rotter JS, et al. Rural-urban differences in financial burden among cancer survivors: an analysis of a nationally representative survey. Support Care Cancer. 2019;27:4779–4786. 9. Khera N, Sugalski J, Krause D, et al. Current practices for screening and management of financial distress at NCCN Member Institutions. J Natl Compr Canc Netw. 2020;18:825–831. 10. Rocque GB, Williams CP, Hathaway AR, et al. Evaluating the impact of treatment care planning on quality measures. J Oncol Pract. 2019;15:e271–e276. 11. Rocque GB, Dent DAN, Caston NE, et al. Building sustainable practice transformation through payment reform initiatives. JCO Oncol Pract. 2022;18:e731–e739. 12. Rocque GB, Cadden A. Creation of Institute of Medicine Care Plans with an eye on up-front care. J Oncol Pract. 2017;13:512–514. 13. de Souza JA, Yap BJ, Hlubocky FJ, et al. The development of a financial toxicity patient-reported outcome in cancer: the COST measure. Cancer. 2014;120:3245–3253. 14. de Souza JA, Yap BJ, Wroblewski K, et al. Measuring financial toxicity as a clinically relevant patient-reported outcome: the validation of the COmprehensive Score for financial Toxicity (COST). Cancer. 2017;123:476–484. 15. Liang MI, Pisu M, Summerlin SS, et al. Extensive financial hardship among gynecologic cancer patients starting a new line of therapy. Gynecol Oncol. 2020;156:271–277. 16. De Souza JA, Wroblewski K, Proussaloglou E, et al. Validation of a financial toxicity (FT) grading system. Am Soc Clin Oncol. 2017;35 (supp 15). 18. Power M, Fell G, Wright M. Principles for high-quality, high-value testing. Evidence Based Medicine. 2013;18:5–10. 19. Bradley CJ, Yabroff KR, Zafar SY, et al. Time to add screening for financial hardship as a quality measure? CA Cancer J Clin. 2021;71:100–106. 20. Gottlieb LM, DeSilvey SC. New clinical coding guidelines account for patients’ social risk: we should do more to ensure they advance health care quality and equity. Health Affairs blog. 2020;3. 21. Gilligan AM, Alberts DS, Roe DJ, et al. Death or debt? National estimates of financial toxicity in persons with newly-diagnosed cancer. Am J Med. 2018;131:1187–1199.e1185. 22. Lee A, Shah K, Chino F. Assessment of parking fees at National Cancer Institute–Designated Cancer Treatment Centers. JAMA Oncol. 2020;6:1295–1297. 23. Rocque GB, Williams CP, Miller HD, et al. Impact of travel time on health care costs and resource use by phase of care for older patients with cancer. J Clin Oncol. 2019;37:1935–1945. 24. Yabroff KR, Mariotto A, Tangka F, et al. Annual report to the nation on the status of cancer, part 2: patient economic burden associated with cancer care. J Natl Cancer Inst. 2021;113:1670–1682. 25. Blinder VS, Gany FM. Impact of cancer on employment. J Clin Oncol. 2020;38:302. 26. Nekhlyudov L, Madden J, Graves AJ, et al. Cost-related medication nonadherence and cost-saving strategies used by elderly Medicare cancer survivors. J Cancer Surviv. 2011;5:395–404. 27. Williams CP, Davidoff A, Halpern MT, et al. Cost-related medication nonadherence and patient cost responsibility for rural and urban cancer survivors. JCO Oncol Pract. 2022;18:e1234–e1246. 28. 2020 Barriers to Prosperity Data Sheet: 800,000 Alabamians live in poverty; Alabama fifth poorest state. 2020. Accessed October, 2022. https://alabamapossible.org/2020/05/21/4480/ 29. Garfield R, Orgera K, Damico A The Coverage Gap: Uninsured Poor Adults in States that Do Not Expand Medicaid. 2019. Accessed April 12, 2019.https://www.kff.org/medicaid/issue-brief/the-coverage-gap-uninsured-poor-adults-in-states-that-do-not-expand-medicaid/ 30. Panzone J, Welch C, Morgans A, et al. Association of race with cancer-related financial toxicity. JCO Oncol Pract. 2022;18:e271–e283.
留言 (0)