
Remember me

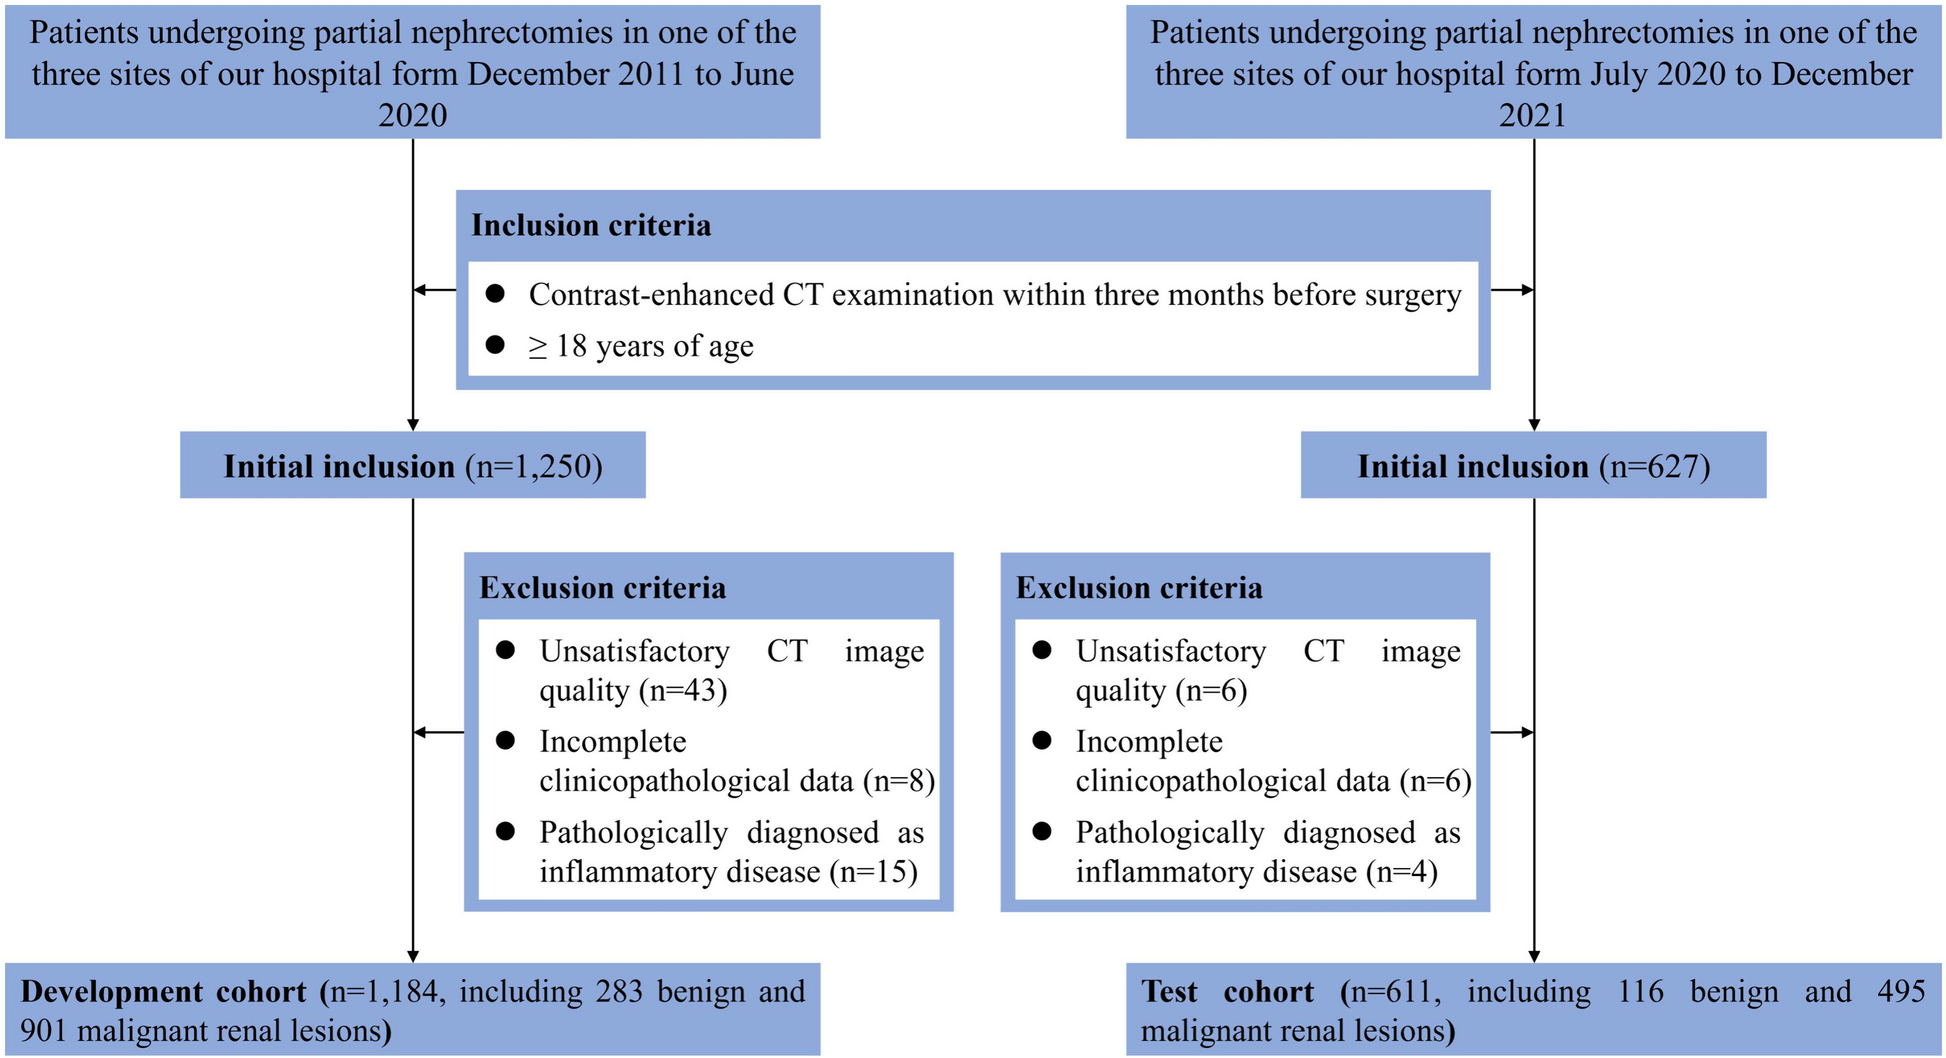
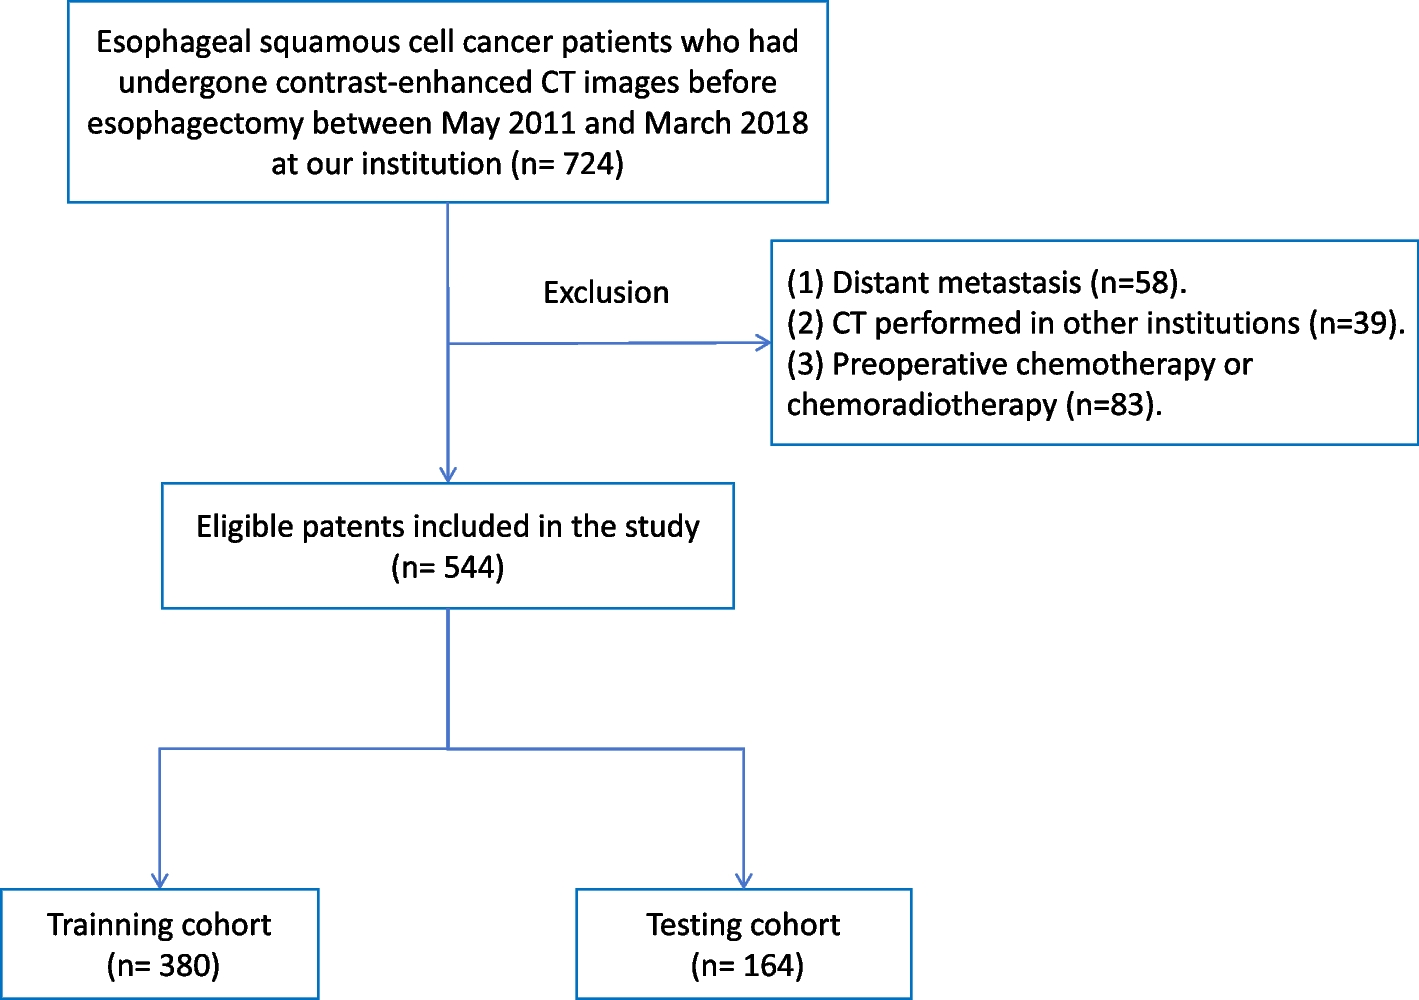


This retrospective study was approved by the institutional review board of Asan Medical Center, and the requirement for informed consent was waived (IRB No.2021 − 1300). We identified patients with NSCLC who underwent ICI monotherapy at Asan Medical Center between January 2014 and April 2021 and who had BM at the time of initiation of index ICI therapy. Between January 2014 and April 2021, 87 patients with NSCLC and brain metastasis were treated with ICI monotherapy. From these, patients were excluded because of the following: received immunotherapy before the administration of index ICI (n = 4); received only one dose of ICI because of death (n = 1), pneumonia (n = 3), or disease progression before the administration of initial ICI (n = 2); lung cancer with synchronous breast cancer (n = 1); bone metastasis (n = 1); baseline MRI was not available prior to the administration of initial ICI (n = 2); and absence of adequate follow-up MRI for response evaluation (n = 10). Finally, a total of 63 patients (median age, 63 years; range, 42–80; 12 female) were included in the study.
Imaging acquisitionBrain MRI was obtained with either 1.5 or 3 T scanners and included T2-weighted, T2-weighted FLAIR, and precontrast and postcontrast T1-weighted images. The imaging parameters are summarized in Supplementary Table 1. An MRI within 2 months of ICI initiation was considered the baseline brain imaging, and follow-up MRIs were obtained every 4–8 weeks after initiating therapy.
Study designThe study had two co-primary purposes. The first purpose was to measure and compare responses using different response criteria: mRECIST, RANO-BM, and iRANO-BM for each patient. The second purpose was to investigate whether there is an association between the initial response measured by the subtraction method of the sum of longest diameter (SLD)—indicated by the change in the diameter of target lesions between the BOR date and the baseline date—and overall survival (OS).
Response assessment using different response criteriaImage analysis was performed by two neuroradiologists acting as central readers (J.E.P. and H.S.K., with 9 and 24 years of experience in neuro-oncologic imaging, respectively), who were blinded to the outcomes of the patients. The readers measured the tumors on baseline MRI and follow-up MRI and determined the patients’ responses by comparing the baseline and follow-up images. The date of best overall response (BOR), which was defined as the single best response status across all response evaluation time points until disease progression, and date of progression were recorded by the readers.
The readers chose five target measurable lesions for mRECIST (≥ 5 mm in the smallest diameter) and RANO-BM/iRANO-BM (≥ 10 mm in one diameter) assessments. If there were more than five lesions present, the target lesions were chosen in descending order of size; iRANO adjusted for BM (iRANO-BM) was applied by measuring the longest diameter. Any discrepancies in the choice of target lesions were solved through discussion. The locations of the target lesions were recorded, and their diameters were measured on MRI. The SLDs of the five target lesions was calculated for mRECIST, RANO-BM, and iRANO-BM. Notably, RANO-BM allows the use of a 5 mm cutoff if the slice thickness is equal to or less than 1.5 mm. In this study, the slice thicknesses were 3 mm, and the 10 mm cutoff was adopted.
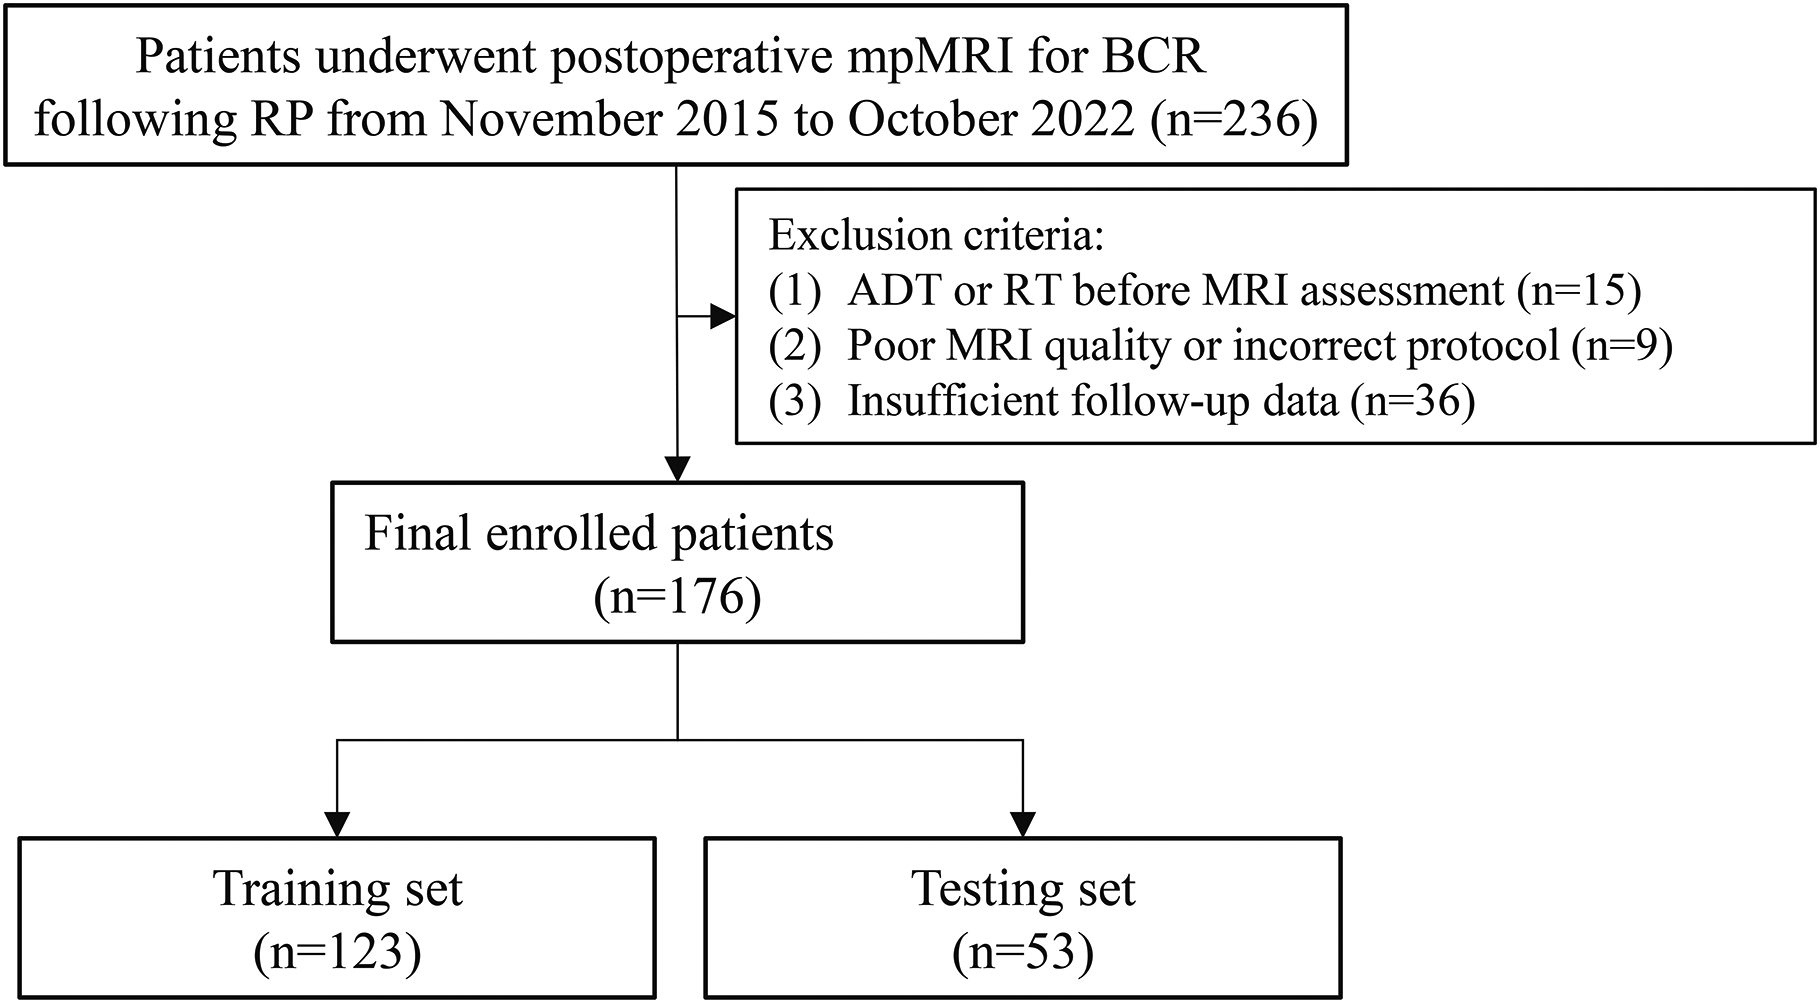
Supplementary Table 2 summarizes the response assessment criteria of mRECIST, RANO-BM, and iRANO-BM for complete response (CR), partial response (PR), stable disease (SD), and progressive disease (PD). The overall response rate (ORR) was defined as CR plus PR rates, and the disease control rate was defined as CR plus PR plus SD rates. Figure 1 shows representative cases showing different response assessments according to each set of response assessment criteria.
Fig. 1
Baseline and Follow-up MRI Scans of a Patient with Different Response Assessments
A. Baseline scan (a, b) shows a target lesion of 13 mm. First follow-up scan at week 8 (c, d) shows that the target lesion has decreased in size from 13 mm to 5 mm, and that a new lesion of 6 mm has appeared. Since a new lesion has developed, progressive disease (PD) is defined by mRECIST. However, according to the RANO-BM and iRANO-BM criteria, the diameter of the new lesion is added to the sum of the longest diameter (SLD), which makes the SLD 11 mm for the follow-up scan. Therefore, the response assessment would be stable disease (SD) by RANO-BM and iRANO-BM. B. Baseline scan (a, b) shows two target lesions with sizes of 13 and 8 mm. On the first follow-up scan at week 20 (c, d), the size of each target lesion has increased, and the response assessment would be progressive disease (PD) by mRECIST and RANO-BM. However, this MRI was taken within 6 months of immunotherapy-treatment initiation, and follow-up imaging after 3 months is required for iRANO-BM assessment. In the follow-up MRI at week 40 (e, f), the size of the target lesions has decreased, and this patient is diagnosed with stable disease (SD) by iRANO-BM
Quantitative assessment: changes in SLDs and volumetryFor the mRECIST, RANO-BM, and iRANO-BM criteria, the “changes in SLDs” were calculated as follows: (SLD of the target lesions at the BOR date) − (SLD of the target lesions at the baseline date). A similar calculation was applied for volumetric measurement: (total tumor volume at BOR date) − (total tumor volume at baseline date). The BOR date of the volumetric assessment was taken to be the time point of the smallest sum of the lesion volumes.
There was a 3-month wash-out period between response assessment and volumetric measurement. All images were anonymized, and the readers were blind to any clinical information. For volumetric analysis, the MRI examinations were subjected to preprocessing including resampling to 1 × 1 × 1 mm and co-registration performed using AFNI software (Analysis of Functional NeuroImages) [12]. Segmentation of the enhancing tumor region was performed by a neuroradiologist (Y.H.R., with 1 year of experience in neuro-oncological imaging) using a semi-automatic procedure on the 3D contrast-enhanced T1-weighted imaging. This procedure used a segmentation threshold and a region-growing segmentation algorithm implemented using MITK software (www.mitk.org German Cancer Research Center, Heidelberg, Germany) [13]. For volumetric analysis, all measurable and nonmeasurable enhancing lesions were segmented and summed. All segmented images were validated by an experienced neuroradiologist (J.E.P.) after central reading.
Since patients identified with PD at the initial follow-up MRI did not continue ICI after only one course of ICI therapy, these patients were excluded (n = 6) from the OS analysis because of the short follow-up, limited effect of ICI therapy on OS, and confounding factors of other treatments initiated after ICI termination.
OutcomesThe primary endpoints were the associations between OS and the changes in SLDs, as well as change in volumetry. Overall survival was calculated from the date of baseline imaging to the date of death from any cause. The date of death was obtained from the national healthcare data linked to our hospital, and the date of the last follow-up MRI was considered the censored date.
For the secondary endpoints, we compared the median progression-free survival (PFS), ORR, and PD assignments according to the mRECIST, RANO-BM, and iRANO-BM criteria. Progression-free survival was calculated as the period from the date of the baseline imaging to the date of progression or death due to any cause, or if no progression was observed, from baseline imaging date to the censored date.
Statistical analysis Comparisons between response criteriaTo compare the level of agreement, a weighted kappa analysis was performed using Fleiss-Cohen quadratic weights. The agreement between two response criteria was categorized as follows: poor (κ = 0–0.20), mild (κ = 0.21–0.40), moderate (κ = 0.41–0.60), substantial (κ = 0.61–0.80), and almost perfect (κ > 0.80).
The proportions of the best CNS responses according to mRECIST, RANO-BM, and iRANO-BM classifications were analyzed. The McNemar test was used to compare differences in the proportions of patients defined with PD according to each set of criteria.
Comparison of clinical outcomesThe OS and PFS results are reported as medians with 95% confidence intervals (CIs). Differences in PFS between the criteria were calculated using the Wilcoxon signed-rank test, and the results were corrected for multiple comparisons using the Bonferroni adjustment (resulting in a P-value of < 0.017 being considered significant).
Statistical power for the pairwise comparisons of median PFS between criteria was estimated using paired z-tests (PASS 15.0.7. version). For example, between mRECIST and RANO-BM, with a sample size of 63, an assumed mean of paired differences of 2 months, and a calculated standard deviation of 3.39 months, a statistical power of 99% was achieved to detect this mean difference in paired differences. The statistical power calculations are summarized in Supplementary Table 3.
Survival curves for OS were drawn for each set of response criteria using the Kaplan-Meier method. A log-rank test was used to determine differences in OS between PD and non-PD patients as defined by each set of response criteria.
The correlation between OS and PFS for each criterion was evaluated using Spearman’s rank correlation coefficient.
Prediction of OS using quantitative measurementsCox proportional hazards regression analysis was applied to the changes in SLDs and change in volumetry as a single covariable to determine the association with OS. Hazard ratios (HRs) and their corresponding 95% CIs were also calculated.
Descriptive statistics were used to analyze categorical and continuous variables of the patient demographics. For continuous variables, the normality of the distribution was assessed using the Kolmogorov-Smirnov test. Normally distributed numerical variables are presented as mean and standard deviation, and non-normally distributed numerical variables are presented as median and range.
For all statistical analyses except those that were Bonferroni corrected, two-sided P-values < 0.05 were considered statistically significant. All statistical analysis was conducted using R statistical software (version 4.1.3, Vienna, Austria) and Medcalc software (version 20.115, Ostend, Belgium).
Comments (0)